. 2022 Nov 5;12(11):1072.
doi: 10.3390/metabo12111072.

Mapping of Urinary Volatile Organic Compounds by a Rapid Analytical Method Using Gas Chromatography Coupled to Ion Mobility Spectrometry (GC-IMS)

Affiliations

Mapping of Urinary Volatile Organic Compounds by a Rapid Analytical Method Using Gas Chromatography Coupled to Ion Mobility Spectrometry (GC-IMS)

Giulia Riccio et al. Metabolites. .

Abstract

Volatile organic compounds (VOCs) are a differentiated class of molecules, continuously generated in the human body and released as products of metabolic pathways. Their concentrations vary depending on pathophysiological conditions. They are detectable in a wide variety of biological samples, such as exhaled breath, faeces, and urine. In particular, urine represents an easily accessible specimen widely used in clinics. The most used techniques for VOCs detections are expensive and time-consuming, thus not allowing for rapid clinical analysis. In this perspective, the aim of this study is a comprehensive characterisation of the urine volatilome by the development of an alternative rapid analytical method. Briefly, 115 urine samples are collected; sample treatment is not needed. VOCs are detected in the urine headspace using gas chromatography coupled to ion mobility spectrometry (GC-IMS) by an extremely fast analysis (10 min). The method is analytically validated; the analysis is sensitive and robust with results comparable to those reported with other techniques. Twenty-three molecules are identified, including ketones, aldehydes, alcohols, and sulphur compounds, whose concentration is altered in several pathological states such as cancer and metabolic disorders. Therefore, it opens new perspectives for fast diagnosis and screening, showing great potential for clinical applications.

Keywords: GC–IMS; metabolomics; urine; volatile organic compounds; volatilomics.


Conflict of interest statement

The authors declare no conflict of interest.

Figures

Figure 1
Figure 1
(a) Example of GC–IMS output of the ketone mix profile at the concentration of 108 ppb. The detected compounds have been highlighted. Each compound’s Dt has been normalised by means of the software application to the signal of the reaction ion peak (RIP). It represents the total number of ions available for ionisation, and therefore, it is used as the reference signal. The colour representation corresponds to a three-dimensional spectrum. An increasing concentration of VOCs is outlined by the colour change from blue to red. (b) Calibration curve obtained with the VOCal software by measuring the ketones mixture at seven different concentrations in the range of 218.4–10.8 ppb. Each colour corresponds to a detected compound in the ketone mix (blue = 2-butanone; green = 2-pentanone, red = 2-hexanone; light blue = 2-heptanone; black = 2-octanone). Dots represent the signal intensity for the concentrations analysed (expressed as arbitrary unit, a.u.); lines show the fit of the calibration curve. (c) Linearity range for 4-heptanone analysed by means of GC–IMS. The linearity curve and the regression line are reported for the concentration range of 0–128 ppb. (d) Calibration curve obtained with the VOCal software by measuring 4-heptanone at five different concentrations in the range of 0–160 ppb.
Figure 2
Figure 2
Example of GC–IMS spectrum of a urine sample. Detected VOCs have been highlighted. Increasing concentrations of VOCs are outlined by the colour change from blue to red.
Figure 3
Figure 3
Graphical representation of VOCs profile in urine samples. The x-axis shows detected VOCs grouped in classes of molecules, and the y-axis shows the number of samples showing that VOC.
Figure 4
Figure 4
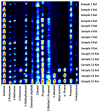
Gallery plot of GC–IMS signals of 14 VOCs species detected in 15 urine samples with ketone bodies value over 60 mg/dL.

References

    1. da Costa B.R.B., De Martinis B.S. Analysis of Urinary VOCs Using Mass Spectrometric Methods to Diagnose Cancer: A Review. Clin. Mass Spectrom. 2020;18:27–37. doi: 10.1016/j.clinms.2020.10.004. - DOI - PMC - PubMed
    1. Behera B., Joshi R., Vishnu G.A., Bhalerao S., Pandya H.J. Electronic Nose: A Non-Invasive Technology for Breath Analysis of Diabetes and Lung Cancer Patients. J. Breath Res. 2019;13:024001. doi: 10.1088/1752-7163/aafc77. - DOI - PubMed
    1. Van Vliet D., Smolinska A., Jöbsis Q., Rosias P., Muris J., Dallinga J., Dompeling E., Van Schooten F.J. Can Exhaled Volatile Organic Compounds Predict Asthma Exacerbations in Children? J. Breath Res. 2017;11:016016. doi: 10.1088/1752-7163/aa5a8b. - DOI - PubMed
    1. Shigeyama H., Wang T., Ichinose M., Ansai T., Lee S.W. Identification of Volatile Metabolites in Human Saliva from Patients with Oral Squamous Cell Carcinoma via Zeolite-Based Thin-Film Microextraction Coupled with GC-MS. J. Chromatogr. B. Analyt. Technol. Biomed. Life Sci. 2019;1104:49–58. doi: 10.1016/j.jchromb.2018.11.002. - DOI - PubMed
    1. Greco V., Piras C., Pieroni L., Ronci M., Putignani L., Roncada P., Urbani A. Applications of MALDI-TOF Mass Spectrometry in Clinical Proteomics. Expert Rev. Proteom. 2018;15:683–696. doi: 10.1080/14789450.2018.1505510. - DOI - PubMed

LinkOut - more resources