

Plasma Metabolomic and Lipidomic Profiling of Metabolic Dysfunction-Associated Fatty Liver Disease in Humans Using an Untargeted Multiplatform Approach
- PMID: 36355164
- PMCID: PMC9693407
- DOI: 10.3390/metabo12111081
Plasma Metabolomic and Lipidomic Profiling of Metabolic Dysfunction-Associated Fatty Liver Disease in Humans Using an Untargeted Multiplatform Approach
Abstract
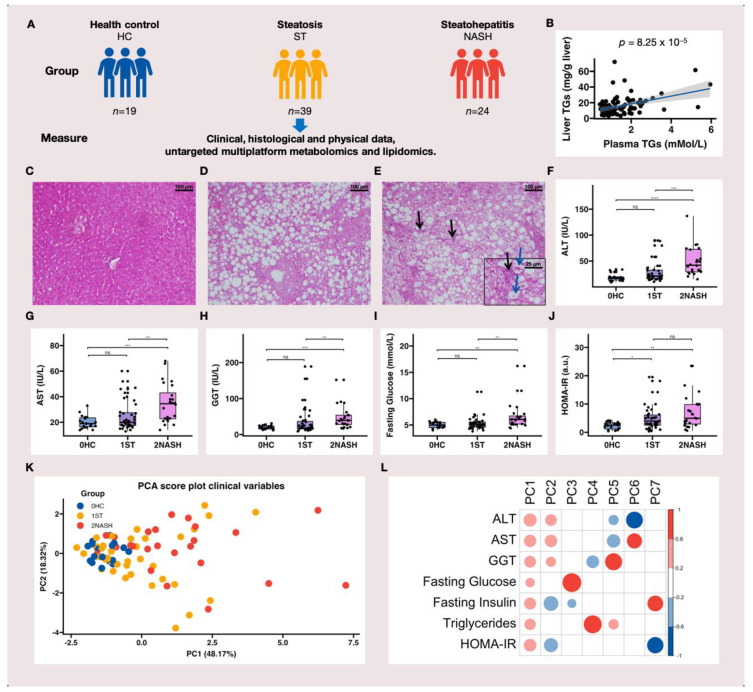
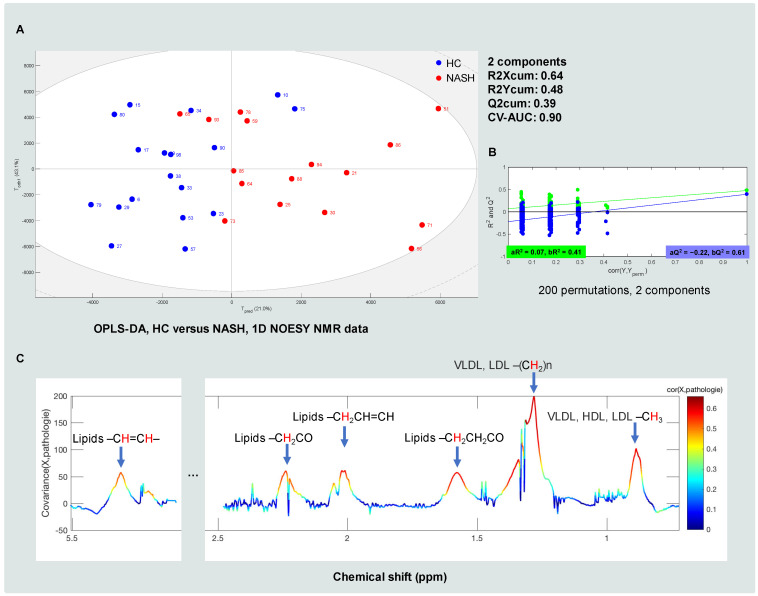
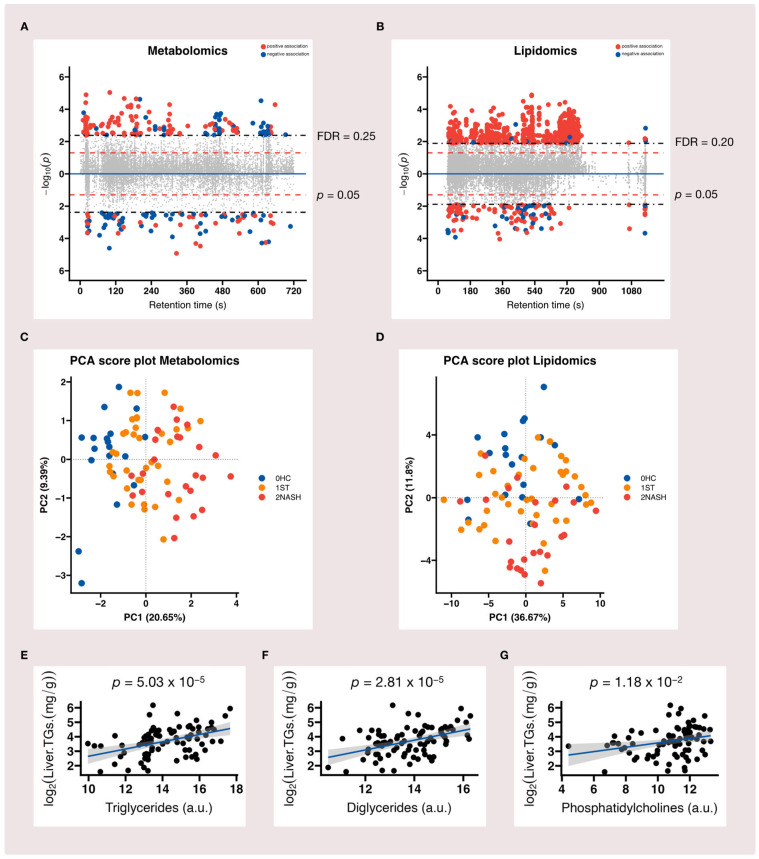
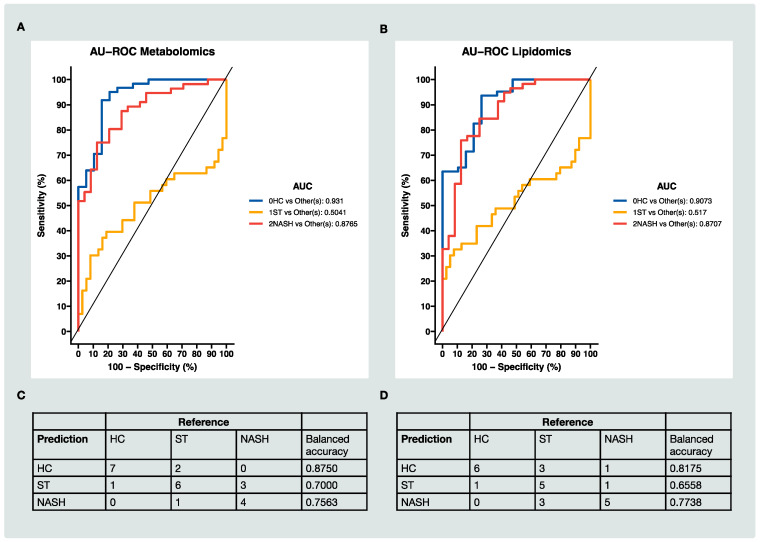
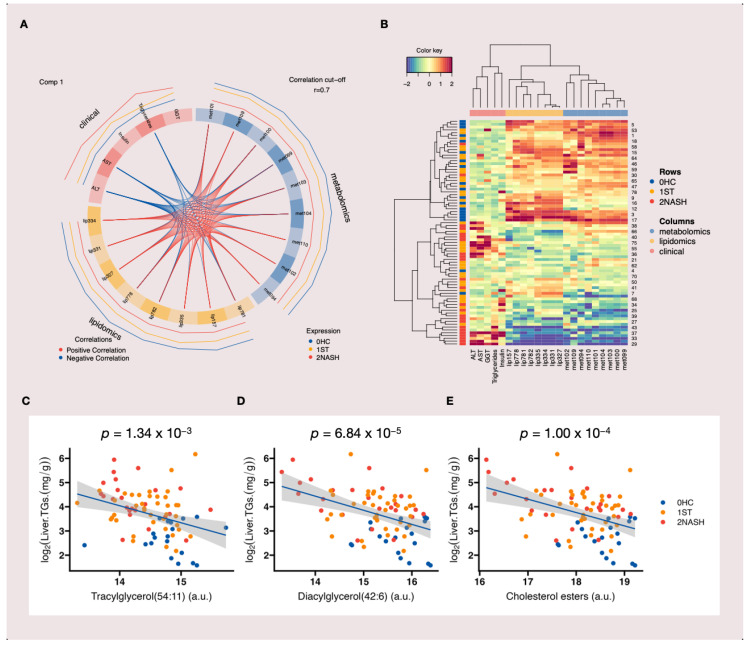
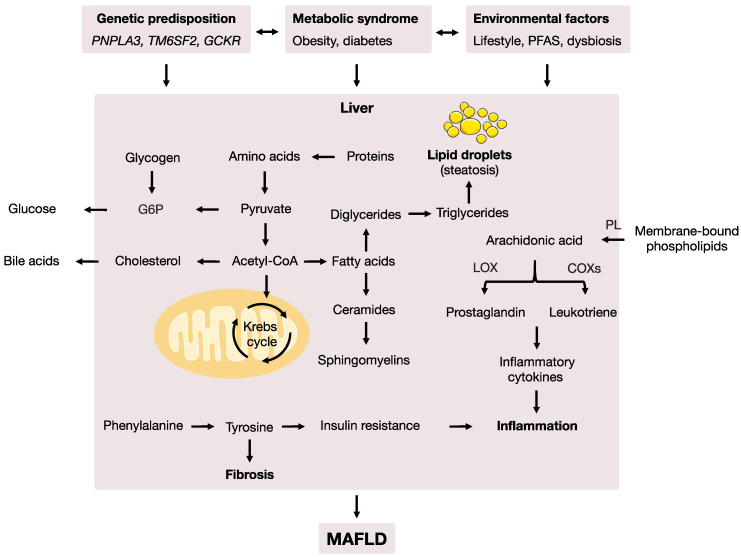
Metabolic dysfunction-associated fatty liver disease (MAFLD) is a complex disorder that is implicated in dysregulations in multiple biological pathways, orchestrated by interactions between genetic predisposition, metabolic syndromes and environmental factors. The limited knowledge of its pathogenesis is one of the bottlenecks in the development of prognostic and therapeutic options for MAFLD. Moreover, the extent to which metabolic pathways are altered due to ongoing hepatic steatosis, inflammation and fibrosis and subsequent liver damage remains unclear. To uncover potential MAFLD pathogenesis in humans, we employed an untargeted nuclear magnetic resonance (NMR) spectroscopy- and high-resolution mass spectrometry (HRMS)-based multiplatform approach combined with a computational multiblock omics framework to characterize the plasma metabolomes and lipidomes of obese patients without (n = 19) or with liver biopsy confirmed MAFLD (n = 63). Metabolite features associated with MAFLD were identified using a metabolome-wide association study pipeline that tested for the relationships between feature responses and MAFLD. A metabolic pathway enrichment analysis revealed 16 pathways associated with MAFLD and highlighted pathway changes, including amino acid metabolism, bile acid metabolism, carnitine shuttle, fatty acid metabolism, glycerophospholipid metabolism, arachidonic acid metabolism and steroid metabolism. These results suggested that there were alterations in energy metabolism, specifically amino acid and lipid metabolism, and pointed to the pathways being implicated in alerted liver function, mitochondrial dysfunctions and immune system disorders, which have previously been linked to MAFLD in human and animal studies. Together, this study revealed specific metabolic alterations associated with MAFLD and supported the idea that MAFLD is fundamentally a metabolism-related disorder, thereby providing new perspectives for diagnostic and therapeutic strategies.
Keywords: NMR; lipidomics; mass spectrometry; metabolic dysfunction-associated fatty liver disease; metabolomics; multiblock analysis.
Conflict of interest statement
The authors declare no potential conflict of interest.
Figures
Similar articles
-
[Risk analysis of serum chemical residues for metabolic associated fatty liver disease based on exposome-lipidome wide association study].Se Pu. 2024 Feb;42(2):164-175. doi: 10.3724/SP.J.1123.2023.12014. Se Pu. 2024. PMID: 38374597 Free PMC article. Chinese.
-
Analysis of Serum Bile Acid Profile Characteristics and Identification of New Biomarkers in Lean Metabolic Dysfunction-Associated Fatty Liver Disease Based on LC-MS/MS.Clin Med Insights Endocrinol Diabetes. 2024 Sep 22;17:11795514241282253. doi: 10.1177/11795514241282253. eCollection 2024. Clin Med Insights Endocrinol Diabetes. 2024. PMID: 39328906 Free PMC article.
-
Bacteroides uniformis-generated hexadecanedioic acid ameliorates metabolic-associated fatty liver disease.Gut Microbes. 2025 Dec;17(1):2508433. doi: 10.1080/19490976.2025.2508433. Epub 2025 May 25. Gut Microbes. 2025. PMID: 40413726 Free PMC article.
-
Metabolic Dysfunction-Associated Fatty Liver Disease (MAFLD) and Thyroid Function in Childhood Obesity: A Vicious Circle?Children (Basel). 2024 Feb 15;11(2):244. doi: 10.3390/children11020244. Children (Basel). 2024. PMID: 38397356 Free PMC article. Review.
-
New Insights into the Pathogenesis of Metabolic-Associated Fatty Liver Disease (MAFLD): Gut-Liver-Heart Crosstalk.Nutrients. 2023 Sep 14;15(18):3970. doi: 10.3390/nu15183970. Nutrients. 2023. PMID: 37764755 Free PMC article. Review.
Cited by
-
[Risk analysis of serum chemical residues for metabolic associated fatty liver disease based on exposome-lipidome wide association study].Se Pu. 2024 Feb;42(2):164-175. doi: 10.3724/SP.J.1123.2023.12014. Se Pu. 2024. PMID: 38374597 Free PMC article. Chinese.
-
Expanding the Molecular Disturbances of Lipoproteins in Cardiometabolic Diseases: Lessons from Lipidomics.Diagnostics (Basel). 2023 Feb 15;13(4):721. doi: 10.3390/diagnostics13040721. Diagnostics (Basel). 2023. PMID: 36832218 Free PMC article. Review.
-
Carnitine palmitoyltransferase-II inactivity promotes malignant progression of metabolic dysfunction-associated fatty liver disease via liver cancer stem cell activation.World J Gastroenterol. 2024 Dec 21;30(47):5055-5069. doi: 10.3748/wjg.v30.i47.5055. World J Gastroenterol. 2024. PMID: 39713165 Free PMC article.
References
-
- Kleiner D.E., Brunt E.M., Van Natta M., Behling C., Contos M.J., Cummings O.W., Ferrell L.D., Liu Y.-C., Torbenson M.S., Unalp-Arida A., et al. Design and Validation of a Histological Scoring System for Nonalcoholic Fatty Liver Disease. Hepatology. 2005;41:1313–1321. doi: 10.1002/hep.20701. - DOI - PubMed
-
- Anstee Q.M., Day C.P. 26—Epidemiology, Natural History, and Evaluation of Nonalcoholic Fatty Liver Disease. In: Sanyal A.J., Boyer T.D., Lindor K.D., Terrault N.A., editors. Zakim and Boyer’s Hepatology. 7th ed. Elsevier; Philadelphia, PA, USA: 2018. pp. 391–405.
-
- Eslam M., Newsome P.N., Sarin S.K., Anstee Q.M., Targher G., Romero-Gomez M., Zelber-Sagi S., Wai-Sun Wong V., Dufour J.-F., Schattenberg J.M., et al. A New Definition for Metabolic Dysfunction-Associated Fatty Liver Disease: An International Expert Consensus Statement. J. Hepatol. 2020;73:202–209. doi: 10.1016/j.jhep.2020.03.039. - DOI - PubMed
LinkOut - more resources
Full Text Sources
