

Dynamics of Gut Microbiota and Clinical Variables after Ketogenic and Mediterranean Diets in Drug-Naïve Patients with Type 2 Diabetes Mellitus and Obesity
- PMID: 36355175
- PMCID: PMC9693465
- DOI: 10.3390/metabo12111092
Dynamics of Gut Microbiota and Clinical Variables after Ketogenic and Mediterranean Diets in Drug-Naïve Patients with Type 2 Diabetes Mellitus and Obesity
Abstract
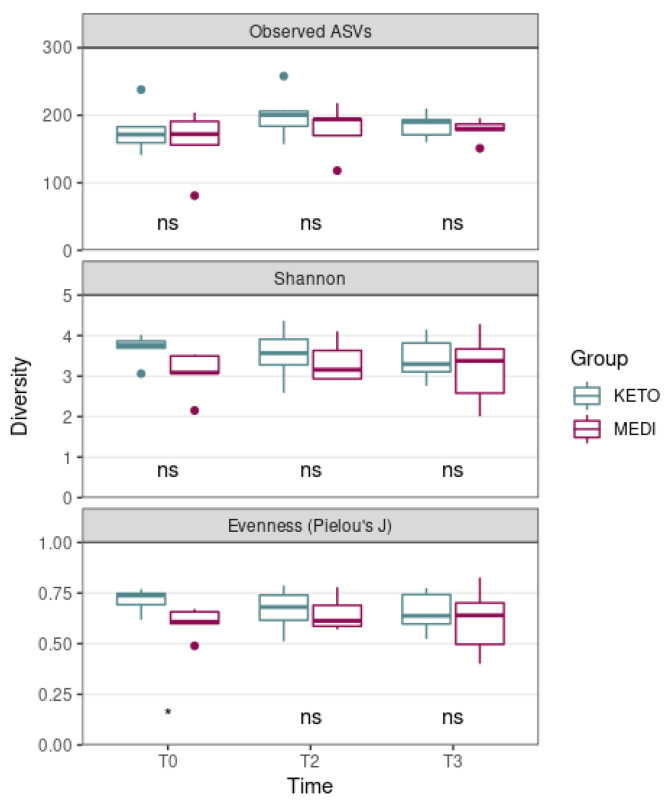
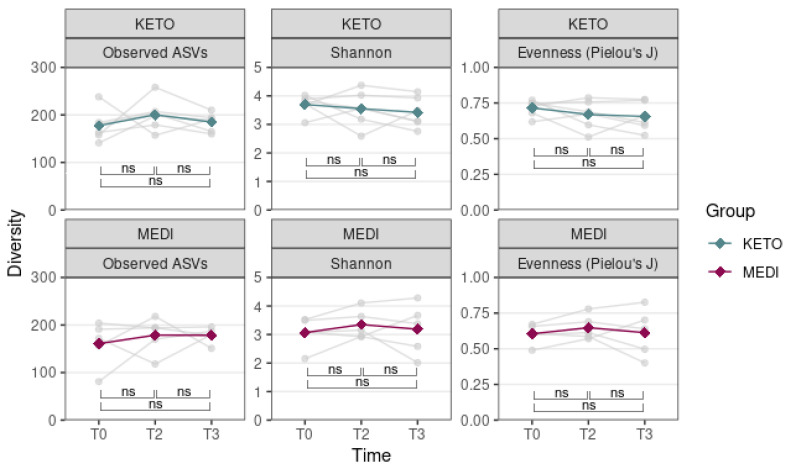
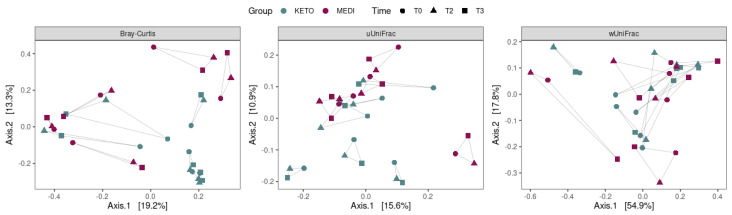
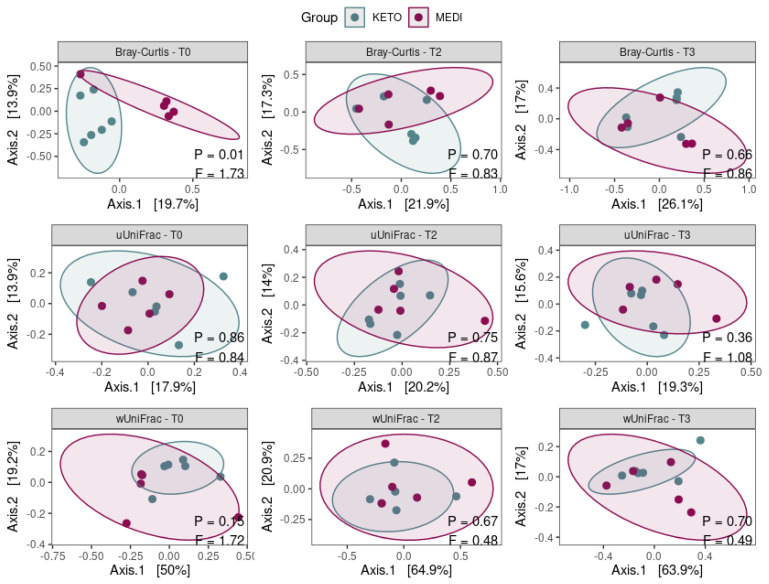
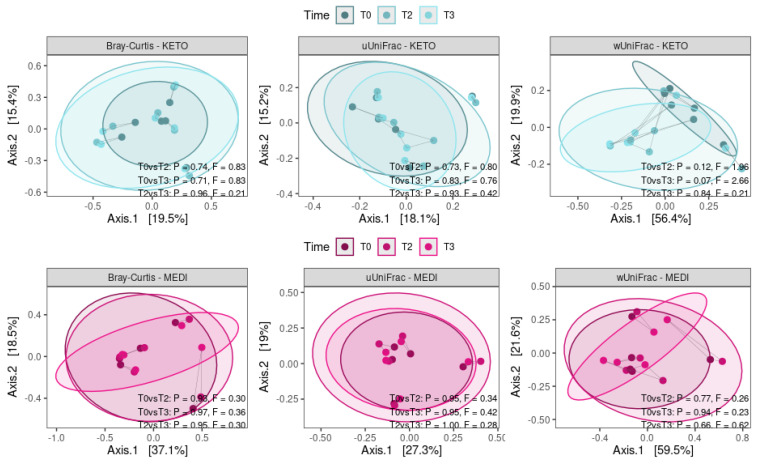
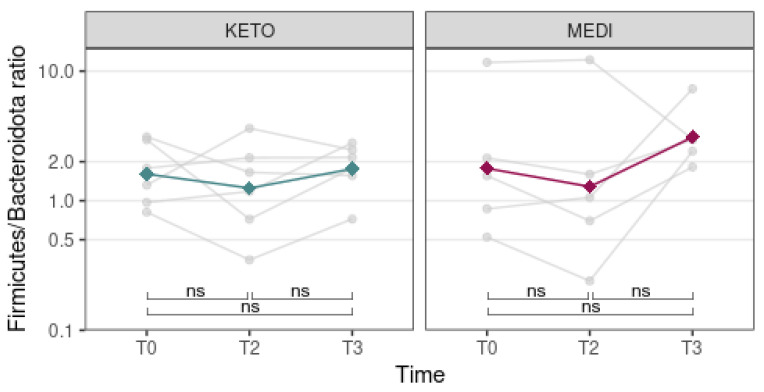
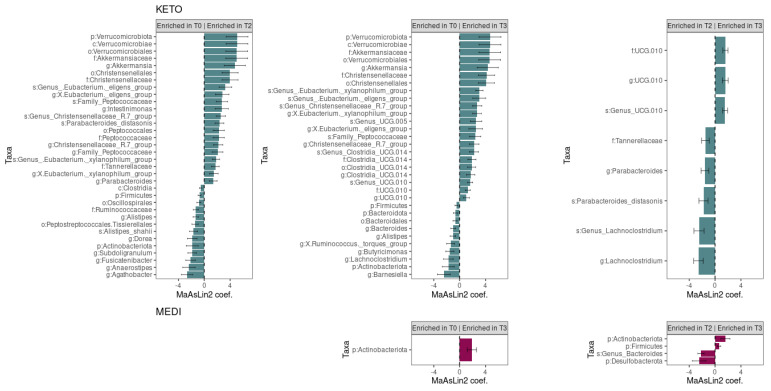
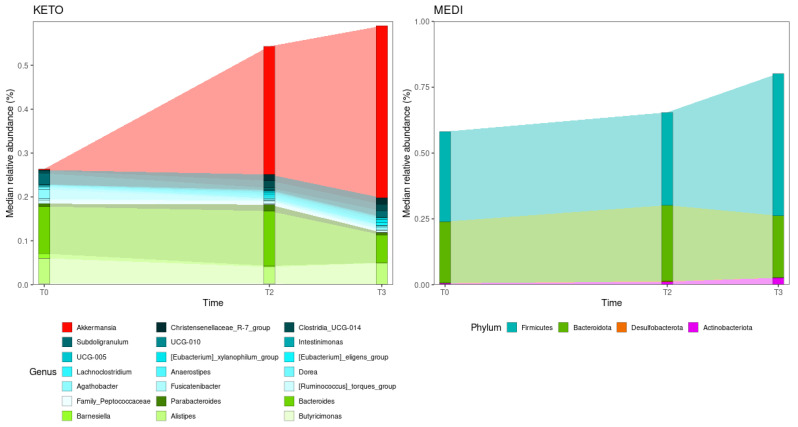
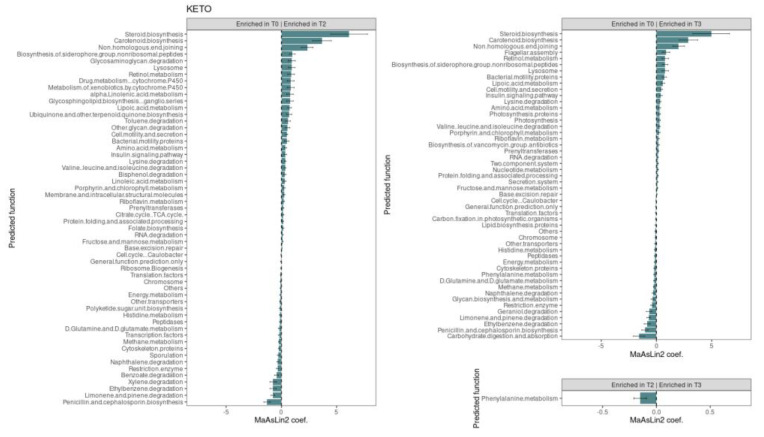
Type 2 diabetes mellitus (T2DM), the most common form of diabetes, is a progressive chronic metabolic disease that has increasingly spread worldwide, enhancing the mortality rate, particularly from cardiovascular diseases (CVD). Lifestyle improvement through diet and physical activity is, together with drug treatment, the cornerstone of T2DM management. The Mediterranean diet (MD), which favors a prevalence of unprocessed vegetable foods and a reduction in red meats and industrial foods, without excluding any food category, is usually recommended. Recently, scientific societies have promoted a very low-calorie ketogenic diet (VLCKD), a multiphasic protocol that limits carbohydrates and then gradually re-introduces them, with a favorable outcome on body weight and metabolic parameters. Indeed, gut microbiota (GM) modifications have been linked to overweight/obesity and metabolic alterations typical of T2DM. Diet is known to affect GM largely, but only a few studies have investigated the effects of VLCKD on GM, especially in T2DM. In this study, we have compared anthropometric, biochemical, lifestyle parameters, the quality of life, and the GM of eleven patients with recently diagnosed T2DM and overweight or obesity, randomly assigned to two groups of six and five patients who followed the VLCKD (KETO) or hypocaloric MD (MEDI) respectively; parameters were recorded at baseline (T0) and after two (T2) and three months (T3). The results showed that VLCKD had more significant beneficial effects than MD on anthropometric parameters, while biochemical improvements did not statistically differ. As for the GM, despite the lack of significant results regarding the alpha and beta diversity, and the Firmicutes/Bacteroidota ratio between the two groups, in the KETO group, a significant increase in beneficial microbial taxa such as Verrucomicrobiota phylum with its members Verrucomicrobiae, Verrucomicrobiales, Akkermansiaceae, and Akkermansia, Christensenellaceae family, Eubacterium spp., and a reduction in microbial taxa previously associated with obesity (Firmicutes and Actinobacteriota) or other diseases (Alistipes) was observed both at T2 and T3. With regards to the MEDI group, variations were limited to a significant increase in Actinobacteroidota phylum at T2 and T3 and Firmicutes phylum at T3. Moreover, a metagenomic alteration linked to some metabolic pathways was found exclusively in the KETO group. In conclusion, both dietary approaches allowed patients to improve their state of health, but VLCKD has shown better results on body composition as well as on GM profile.
Keywords: 16S rRNA; Mediterranean diet; body composition; glycometabolic status; gut microbiota; ketogenic diet; obesity; physical activity; quality of life; type 2 diabetes mellitus.
Conflict of interest statement
The authors declare no conflict of interest.
Figures
Similar articles
-
Impact of Ketogenic and Mediterranean Diets on Gut Microbiota Profile and Clinical Outcomes in Drug-Naïve Patients with Diabesity: A 12-Month Pilot Study.Metabolites. 2025 Jan 6;15(1):22. doi: 10.3390/metabo15010022. Metabolites. 2025. PMID: 39852366 Free PMC article.
-
The Antioxidant Potential of the Mediterranean Diet as a Predictor of Weight Loss after a Very Low-Calorie Ketogenic Diet (VLCKD) in Women with Overweight and Obesity.Antioxidants (Basel). 2022 Dec 22;12(1):18. doi: 10.3390/antiox12010018. Antioxidants (Basel). 2022. PMID: 36670880 Free PMC article.
-
Italian Ketogenic Mediterranean Diet in Overweight and Obese Patients with Prediabetes or Type 2 Diabetes.Nutrients. 2022 Oct 18;14(20):4361. doi: 10.3390/nu14204361. Nutrients. 2022. PMID: 36297044 Free PMC article.
-
Very low calorie ketogenic diets in overweight and obesity treatment: Effects on anthropometric parameters, body composition, satiety, lipid profile and microbiota.Obes Res Clin Pract. 2020 Nov-Dec;14(6):491-503. doi: 10.1016/j.orcp.2020.08.009. Epub 2020 Sep 9. Obes Res Clin Pract. 2020. PMID: 32919928 Review.
-
The gut microbiome as possible mediator of the beneficial effects of very low calorie ketogenic diet on type 2 diabetes and obesity: a narrative review.Eat Weight Disord. 2022 Oct;27(7):2339-2346. doi: 10.1007/s40519-022-01434-2. Epub 2022 Jul 1. Eat Weight Disord. 2022. PMID: 35773554 Review.
Cited by
-
Modulating the Human Gut Microbiota through Hypocaloric Balanced Diets: An Effective Approach for Managing Obesity.Nutrients. 2023 Jul 11;15(14):3101. doi: 10.3390/nu15143101. Nutrients. 2023. PMID: 37513521 Free PMC article.
-
Microbiome Dynamics: A Paradigm Shift in Combatting Infectious Diseases.J Pers Med. 2024 Feb 18;14(2):217. doi: 10.3390/jpm14020217. J Pers Med. 2024. PMID: 38392650 Free PMC article. Review.
-
Obesity-associated inflammation countered by a Mediterranean diet: the role of gut-derived metabolites.Front Nutr. 2024 Jun 24;11:1392666. doi: 10.3389/fnut.2024.1392666. eCollection 2024. Front Nutr. 2024. PMID: 38978699 Free PMC article. Review.
-
Comparative analysis of gut microbiota in free range and house fed yaks from Linzhou County.Sci Rep. 2025 Apr 24;15(1):14317. doi: 10.1038/s41598-025-95357-4. Sci Rep. 2025. PMID: 40274860 Free PMC article.
-
Penthorum chinense Pursh improves type 2 diabetes mellitus via modulating gut microbiota in db/db mice.BMC Complement Med Ther. 2023 Sep 9;23(1):314. doi: 10.1186/s12906-023-04136-z. BMC Complement Med Ther. 2023. PMID: 37689643 Free PMC article.
References
-
- World Health Organization. International Diabetes Federation . Definition and Diagnosis of Diabetes Mellitus and Intermediate Hyperglycemia: Report of a WHO/IDF Consultation. World Health Organization; Geneva, Switzerland: 2006. - DOI
-
- Dayeh T., Volkov P., Salö S., Hall E., Nilsson E., Olsson A.H., Kirkpatrick C., Wollheim C.B., Eliasson L., Rönn T., et al. Genome-Wide DNA Methylation Analysis of Human Pancreatic Islets from Type 2 Diabetic and Non-Diabetic Donors Identifies Candidate Genes That Influence Insulin Secretion. PLoS Genet. 2014;10:e1004160. doi: 10.1371/journal.pgen.1004160. - DOI - PMC - PubMed
Grants and funding
LinkOut - more resources
Full Text Sources
Research Materials
Miscellaneous
