. 2023 Feb 6;13(2):496-515.
doi: 10.1158/2159-8290.CD-21-0218.

Dysregulated Lipid Synthesis by Oncogenic IDH1 Mutation Is a Targetable Synthetic Lethal Vulnerability

Affiliations

Dysregulated Lipid Synthesis by Oncogenic IDH1 Mutation Is a Targetable Synthetic Lethal Vulnerability

Daniel Thomas et al. Cancer Discov. .

Abstract

Isocitrate dehydrogenase 1 and 2 (IDH) are mutated in multiple cancers and drive production of (R)-2-hydroxyglutarate (2HG). We identified a lipid synthesis enzyme [acetyl CoA carboxylase 1 (ACC1)] as a synthetic lethal target in mutant IDH1 (mIDH1), but not mIDH2, cancers. Here, we analyzed the metabolome of primary acute myeloid leukemia (AML) blasts and identified an mIDH1-specific reduction in fatty acids. mIDH1 also induced a switch to b-oxidation indicating reprogramming of metabolism toward a reliance on fatty acids. Compared with mIDH2, mIDH1 AML displayed depletion of NADPH with defective reductive carboxylation that was not rescued by the mIDH1-specific inhibitor ivosidenib. In xenograft models, a lipid-free diet markedly slowed the growth of mIDH1 AML, but not healthy CD34+ hematopoietic stem/progenitor cells or mIDH2 AML. Genetic and pharmacologic targeting of ACC1 resulted in the growth inhibition of mIDH1 cancers not reversible by ivosidenib. Critically, the pharmacologic targeting of ACC1 improved the sensitivity of mIDH1 AML to venetoclax.

Significance: Oncogenic mutations in both IDH1 and IDH2 produce 2-hydroxyglutarate and are generally considered equivalent in terms of pathogenesis and targeting. Using comprehensive metabolomic analysis, we demonstrate unexpected metabolic differences in fatty acid metabolism between mutant IDH1 and IDH2 in patient samples with targetable metabolic interventions. See related commentary by Robinson and Levine, p. 266. This article is highlighted in the In This Issue feature, p. 247.


Figures

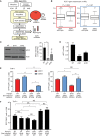
Figure 1. MiSL predicts ACC1 as a metabolic dependency for mutant IDH1 but not mutant IDH2. A, Schematic showing MiSL algorithm and prediction of ACC1 (ACACA) as a potential synthetic lethal partner of mutant IDH1 across pan-cancer. B, ACC1 mRNA expression comparing mutated IDH1 and IDH2 AML vs. wild-type in The Cancer Genome Atlas based on RNA sequencing data. Differences in expression were compared with Student t test with P values as shown. C, Validation of ACC1-specific hairpins on protein expression by Western blot (left) with quantification (right). Experiment was performed 3 independent times. *, P < 0.05. D, ACC1-specific hairpins with mRNA quantified by TaqMan qPCR compared with nontargeting shRNA. Experiment was performed in triplicate 2 independent times; ***, P < 0.001; **, P < 0.01; Student t test. E, Knockdown of ACC1 using shRNA#1 (left) or shRNA#2 (right) in THP-1 cells expressing IDH1 R132H (mIDH1) or IDH2 R140Q (mIDH2) under doxycycline-induced promoter in lipid-depleted media. The number of viable RFP+GFP+ double-positive cells at day 10 was enumerated relative to fluorescent counting beads. RFP tracks integrated ACC1-specific shRNA hairpin; eGFP tracks mutant protein after doxycycline induction. This experiment was performed 3 times with a representative graph shown. Bars represent standard deviation. ***, P < 0.001; **, P < 0.01; *, P < 0.05, Student t test performed on 4 sorted biological replicates for each transduction group. F, Similar experiment using wild-type IDH cells. ACC1 was knocked down using shRNA#1 or shRNA#2 in THP-1 cells expressing IDH1 or IDH2 wild-type proteins under doxycycline-induced promoter in lipid-depleted media. As in D, the number of viable RFP+GFP+ double-positive cells at day 10 was enumerated relative to fluorescent counting beads. RFP tracks integrated ACC1-specific shRNA hairpin; eGFP tracks wild-type protein after doxycycline induction. This experiment was performed 3 times with a representative shown. Bars represent standard deviation. NS = nonsignificant; NT = nontargeting shRNA.
Figure 1.
MiSL predicts ACC1 as a metabolic dependency for mutant IDH1, but not mutant IDH2. A, Schematic showing MiSL algorithm and prediction of ACC1 (ACACA) as a potential synthetic lethal partner of mutant IDH1 across pan-cancer. CNA, copy-number alteration. B,ACC1 mRNA expression comparing mutated IDH1 and IDH2 AML vs. wild-type in The Cancer Genome Atlas based on RNA sequencing data. Differences in expression were compared with Student t test with P values as shown. C, Validation of ACC1-specific hairpins on protein expression by Western blot (left) with quantification (right). Experiment was performed 3 independent times. *, P < 0.05. RFU, relative fluorescence unit. D, ACC1-specific hairpins with mRNA quantified by TaqMan qPCR compared with nontargeting shRNA. Experiment was performed in triplicate 2 independent times; ***, P < 0.001; **, P < 0.01; Student t test. E, Knockdown of ACC1 using shRNA#1 (left) or shRNA#2 (right) in THP-1 cells expressing IDH1 R132H (mIDH1) or IDH2 R140Q (mIDH2) under dox-induced promoter in lipid-depleted media. The number of viable RFP+GFP+ double-positive cells at day 10 was enumerated relative to fluorescent counting beads. RFP tracks integrated ACC1-specific shRNA hairpin; eGFP tracks mutant protein after dox induction. This experiment was performed 3 times with a representative graph shown. Bars represent standard deviation. ***, P < 0.001; **, P < 0.01; *, P < 0.05; Student t test performed on 4 sorted biological replicates for each transduction group. F, Similar experiment using wild-type IDH cells. ACC1 was knocked down using shRNA#1 or shRNA#2 in THP-1 cells expressing IDH1 or IDH2 wild-type proteins under dox-induced promoter in lipid-depleted media. As in D, the number of viable RFP+GFP+ double-positive cells at day 10 was enumerated relative to fluorescent counting beads. RFP tracks integrated ACC1-specific shRNA hairpin; eGFP tracks wild-type protein after doxycycline induction. This experiment was performed 3 times with a representative shown. Bars represent standard deviation. NS, nonsignificant; NT, nontargeting shRNA.
Figure 2. IDH1-mutant AML associated with decreased single chain fatty acid metabolites. A, Principal component analysis of extracted nonpolar metabolites identified by mass spectrometry in negative ion mode from THP-1 cells cultured in low serum media following induction of mIDH1 R132H, mIDH2 R140Q, wild-type IDH1, or wild-type IDH2. B, Heat map showing differentially abundant nonpolar lipid species globally decreased in IDH1 R132H THP-1 cells (+ dox) compared with IDH2 R140Q (+ dox) vs. no-dox controls. C, Schematic showing metabolomics protocol for extracting nonpolar lipid species using organic solvent and derivatization of polar metabolites with O-benzylhydroxylamine and dansyl-tags from primary cell AML extracts. Putative metabolite identifications based on mass/charge ratio and retention time were determined from the Human Metabolome Database, Lipid Annotator software, and a validated in-house lipidomics fragmentation library. D, Heat map showing clustering of primary AML samples based on differentially abundant metabolites (all metabolites, both polar and nonpolar). mIDH1 samples are shown in red. E, Volcano plot highlighting significant differentially abundant metabolites in healthy IDH1 wild-type CD34+ progenitors vs. mIDH1 AML. Red dashed line indicates a nonadjusted P value threshold of 0.05. F, Volcano plot highlighting significant differentially abundant metabolites in 6 × mIDH1 vs. 5 × mIDH2 AML samples. Dashed line indicates a nonadjusted P value threshold of 0.05. G, Representative examples of distinct lipid metabolites with decreased abundance in IDH1-mutant vs. IDH2-mutant AML and wild-type AML, x-axis shows metabolite abundance. LPE, lysophosphatidylethanolamine; MG, monoacylglycerolipids; Bars represent standard error of independent samples. All P values represent comparison with WT.
Figure 2.
IDH1-mutant AML associated with decreased single-chain fatty acid metabolites. A, Principal component analysis of extracted nonpolar metabolites identified by mass spectrometry in negative ion mode from THP-1 cells cultured in low serum media following induction of mIDH1 R132H, mIDH2 R140Q, wild-type IDH1, or wild-type IDH2. B, Heat map showing differentially abundant nonpolar lipid species globally decreased in IDH1 R132H THP-1 cells (+dox) compared with IDH2 R140Q (+dox) vs. no-dox controls. C, Schematic showing metabolomics protocol for extracting nonpolar lipid species using organic solvent and derivatization of polar metabolites with O-benzylhydroxylamine and dansyl-tags from primary cell AML extracts. Putative metabolite identifications based on mass/charge ratio and retention time were determined from the Human Metabolome Database, Lipid Annotator software, and a validated in-house lipidomics fragmentation library. HMDB, Human Metabolome Database. D, Heat map showing clustering of primary AML samples based on differentially abundant metabolites (all metabolites, both polar and nonpolar). mIDH1 samples are shown in red. CB, cord blood. E, Volcano plot highlighting significant differentially abundant metabolites in healthy IDH1 wild-type CD34+ progenitors vs. mIDH1 AML. Red dashed line indicates a nonadjusted P value threshold of 0.05. F, Volcano plot highlighting significant differentially abundant metabolites in 6 × mIDH1 vs. 5 × mIDH2 AML samples. Dashed line indicates a nonadjusted P value threshold of 0.05. G, Representative examples of distinct lipid metabolites with decreased abundance in IDH1-mutant vs. IDH2-mutant AML and wild-type AML; x-axis shows metabolite abundance. Bars represent standard error of independent samples. All P values represent comparison with wild-type. LPE, lysophosphatidylethanolamine; MG, monoacylglycerolipids; NS, nonsignificant; WT, wild-type.
Figure 3. IDH1 mutation is linked to defective reductive carboxylation, increased fatty acid consumption, and decreased NADPH. A, Schematic and graph of flux studies showing the percentage of labeled M2 glycerol-3-phosphate derived from 13C[1,2] labeled glucose (2 of 6 carbons as heavy isotope) across THP-1 cells induced to express mIDH1 vs. IDH1 wild-type compared with mIDH2 vs. IDH2 wild-type. Glucose was added to media in normoxia over 13 hours. Schematic indicates M2 isotopolog of glycerol-3-phosphate de novo synthesis directly from glycolysis utilizing labeled glucose rather than the oxidative pentose phosphate pathway (M1 isotopolog). A two-tailed unpaired Student t test was used to compare differences between groups. This experiment was performed with 6 cell pellets for each sample blinded and randomized on each LC-MS run. B, Decreased reductive carboxylation of mIDH1 compared with IDH1 wild-type and mIDH2 expressed in THP-1 cells measured by the percentage of M5 citrate isotopolog obtained from U-13C5 glutamine labeling in 2% hypoxia over 16 hours as shown in the schematic. The last bar shows mIDH1 cells cultured in the presence of 10 μmol/L ivosidenib added prior to adding a label. This experiment was performed with 6 cell pellets for each sample blinded and randomized on each LC-MS run; ***, P < 0.001; **, P < 0.01, Student t test. C, Column graph showing fold change increase in acylcarnitine metabolites after induction of mIDH1 (+dox) vs. wild-type (−dox) in comparison with mIDH2 (+dox) vs. IDH2 wild-type (−dox) in THP-1 cells as measured by LC-MS. Student t test is used to compare groups. D, Column graph showing mean fatty acid β-oxidation as measured by the etomoxir-sensitive component of oxygen consumption in pmole/min/105 cells in mIDH1 vs. IDH1 wild-type, mIDH2 and IDH2 wild-type in THP-1 cells measured on Seahorse analyzer, 3 independent experiments. E, Column graph showing the percentage of beta-oxidation of total oxygen consumption (etomoxir-sensitive component) in mIDH1 and mIDH2 before and after the addition of the ACC1 inhibitor 100 nmol/L ND-646. A representative experiment is shown. Statistics represent paired t test with n = 4 replicates. F, Column graph showing % etomoxir-sensitive component in mIDH1 before and after the addition of 10 μmol/L ivosidenib. P = nonsignificant, Student t test, 4 replicates. G, Western blot showing phospho-AMPK on threonine 172 in THP-1 cells induced with mIDH1, mIDH2 and wild-type counterparts in lipid-replete conditions. Comparison with total AMPK alpha isoform and actin is shown in panels below. H, NADPH levels measured in identical 2 × 10⁶ viable cell pellets of mIDH1, mIDH2, or wild-type primary AML blasts vs. normal CD34+ cells grown in culture for 48 hours in normoxia. Symbols indicate individual sample values. Student t test is used to compare groups. I, Schematic summarizing mIDH1-induced mechanisms impacting lipid metabolism. Pathways involved directly in phospholipid synthesis that are perturbed by mIDH1 are shown in red. Thin arrows indicate reduced flux, and thick arrows indicate preserved or increased flux. Black arrows indicate pathways not measurably affected by mIDH1. Mechanistic causes for aberrant lipid metabolism identified in our study include: (i) reduced carbon flux arising from defective reductive carboxylation by mutant IDH1 hetero/homodimers exacerbated in relative marrow hypoxia and mitochondrial stress, (ii) cumulative NADP(H) decrease by neomorphic reverse αKG to 2HG reaction, (iii) ongoing depletion of NADPH by residual reductive carboxylation of glutamine, (iv) insufficient NADPH replenishment by impaired forward reaction akin to TCA cycle, (v) increased fatty acid β-oxidation with a concomitant increase in acylcarnitines that is sensitive to ACC1 inhibition but not ivosidenib, and (vi) decreased AMPK phosphorylation, indicating an AMPK-independent mechanism for enhanced oxidative phosphorylation of fatty acids. In contrast, the flux of glucose to produce glycerol-3-phosphate, the building block for the glycerol component of glycerolipids, is not impaired and is rather upregulated in mIDH1 compared with mIDH2, shown in black. This would suggest de novo synthesis of glycerol from glucose is not the major cause of defective lipid species in mIDH1 AML. Similarly, static levels of citric acid cycle metabolites are decreased to similar in both mIDH1 and mIDH2 AML, as shown in Supplementary figures. Blockade of 2HG production by ivosidenib is not sufficient for restoring defective reductive carboxylation nor abrogating β-oxidation.
Figure 3.
IDH1 mutation is linked to defective reductive carboxylation, increased fatty acid consumption, and decreased NADPH. A, Schematic and graph of flux studies showing the percentage of labeled M2 glycerol-3-phosphate derived from 13C[1,2] labeled glucose (2 of 6 carbons as heavy isotope) across THP-1 cells induced to express mIDH1 vs. IDH1 wild-type compared with mIDH2 vs. IDH2 wild-type. Glucose was added to media in normoxia over 13 hours. Schematic indicates M2 isotopolog of glycerol-3-phosphate de novo synthesis directly from glycolysis utilizing labeled glucose rather than the oxidative pentose phosphate pathway (M1 isotopolog). A two-tailed unpaired Student t test was used to compare differences between groups. This experiment was performed with 6 cell pellets for each sample blinded and randomized on each LC-MS run. DHAP, dihydoxyacetone phosphate; G-6-P, glucose-6-phosphate. B, Decreased reductive carboxylation of mIDH1 compared with IDH1 wild-type and mIDH2 expressed in THP-1 cells measured by the percentage of M5 citrate isotopolog obtained from U-13C5 glutamine labeling in 2% hypoxia over 16 hours, as shown in the schematic. The last bar shows mIDH1 cells cultured in the presence of 10 μmol/L ivosidenib added prior to adding a label. This experiment was performed with 6 cell pellets for each sample blinded and randomized on each LC-MS run. ****, P < 0.0001; Student t test. C, Column graph showing FC increase in acylcarnitine metabolites after induction of mIDH1 (+dox) vs. wild-type (−dox) in comparison with mIDH2 (+dox) vs. IDH2 wild-type (−dox) in THP-1 cells as measured by LC-MS. Student t test is used to compare groups. D, Column graph showing mean fatty acid β-oxidation as measured by the etomoxir (ETO)-sensitive component of oxygen consumption in pmole/min/105 cells in mIDH1 vs. IDH1 wild-type, mIDH2 and IDH2 wild-type in THP-1 cells measured on Seahorse analyzer (3 independent experiments). E, Column graph showing the percentage of b-oxidation of total oxygen consumption (etomoxir-sensitive component) in mIDH1 and mIDH2 before and after the addition of the ACC1 inhibitor 100 nmol/L ND-646. A representative experiment is shown. Statistics represent paired t test with n = 4 replicates. F, Column graph showing percentage of etomoxir-sensitive component in mIDH1 before and after the addition of 10 μmol/L ivosidenib. P = nonsignificant, Student t test, 4 replicates. G, Western blot showing phospho-AMPK (pAMPK) on threonine 172 in THP-1 cells induced with mIDH1, mIDH2, and wild-type counterparts in lipid-replete conditions. Comparison with total AMPK α isoform and Actin is shown in panels below. H, NADPH levels measured in identical 2 × 10⁶ viable cell pellets of mIDH1, mIDH2, or wild-type primary AML blasts vs. normal CD34+ cells grown in culture for 48 hours in normoxia. Symbols indicate individual sample values. Student t test is used to compare groups. **, P < 0.01.I, Schematic summarizing mIDH1-induced mechanisms impacting lipid metabolism. Pathways involved directly in phospholipid synthesis that are perturbed by mIDH1 are shown in red. Thin arrows indicate reduced flux, and thick arrows indicate preserved or increased flux. Black arrows indicate pathways not measurably affected by mIDH1. Mechanistic causes for aberrant lipid metabolism identified in our study include (i) reduced carbon flux arising from defective reductive carboxylation by mutant IDH1 hetero/homodimers exacerbated in relative marrow hypoxia and mitochondrial stress; (ii) cumulative NADP(H) decrease by neomorphic reverse αKG to 2HG reaction; (iii) ongoing depletion of NADPH by residual reductive carboxylation of glutamine; (iv) insufficient NADPH replenishment by impaired forward reaction akin to TCA cycle; (v) increased fatty acid β-oxidation with a concomitant increase in acylcarnitines that is sensitive to ACC1 inhibition, but not ivosidenib; and (vi) decreased AMPK phosphorylation, indicating an AMPK-independent mechanism for enhanced oxidative phosphorylation of fatty acids. In contrast, the flux of glucose to produce glycerol-3-phosphate, the building block for the glycerol component of glycerolipids, is not impaired but rather is upregulated in mIDH1 compared with mIDH2, shown in black. This would suggest de novo synthesis of glycerol from glucose is not the major cause of defective lipid species in mIDH1 AML. Similarly, static levels of citric acid cycle metabolites are decreased to similar levels in both mIDH1 and mIDH2 AML, as shown in Supplementary figures. Blockade of 2HG production by ivosidenib is not sufficient for restoring defective reductive carboxylation or abrogating β-oxidation. NS, nonsignificant; WT, wild-type.
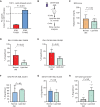
Figure 4. Lipid-free diet causes decreased growth of mIDH1 AML. A, Growth of mIDH1 vs. mIDH2 THP-1 cells in lipid-stripped serum over 10 days shown as a relative fold change compared with IDH1 wild-type cells. Growth was measured using Presto-Blue cell viability. Bars represent standard deviation of four replicates in a representative experiment performed 3 times. B, Schematic showing change in diet to sucrose-rich lipid-free diet at 10 weeks after engraftment of human AML. C, Triglyceride levels measured in NSG mice after 6 weeks of lipid-free dietary supplementation. D–H, Human CD33+ engraftment of mIDH1 AML (D, E), mIDH2 AML (F, G), and normal CD34+ HSPCs (H) after 6 weeks in mice treated with lipid-free compared with normal rodent diet. Bars represent standard error. Mann–Whitney U test was used to compare engraftments with P values as shown.
Figure 4.
Lipid-free diet causes decreased growth of mIDH1 AML. A, Growth of mIDH1 vs. mIDH2 THP-1 cells in lipid-stripped serum over 10 days shown as a relative FC compared with IDH1 wild-type cells. Growth was measured using Presto-Blue cell viability. Bars represent standard deviation of 4 replicates in a representative experiment performed 3 times. B, Schematic showing change in diet to sucrose-rich lipid-free diet at 10 weeks after engraftment of human AML. C, Triglyceride levels measured in NSG mice after 6 weeks of lipid-free dietary supplementation. D–H, Human CD33+ engraftment of mIDH1 AML (D, E), mIDH2 AML (F, G), and normal CD34+ hematopoietic stem/progenitor cells (H) after 6 weeks in mice treated with lipid-free compared with normal rodent diet. Bars represent standard error. Mann–Whitney U test was used to compare engraftments with P values as shown. NS, nonsignificant.
Figure 5. ACC1 is a potential target in IDH1-mutant solid tumors. A, Growth of HT-1,080 tumors over 21 days after knockdown of ACC1 measured by intravital imaging of shRNA transduced luciferase+ cells. B, In vivo imaging of tumors from the same experiment. C, Colony assays quantified by crystal violet showing decreased colonies in mIDH1 when ACC1 knockdown compared with wild-type in lipid-replete conditions. D, Column graphs showing mean number of colonies after seeding 2,500 cells per well; bars represent standard error of the mean from 2 independent experiments. E, In vivo growth of IDH1 wild-type HT-1080 cells after CRISPR-Cas9 correction. Plots show median tumor growth after 25 days. P = NS, Mann–Whitney U. F, Ki-67 IHC stain of explanted HT-1080 (5 tumors × 10 fields of view) after ACC1 knockdown compared with control with Student t test. Right, quantification of the Ki-67 proliferation index in tumors with ACC1 knockdown vs. control. G, Summary bar graph of 5 tumors × 10 fields of view showing increased apoptosis in ACC1 knockdown explants as measured by IHC staining of cleaved caspase-3 in explanted tumors. H, Kaplan–Meier log-rank survival curve for NSG mice transplanted with HT-1080 cells comparing ACC1 knockdown (pink) to nontargeting control (black) ± ivosidenib treatment 25 mg/kg/day (gray, purple) or vehicle given by oral gavage for 50 days. Mice eventually succumbed by 72 days in all treatment groups due to increased tumor growth requiring euthanasia. P values represent log-rank Mantel–Cox test between groups as indicated. I, Bar graph summarizing total flux (photons per second) based on intravital imaging at day 21 for the same experiment, Student t test with indicated P values assessed statistical significance. J, Kaplan–Meier log-rank survival curve for NSG mice transplanted with HT-1080 cells and fed lipid-free vs. normal (lipid-replete) rodent diet. As in the previous experiment, mice eventually succumbed by day 70 in all treatment groups due to increased tumor growth. P values represent log-rank Mantel–Cox test between groups as indicated. K, Bar graph summarizing tumor size at 21 days after engraftment as measured by calipers.
Figure 5.
ACC1 is a potential target in IDH1-mutant solid tumors. A, Growth of HT-1080 tumors over 21 days after knockdown of ACC1 measured by intravital imaging of shRNA-transduced luciferase+ cells. B,In vivo imaging of tumors from the same experiment. C, Colony assays quantified by crystal violet showing decreased colonies in mIDH1 with ACC1 knockdown compared with wild-type in lipid-replete conditions. D, Column graphs showing mean number of colonies after seeding 2,500 cells per well; bars represent standard error of the mean from 2 independent experiments. E,In vivo growth of IDH1 wild-type HT-1080 cells after CRISPR–Cas9 correction. Plots show median tumor growth after 25 days. P = nonsignificant; Mann–Whitney U test. F, Ki-67 IHC stain of explanted HT-1080 (5 tumors × 10 fields of view) after ACC1 knockdown compared with control with Student t test. Right, quantification of the Ki-67 proliferation index in tumors with ACC1 knockdown vs. control. G, Summary bar graph of 5 tumors × 10 fields of view showing increased apoptosis in ACC1 knockdown explants as measured by IHC staining of cleaved caspase-3 in explanted tumors. H, Kaplan–Meier log-rank survival curve for NSG mice transplanted with HT-1080 cells comparing ACC1 knockdown (pink) to nontargeting control (black) ± ivosidenib (ivo) treatment 25 mg/kg/day (gray, purple) or vehicle given by oral gavage for 50 days. Mice eventually succumbed by 72 days in all treatment groups due to increased tumor growth requiring euthanasia. P values represent log-rank Mantel–Cox test between groups as indicated. I, Bar graph summarizing total flux (photons per second) based on intravital imaging at day 21 for the same experiment. Student t test with indicated P values assessed statistical significance. J, Kaplan–Meier log-rank survival curve for NSG mice transplanted with HT-1080 cells and fed lipid-free vs. normal (lipid-replete) rodent diet. As in the previous experiment, mice eventually succumbed by day 70 in all treatment groups due to increased tumor growth. P values represent log-rank Mantel–Cox test between groups as indicated. kd, knockdown. K, Bar graph summarizing tumor size at 21 days after engraftment as measured by calipers. NS, nonsignificant; NT, nontargeting; WT, wild-type.
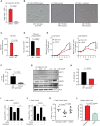
Figure 6. ACC1 selective inhibitors have activity in IDH1-mutated cancers. A, Viability of HT-1080 mIDH1 R132C cells after exposure to 4 μmol/L TOFA for 72 hours measured by DAPI-negative cell population. B, Representative images of wild-type IDH1 reversion HT-1080 cells cultured at low density in 4% lipid-depleted serum or IDH1 R132C parental cells or IDH1 R132C treated with 10 μmol/L ivosidenib. Note cells with IDH1 R132C mutation form ultra-thin adherent elongated spindle-like cells. This morphology changes were not reversed by coculture with ivosidenib. C, Measurement of 2HG in the supernatant of parental mIHD1 HT-1080 cells but undetectable in wild-type IDH1 reversion HT-1080 cells (clone #65 is shown as representative clone) after 72 hours. D, Total abundance of lysophospholipids (LPC + LPE) measured by LC-MS in mIDH1 vs. WT HT-1080 cultured in lipid-depleted media. E, Growth curves of mIDH1 vs. wild-type revertant HT-1080 in lipid-replete (left) vs. lipid-depleted (right) serum over 7 days. F, Fold change decrease in the number of live IDH1 R132C HT-1080 cells compared with IDH1 reversion wild-type HT-1080 cells after 96 hours exposure to ACC1 inhibitor TOFA compared with DMSO vehicle. Graph shows mean of 3 independent experiments. G, Western blot showing increased phosphorylated ACC1 Serine 79 after treatment of HT-1080 wild-type cells with increasing concentration of 5-aminoimidazole-4-carboxamide riboside (AICAR). H, Fold change decrease of in the number of live IDH1 R132C HT-1080 cells after 96 hours exposure AICAR vs. to H2O vehicle in comparison with IDH1 reversion wild-type HT-1080 cells under same conditions. Graph is a summary of 3-independent experiments. I–J, Primary mIDH1 AML cells isolated by flow cytometry from a patient at relapse (I) and a de novo patient (J) are sensitive to 10 μmol/L TOFA over 72 hours but cytotoxicity is not reversed by 10 μmol/L ivosidenib. K, Summary of TOFA IC50 at 72 hours after in vitro treatment of mIDH1, mIDH2, and IDH wild-type primary AML blasts cultured in low serum media. P value reflects nonparametric two-tailed comparison between groups; bars represent median IC50 in μmol/L. L, Engraftment of mIDH1 AML at baseline and after 30 days of treatment with either vehicle or 50 mg/kg TOFA given by daily intraperitoneal injection. P = 0.007, paired t test, treated vs. baseline.
Figure 6.
ACC1 selective inhibitors have activity in mIDH1 cancers. A, Viability of HT-1080 mIDH1 R132C cells after exposure to 4 μmol/L TOFA for 72 hours measured by DAPI-negative cell population. B, Representative images of wild-type IDH1 reversion HT-1080 cells cultured at low density in 4% lipid-depleted serum or IDH1 R132C parental cells or IDH1 R132C treated with 10 μmol/L ivosidenib. Note that cells with IDH1 R132C mutation form ultrathin adherent elongated spindle-like cells. This morphology change was not reversed by coculture with ivosidenib. C, Measurement of 2HG in the supernatant of parental mIHD1 HT-1080 cells but undetectable in wild-type IDH1 reversion HT-1080 cells (clone #65 is shown as representative clone) after 72 hours. D, Total abundance of lysophospholipids (LPC + LPE) measured by LC-MS in mIDH1 vs. WT HT-1080 cultured in lipid-depleted media. AUP, area under the peak. E, Growth curves of mIDH1 vs. wild-type revertant HT-1080 in lipid-replete (left) vs. lipid-depleted (right) serum over 7 days. F, FC decrease in the number of live IDH1 R132C HT-1080 cells compared with IDH1 reversion wild-type HT-1080 cells after 96-hour exposure to the ACC1 inhibitor TOFA compared with DMSO vehicle. Graph shows mean of 3 independent experiments. G, Western blot showing increased phosphorylated ACC1 Serine 79 after treatment of HT-1080 wild-type cells with increasing concentration of AICAR. H, FC decrease in the number of live IDH1 R132C HT-1080 cells after 96-hour exposure to AICAR vs. H2O vehicle in comparison with IDH1 reversion wild-type HT-1080 cells under same conditions. Graph is a summary of 3 independent experiments. I and J, Primary mIDH1 AML cells isolated by flow cytometry from a patient at relapse (I) and a de novo patient (J) are sensitive to 10 μmol/L TOFA over 72 hours, but cytotoxicity is not reversed by 10 μmol/L ivosidenib. ***, P < 0.001;**, P < 0.01; *, P < 0.05. RFU, relative fluorescence unit. K, Summary of TOFA IC50 at 72 hours after in vitro treatment of mIDH1, mIDH2, and IDH wild-type primary AML blasts cultured in low serum media. P value reflects nonparametric two-tailed comparison between groups; bars represent median IC50 in μmol/L. L, Engraftment of mIDH1 AML at baseline and after 30 days of treatment with either vehicle or 50 mg/kg TOFA given by daily intraperitoneal injection. P = 0.007, paired t test, treated vs. baseline. PDx, patient-derived xenograft; WT, wild-type.
Figure 7. ACC1-selective inhibitor ND-646 can overcome venetoclax resistance. A, Fold change decrease in the number of live IDH1 R132C HT-1080 cells compared with IDH1 reversion wild-type HT-1080 cells after 96 hours exposure to the ACC1 inhibitor ND-646 compared with DMSO vehicle. Graph shows mean of 3 independent experiments. B, Parental IDH1 R132C HT-1080 cells were treated with increasing concentrations of ACC1/2 inhibitor ND-646 ± 10 μmol/L ivosidenib. Cell viability was measured after 5 days in 4% lipid-stripped serum culture. This experiment was performed three times with a representative experiment shown. Bars represent standard deviation of technical replicates. No statistical differences were observed between ivosidenib-treated cells vs. untreated. C, Baseline and posttreatment bone marrow engraftment levels of human CD45+CD33+ mIDH1 AML exposed to ABT-199 50 mg/kg or ABT-199 50 mg/kg in combination with selective ACC1 inhibitor ND-646 100 mg/kg for 7 days by oral gavage. P values represent the nonparametric Mann–Whitney U test. D, Peripheral blood engraftment levels of mIDH1 primary AML after treatment for 14 days with either vehicle, ABT-199 50 mg/kg, or ABT-199 in combination with ND-646. E, Bone marrow engraftment levels of the same experiment in D. P values represent the nonparametric Mann–Whitney U test for D and E.
Figure 7.
The ACC1-selective inhibitor ND-646 can overcome venetoclax resistance. A, FC decrease in the number of live IDH1 R132C HT-1080 cells compared with IDH1 reversion wild-type (WT) HT-1080 cells after 96 hours exposure to the ACC1 inhibitor ND-646 compared with DMSO vehicle. Graph shows mean of 3 independent experiments. B, Parental IDH1 R132C HT-1080 cells were treated with increasing concentrations of the ACC1/2 inhibitor ND-646 ± 10 μmol/L ivosidenib. Cell viability was measured after 5 days in 4% lipid-stripped serum culture. This experiment was performed 3 times with a representative experiment shown. Bars represent standard deviation of technical replicates. No statistical differences were observed between ivosidenib-treated cells vs. untreated. RFU, relative fluorescence unit. C, Baseline and posttreatment bone marrow (BM) engraftment levels of human CD45+CD33+ mIDH1 AML exposed to ABT-199 50 mg/kg or ABT-199 50 mg/kg in combination with the selective ACC1 inhibitor ND-646 100 mg/kg for 7 days by oral gavage. P values represent the nonparametric Mann–Whitney U test. D, Peripheral blood (PB) engraftment levels of mIDH1 primary AML after treatment for 14 days with either vehicle, ABT-199 50 mg/kg, or ABT-199 in combination with ND-646. E, Bone marrow engraftment levels of the same experiment in D. P values represent the nonparametric Mann–Whitney U test for D and E. NS, nonsignificant; PDx, patient-derived xenograft.

Comment in

References

    1. Chou W, Hou H, Chen C, Tang J, Yao M, Tsay W, et al. . Distinct clinical and biologic characteristics in adult acute myeloid leukemia bearing the isocitrate dehydrogenase 1 mutation. Blood 2010;115:2749–54. - PubMed
    1. Dang L, Jin S, Su SM. IDH mutations in glioma and acute myeloid leukemia. Trends Mol Med 2010;16:387–97. - PubMed
    1. Dang L, White DW, Gross S, Bennett BD, Bittinger MA, Driggers EM, et al. . Cancer-associated IDH1 mutations produce 2-hydroxyglutarate. Nature 2009;462:739–44. - PMC - PubMed
    1. DiNardo CD, Ravandi F, Agresta S, Konopleva M, Takahashi K, Kadia T, et al. . Characteristics, clinical outcome, and prognostic significance of IDH mutations in AML. Am J Hematol 2015;90:732–6. - PMC - PubMed
    1. Saha SK, Parachoniak CA, Bardeesy N. IDH mutations in liver cell plasticity and biliary cancer. Cell Cycle 2014;13:3176–82. - PMC - PubMed

Publication types