

Evaluation of Formalin-Fixed and FFPE Tissues for Spatially Resolved Metabolomics and Drug Distribution Studies
- PMID: 36355479
- PMCID: PMC9697942
- DOI: 10.3390/ph15111307
Evaluation of Formalin-Fixed and FFPE Tissues for Spatially Resolved Metabolomics and Drug Distribution Studies
Abstract
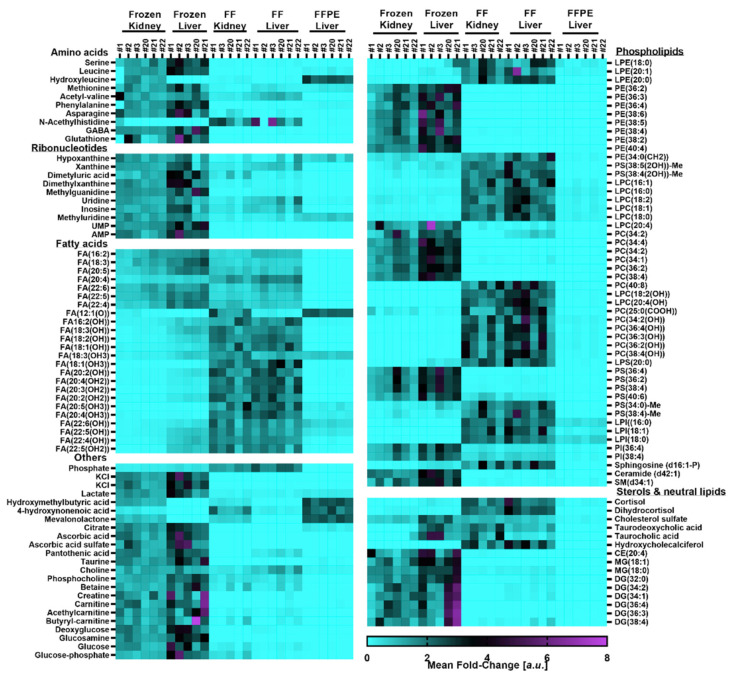
Fixation of samples is broadly used prior to the histological evaluation of tissue samples. Though recent reports demonstrated the ability to use fixed tissues for mass spectrometry imaging (MSI) based proteomics, glycomics and tumor classification studies, to date comprehensive evaluation of fixation-related effects for spatially resolved metabolomics and drug disposition studies is still missing. In this study we used matrix assisted laser desorption/ionization (MALDI) and desorption electrospray ionization (DESI) MSI to investigate the effect of formalin-fixation and formalin-fixation combined with paraffin embedding on the detectable metabolome including xenobiotics. Formalin fixation was found to cause significant washout of polar molecular species, including inorganic salts, amino acids, organic acids and carnitine species, oxidation of endogenous lipids and formation of reaction products between lipids and fixative ingredients. The slow fixation kinetics under ambient conditions resulted in increased lipid hydrolysis in the tissue core, correlating with the time-dependent progression of the fixation. Paraffin embedding resulted in subsequent partial removal of structural lipids resulting in the distortion of the elucidated biodistributions.
Keywords: DESI; FFPE; MALDI; mass spectrometry imaging; sample preparation.
Conflict of interest statement
The authors declare no conflict of interest. The funders had no role in the design of the study; in the collection, analyses, or interpretation of data; in the writing of the manuscript, or in the decision to publish the results.
Figures


Similar articles
-
PAXgene fixation enables comprehensive metabolomic and proteomic analyses of tissue specimens by MALDI MSI.Biochim Biophys Acta Gen Subj. 2018 Jan;1862(1):51-60. doi: 10.1016/j.bbagen.2017.10.005. Epub 2017 Oct 9. Biochim Biophys Acta Gen Subj. 2018. PMID: 29024724
-
Tissue fixed with formalin and processed without paraffin embedding is suitable for imaging of both peptides and lipids by MALDI-IMS.Proteomics. 2016 Jun;16(11-12):1670-7. doi: 10.1002/pmic.201500424. Epub 2016 May 25. Proteomics. 2016. PMID: 27001204
-
How Suitable is Matrix-Assisted Laser Desorption/Ionization-Time-of-Flight for Metabolite Imaging from Clinical Formalin-Fixed and Paraffin-Embedded Tissue Samples in Comparison to Matrix-Assisted Laser Desorption/Ionization-Fourier Transform Ion Cyclotron Resonance Mass Spectrometry?Anal Chem. 2016 May 17;88(10):5281-9. doi: 10.1021/acs.analchem.6b00460. Epub 2016 May 2. Anal Chem. 2016. PMID: 27065343
-
MALDI mass spectrometry imaging of formalin-fixed paraffin-embedded tissues in clinical research.Histol Histopathol. 2014 Nov;29(11):1365-76. doi: 10.14670/HH-29.1365. Epub 2014 May 19. Histol Histopathol. 2014. PMID: 24838644 Review.
-
Recent advances in matrix-assisted laser desorption/ionisation mass spectrometry imaging (MALDI-MSI) for in situ analysis of endogenous molecules in plants.Phytochem Anal. 2018 Jul;29(4):351-364. doi: 10.1002/pca.2759. Epub 2018 Apr 17. Phytochem Anal. 2018. PMID: 29667236 Review.
Cited by
-
Spatial-Omics Methods and Applications.Methods Mol Biol. 2025;2880:101-146. doi: 10.1007/978-1-0716-4276-4_5. Methods Mol Biol. 2025. PMID: 39900756 Review.
-
Mass spectrometry imaging methods for visualizing tumor heterogeneity.Curr Opin Biotechnol. 2024 Apr;86:103068. doi: 10.1016/j.copbio.2024.103068. Epub 2024 Feb 7. Curr Opin Biotechnol. 2024. PMID: 38310648 Free PMC article. Review.
-
Exploring 6-aza-2-Thiothymine as a MALDI-MSI Matrix for Spatial Lipidomics of Formalin-Fixed Paraffin-Embedded Clinical Samples.Metabolites. 2025 Aug 5;15(8):531. doi: 10.3390/metabo15080531. Metabolites. 2025. PMID: 40863150 Free PMC article.
-
MALDI HiPLEX-IHC: multiomic and multimodal imaging of targeted intact proteins in tissues.Front Chem. 2023 May 2;11:1182404. doi: 10.3389/fchem.2023.1182404. eCollection 2023. Front Chem. 2023. PMID: 37201132 Free PMC article.
-
Identification of Metabolomic Markers in Frozen or Formalin-Fixed and Paraffin-Embedded Samples of Diffuse Glioma from Adults.Int J Mol Sci. 2023 Nov 24;24(23):16697. doi: 10.3390/ijms242316697. Int J Mol Sci. 2023. PMID: 38069019 Free PMC article.
References
-
- Bruinen A.L., van Oevelen C., Eijkel G.B., Van Heerden M., Cuyckens F., Heeren R.M. Mass Spectrometry Imaging of Drug Related Crystal-Like Structures in Formalin-Fixed Frozen and Paraffin-Embedded Rabbit Kidney Tissue Sections. J. Am. Soc. Mass Spectrom. 2016;27:117–123. doi: 10.1007/s13361-015-1254-3. - DOI - PMC - PubMed
-
- Buck A., Ly A., Balluff B., Sun N., Gorzolka K., Feuchtinger A., Janssen K.P., Kuppen P.J., van de Velde C.J., Weirich G., et al. High-resolution MALDI-FT-ICR MS imaging for the analysis of metabolites from formalin-fixed, paraffin-embedded clinical tissue samples. J. Pathol. 2015;237:123–132. doi: 10.1002/path.4560. - DOI - PubMed
-
- Bonnel D., Longuespee R., Franck J., Roudbaraki M., Gosset P., Day R., Salzet M., Fournier I. Multivariate analyses for biomarkers hunting and validation through on-tissue bottom-up or in-source decay in MALDI-MSI: Application to prostate cancer. Anal. Bioanal. Chem. 2011;401:149–165. doi: 10.1007/s00216-011-5020-5. - DOI - PubMed
-
- Everest-Dass A.V., Briggs M.T., Kaur G., Oehler M.K., Hoffmann P., Packer N.H. N-glycan MALDI Imaging Mass Spectrometry on Formalin-Fixed Paraffin-Embedded Tissue Enables the Delineation of Ovarian Cancer Tissues. Mol. Cell. Proteom. 2016;15:3003–3016. doi: 10.1074/mcp.M116.059816. - DOI - PMC - PubMed
Grants and funding
LinkOut - more resources
Full Text Sources
