

Comparative Studies of Palmatine with Metformin and Glimepiride on the Modulation of Insulin Dependent Signaling Pathway In Vitro, In Vivo & Ex Vivo
- PMID: 36355489
- PMCID: PMC9695187
- DOI: 10.3390/ph15111317
Comparative Studies of Palmatine with Metformin and Glimepiride on the Modulation of Insulin Dependent Signaling Pathway In Vitro, In Vivo & Ex Vivo
Abstract
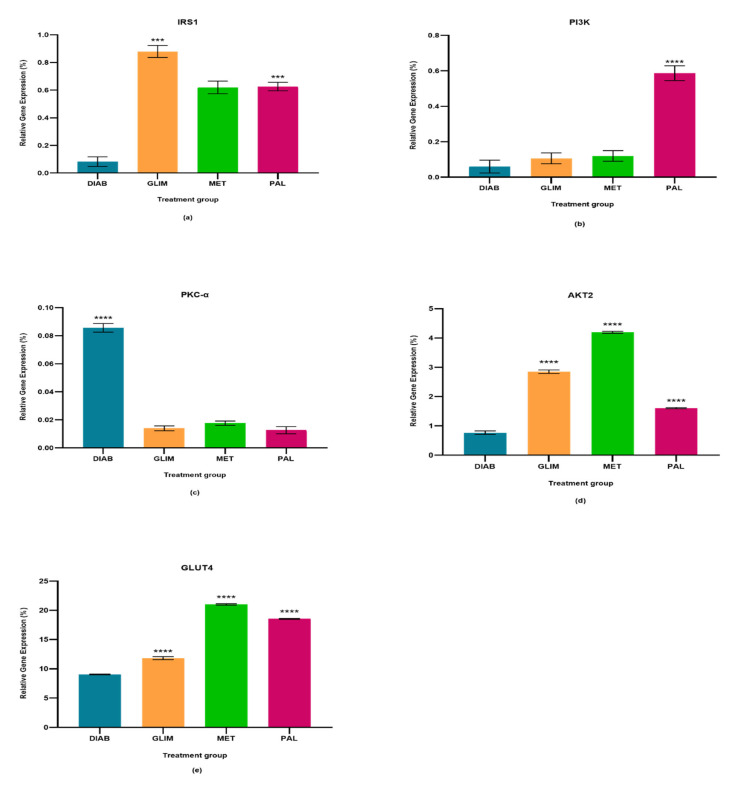
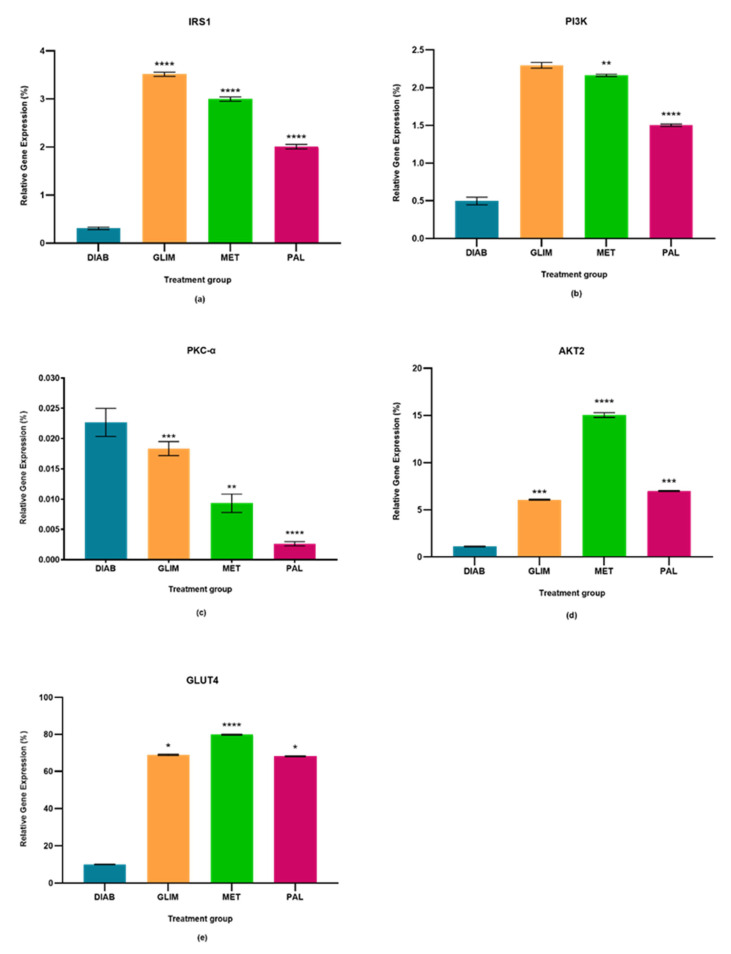
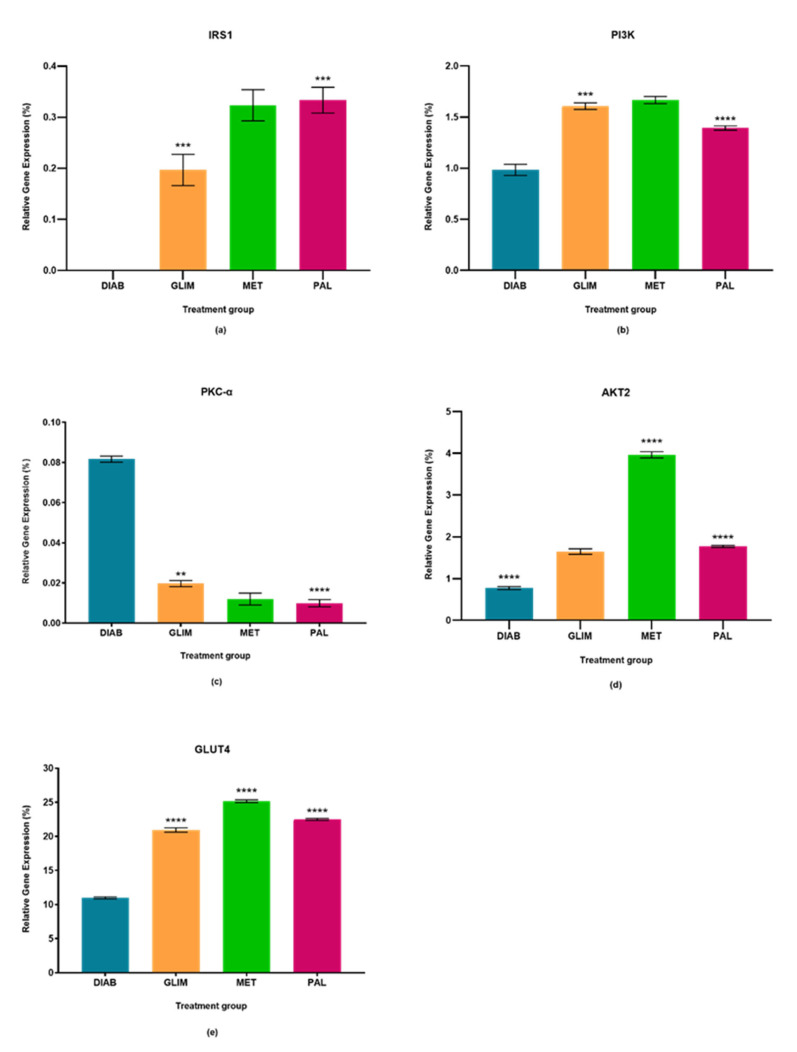
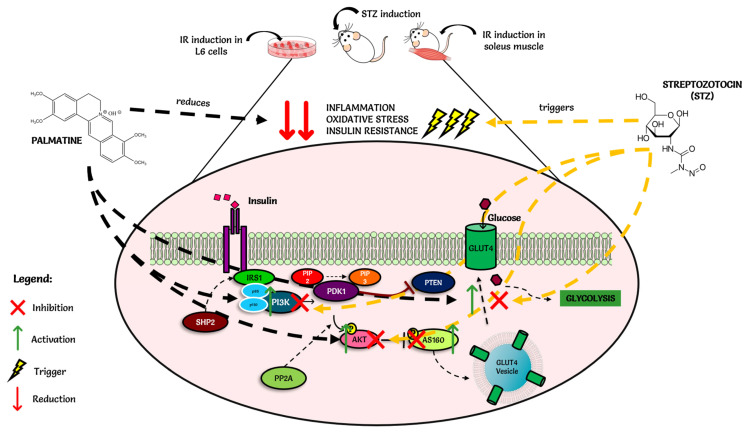
(1) Insulin resistance, a symptom of type 2 diabetes mellitus (T2DM), is caused by the inactivation of the insulin signaling pathway, which includes IRS-PI3K-IRS-1-PKC-AKT2 and GLUT4. Metformin (biguanide) and glimepiride (sulfonylurea) are both drugs that are derivatives of urea, and they are widely used as first-line drugs for the treatment of type 2 diabetes mellitus. Palmatine has been previously reported to possess antidiabetic and antioxidant properties. (2) The current study compared palmatine to metformin and glimepiride in a type 2 diabetes model for ADME and insulin resistance via the PI3K/Akt/GLUT4 signaling pathway: in vitro, in vivo, ex vivo, and in silico molecular docking. (3) Methods: Differentiated L6 skeletal muscle cells and soleus muscle tissue were incubated in standard tissue culture media supplemented with high insulin and high glucose as a cellular model of insulin resistance, whilst streptozotocin (STZ)-induced Sprague Dawley rats were used as the diabetic model. The cells/tissue/animals were treated with palmatine, while glimepiride and metformin were used as standard drugs. The differential gene expression of PI3K, IRS-1, PKC-α, AKT2, and GLUT4 was evaluated using qPCR. (4) Results: The results revealed that the genes IRS-PI3K-IRS-1-PKC-AKT2 were significantly down-regulated, whilst PKC-α was upregulated significantly in both insulin-resistant cells and tissue animals. Interestingly, palmatine-treated cells/tissue/animals were able to reverse these effects. (5) Conclusions: Palmatine appears to have rejuvenated the impaired insulin signaling pathway through upregulation of the gene expression of IRS-1, PI3K, AKT2, and GLUT4 and downregulation of PKC-expression, according to in vitro, in vivo, and ex vivo studies.
Keywords: AKT2; GLUT4; IRS1; PI3K; T2DM; glimepiride; metformin; palmatine.
Conflict of interest statement
The authors declare no conflict of interest.
Figures
References
-
- Saeedi P., Petersohn I., Salpea P., Malanda B., Karuranga S., Unwin N., Colagiuri S., Guariguata L., Motala A.A., Ogurtsova K., et al. Global and regional diabetes prevalence estimates for 2019 and projections for 2030 and 2045: Results from the International Diabetes Federation Diabetes Atlas, 9th edition. Diabetes Res. Clin. Pract. 2019;157:e107843. doi: 10.1016/j.diabres.2019.107843. - DOI - PubMed
Grants and funding
LinkOut - more resources
Full Text Sources
Miscellaneous
