

Exploitation and Verification of a Stroma- and Metastasis-Associated Risk Prognostic Signature in Pancreatic Adenocarcinoma
- PMID: 36355508
- PMCID: PMC9696859
- DOI: 10.3390/ph15111336
Exploitation and Verification of a Stroma- and Metastasis-Associated Risk Prognostic Signature in Pancreatic Adenocarcinoma
Abstract
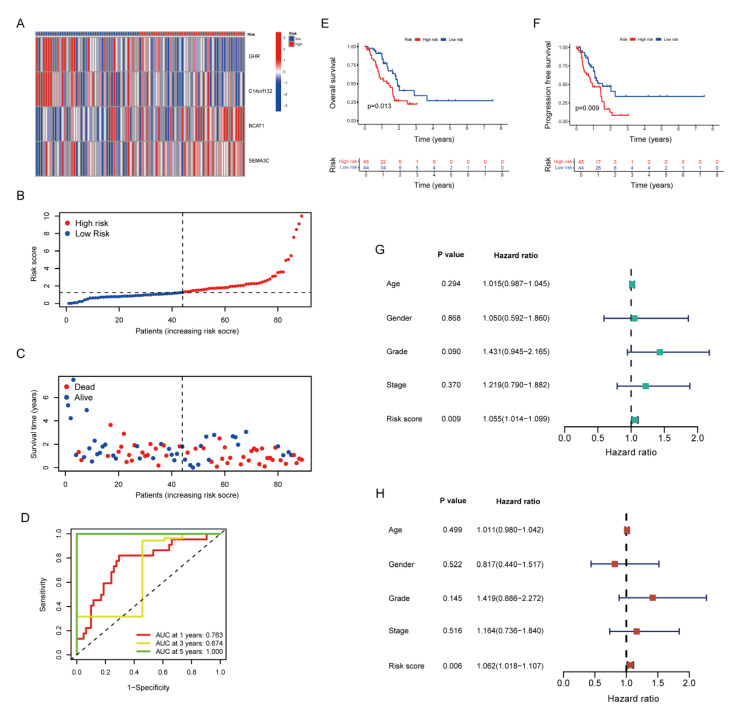
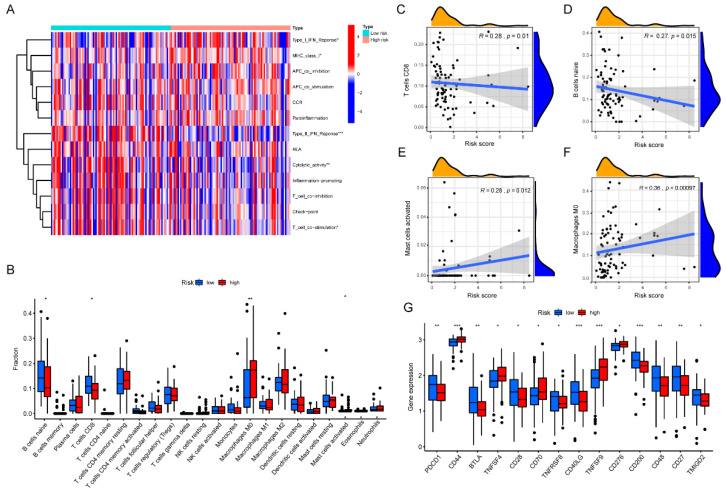
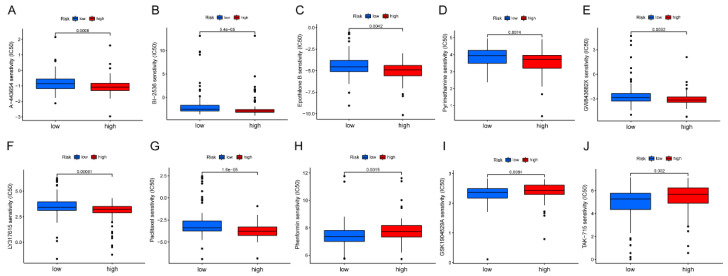
Pancreatic adenocarcinoma (PAAD), one of the most malignant tumors, not only has abundant mesenchymal components, but is also characterized by an extremely high metastatic risk. The purpose of this study was to construct a model of stroma- and metastasis-associated prognostic signature, aiming to benefit the existing clinical staging system and predict the prognosis of patients. First, stroma-associated genes were screened from the TCGA database with the ESTIMATE algorithm. Subsequently, transcriptomic data from clinical tissues in the RenJi cohort were screened for metastasis-associated genes. Integrating the two sets of genes, we constructed a risk prognostic signature by Cox and LASSO regression analysis. We then obtained a risk score by a quantitative formula and divided all samples into high- and low-risk groups based on the scores. The results demonstrated that patients with high-risk scores have a worse prognosis than those with low-risk scores, both in the TCGA database and in the RenJi cohort. In addition, tumor mutation burden, chemotherapeutic drug sensitivity and immune infiltration analysis also exhibited significant differences between the two groups. In exploring the potential mechanisms of how stromal components affect tumor metastasis, we simulated different matrix stiffness in vitro to explore its effect on EMT key genes in PAAD cells. We found that cancer cells stimulated by high matrix stiffness may trigger EMT and promote PAAD metastasis.
Keywords: metastasis; pancreatic adenocarcinoma; risk prognostic signature; stroma; tumor microenvironment.
Conflict of interest statement
The authors declare no conflict of interest.
Figures


Similar articles
-
Development and Validation of an Inflammatory Response-Related Gene Signature for Predicting the Prognosis of Pancreatic Adenocarcinoma.Inflammation. 2022 Aug;45(4):1732-1751. doi: 10.1007/s10753-022-01657-6. Epub 2022 Mar 23. Inflammation. 2022. PMID: 35322324
-
Using ESTIMATE algorithm to establish an 8-mRNA signature prognosis prediction system and identify immunocyte infiltration-related genes in Pancreatic adenocarcinoma.Aging (Albany NY). 2020 Mar 17;12(6):5048-5070. doi: 10.18632/aging.102931. Epub 2020 Mar 17. Aging (Albany NY). 2020. PMID: 32181755 Free PMC article.
-
Cuproptosis-related lncRNA scoring system to predict the clinical outcome and immune landscape in pancreatic adenocarcinoma.Sci Rep. 2023 Nov 27;13(1):20870. doi: 10.1038/s41598-023-47223-4. Sci Rep. 2023. PMID: 38012210 Free PMC article.
-
Comprehensive analyses and experimental verification of NETs and an EMT gene signature for prognostic prediction, immunotherapy, and chemotherapy in pancreatic adenocarcinoma.Environ Toxicol. 2024 Apr;39(4):2006-2023. doi: 10.1002/tox.24082. Epub 2023 Dec 13. Environ Toxicol. 2024. PMID: 38088494
-
Construction and comprehensive analysis of a novel prognostic signature associated with pyroptosis molecular subtypes in patients with pancreatic adenocarcinoma.Front Immunol. 2023 Feb 3;14:1111494. doi: 10.3389/fimmu.2023.1111494. eCollection 2023. Front Immunol. 2023. PMID: 36817451 Free PMC article.
Cited by
-
Tumor innervation in cervical cancer: Prognostic insights from myelin-associated risk signatures.FASEB Bioadv. 2025 Apr 23;7(5):e70004. doi: 10.1096/fba.2024-00190. eCollection 2025 May. FASEB Bioadv. 2025. PMID: 40330434 Free PMC article.
References
-
- Tang D., Wang D., Yuan Z., Xue X., Zhang Y., An Y., Chen J., Tu M., Lu Z., Wei J., et al. Persistent activation of pancreatic stellate cells creates a microenvironment favorable for the malignant behavior of pancreatic ductal adenocarcinoma. Int. J. Cancer. 2013;132:993–1003. doi: 10.1002/ijc.27715. - DOI - PubMed
Grants and funding
LinkOut - more resources
Full Text Sources
