. 2023 Feb;59(2):326-343.
doi: 10.1037/dev0001460. Epub 2022 Nov 10.

A new perspective on the role of physical salience in visual search: Graded effect of salience on infants' attention

Affiliations

A new perspective on the role of physical salience in visual search: Graded effect of salience on infants' attention

Michaela C DeBolt et al. Dev Psychol. 2023 Feb.

Abstract

We tested 6- and 8-month-old White and non-White infants (N = 53 total, 28 girls) from Northern California in a visual search task to determine whether a unique item in an otherwise homogeneous display (a singleton) attracts attention because it is a unique singleton and "pops out" in a categorical manner, or whether attention instead varies in a graded manner on the basis of quantitative differences in physical salience. Infants viewed arrays of four or six items; one item was a singleton and the other items were identical distractors (e.g., a single cookie and three identical toy cars). At both ages, infants looked to the singletons first more often, were faster to look at singletons, and looked longer at singletons. However, when a computational model was used to quantify the relative salience of the singleton in each display-which varied widely among the different singleton-distractor combinations-we found a strong, graded effect of physical salience on attention and no evidence that singleton status per se influenced attention. In addition, consistent with other research on attention in infancy, the effect of salience was stronger for 6-month-old infants than for 8-month-old infants. Taken together, these results show that attention-getting and attention-holding in infancy vary continuously with quantitative variations in physical salience rather than depending in a categorical manner on whether an item is unique. (PsycInfo Database Record (c) 2023 APA, all rights reserved).


Figures

Figure 1.
Figure 1.
Schematic displays of stimulus arrays presented to infants (A) and schematic areas of interest (AOIs) used for the eye tracking data analysis (B) for both set size 4 arrays (left) and set size 6 arrays (right). Note that the images composing the arrays were obtained from Pixabay (www.pixabay.com) and are freely available for public use and are included here for illustration purposes only. All the stimuli that were used in the study are available at https://osf.io/k6qev/.
Figure 2.
Figure 2.
A schematic depiction of the relative salience score calculation process with the incremental steps illustrated in columns A through D. A: Example arrays with a set size 6 array on top and a set size 4 array on bottom. B: For each stimulus array, a salience map is generated using the GBVS toolbox in Matlab. C: The eye tracking AOIs are applied to the salience maps generated in the previous step and the pixel values within the dimensions of each AOI are averaged to create the raw salience scores. D: Next, the raw salience scores for the distractors are averaged to the distractor average salience score (i.e., the .31 value in top array in column D and .19 value in bottom array). The relative salience score (what is used in the main analyses) is computed by dividing the salience difference score (singleton salience score - distractor average salience score) by the sum of the distractor average salience score and the singleton salience score. Note that the images composing the arrays were obtained from Pixabay (www.pixabay.com) and are freely available for public use and are included here for illustration purposes only. All the stimuli that were used in the study are available at https://osf.io/k6qev/.
Figure 3.
Figure 3.
Relative salience scores (x-axis) for each singleton-distractor pair (y-axis). The set size of each array is indicated by the color of each point. The vertical black line denotes equal salience between the singleton and the average of the distractors. Note that the stimuli differ considerably in the relative salience of the singleton, with the singleton being no more salient than the distractors in some cases. The relative salience of the singleton varied slightly depending on its location within the array; thus the colored points represent the average relative salience across all possible positions in the array.
Figure 4.
Figure 4.
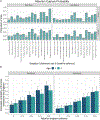
A: Attention capture probability for each target-distractor pair at each set size (4- and 6-item arrays) and age (6-mos, 8-mos). The height of the bars represent the proportion of total trials in which infants’ gaze was first directed to the singleton. The relative singleton salience and the singleton-distractor pair names are denoted along the x-axis. The stimuli are arranged in ascending order with respect to relative singleton salience, with salience increasing from left to right. B: Statistical modeling results. The height of the bars represent the estimated probability of looking to the singleton first from the GLMM (y-axis) for both groups of infants (different colored bars) at specified levels of relative singleton salience (x-axis). Probabilities are calculated as odds / (1 + odds). Error bars are back-transformed from the logit scale and represent asymptotic upper and lower 95% confidence limits. The black dashed horizontal lines bisecting both figures denote chance-level responding for set size 4 (.25) and set size 6 (.167).
Figure 5.
Figure 5.
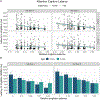
A: Attention capture latency as a function of the relative salience of the singleton for each set size (4- and 6-item arrays) and age (6-mos, 8-mos). Each point represents a single infant’s latency to look to the singleton (y-axis) on an individual trial. Although we do not include infant sex in our analyses, as required by our funding source we disagregate the data by biological sex in the data by indicating female infants with circles and male infants with triangles. The regression lines show a negative relation between infants’ latencies and the relative salience of the singleton. Note that the data points (circle and triangle points) were horizontally jittered ±.01 values along the x-axis to aid in visualization. B: Marginal means from the LMM for the latency to the singleton (y-axis) at specified levels of relative singleton salience (x-axis). Error bars represent 95% confidence intervals. Intervals are back-transformed from the scale (M = 1150, SD = 1020).
Figure 6.
Figure 6.
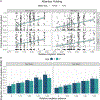
A: Trial-level data plots of attention-holding for each set size (4- and 6-item arrays) and age (6-mos, 8-mos). Each point represents a single participant’s proportion of looking to the singleton (y-axis) on an individual trial and, although we did not include sex in our models, we disagregated our data by biological sex by using different shapes to indicate female and male infants. The relative singleton salience is denoted along the x-axis. The regression lines show a positive relation between infants’ proportion of looking to the singleton and the relative salience of the singleton. Note that the data points (circle and triangle points) were horizontally jittered ±.01 values along the x-axis to aid in visualization. B: The height of the bars represent the estimated marginal means from the LMM for the proportion of looking to the singleton (y-axis) for both groups of infants (different colored bars) at specified levels of relative singleton salience (x-axis). Error bars represent 95% confidence intervals. The black dashed horizontal lines bisecting both figures denote chance-level responding for set size 4 (.25) and set size 6 (.167).

References

    1. Adler SA, & Gallego P (2014). Search asymmetry and eye movements in infants and adults. Attention, Perception & Psychophysics, 76(6), 1590–1608. 10.3758/s13414-014-0667-6 - DOI - PubMed
    1. Adler SA, & Orprecio J (2006). The eyes have it: Visual pop-out in infants and adults. Developmental Science, 9(2), 189–206. 10.1111/j.1467-7687.2006.00479.x - DOI - PubMed
    1. Alexander RG, & Zelinsky GJ (2011). Visual similarity effects in categorical search. Journal of Vision, 11(8). 10.1167/11.8.9 - DOI - PMC - PubMed
    1. Amso D, Haas S, & Markant J (2014). An eye tracking investigation of developmental change in bottom-up attention orienting to faces in cluttered natural scenes. PloS One, 9(1). 10.1371/journal.pone.0085701 - DOI - PMC - PubMed
    1. Awh E, Belopolsky AV, & Theeuwes J (2012). Top-down versus bottom-up attentional control: A failed theoretical dichotomy. Trends in Cognitive Sciences, 16(8), 437–443. 10.1016/j.tics.2012.06.010 - DOI - PMC - PubMed