

The tradeoff between item and order information in short-term memory does not depend on encoding time
- PMID: 36355706
- PMCID: PMC10029126
- DOI: 10.1037/xhp0001074
The tradeoff between item and order information in short-term memory does not depend on encoding time
Abstract
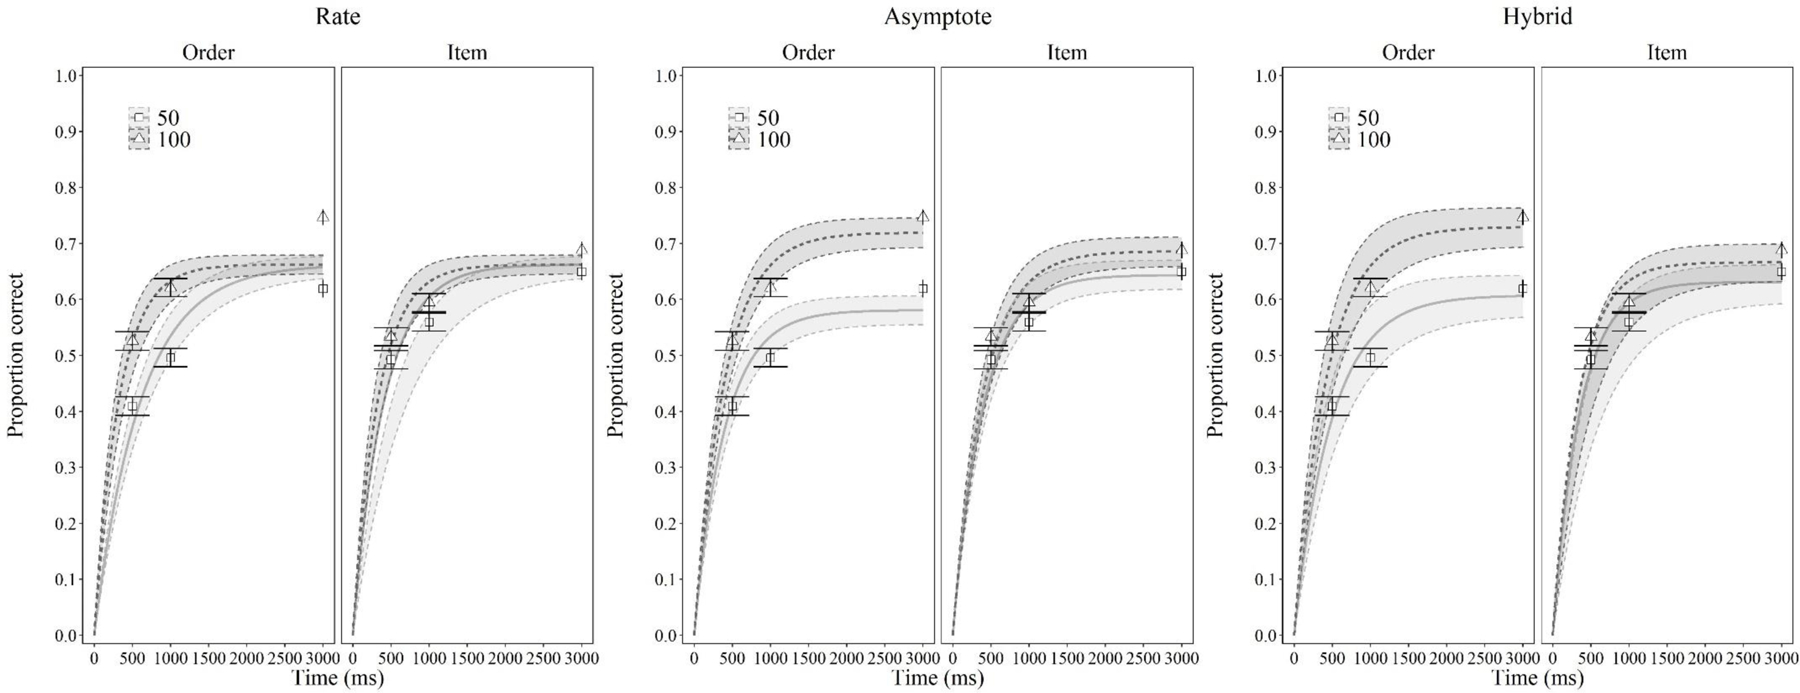
Participants can optimize encoding of an immediate verbal memory test for item or for order information, or they can try to be ready for either type of test. Dividing encoding between both kinds of information, however, comes at a cost. Recently, it has been shown that the cost is more severe for order information compared to item information (Guitard et al., 2022). Here, for the first time, we evaluated which factor can better account for this asymmetry by contrasting two hypotheses. According to a rate hypothesis, divided attention affects the rate of encoding more for order than for items. According to an alternative, asymptote hypothesis, divided attention does not affect the rates but diminishes the endpoint, or asymptotic level, of order encoding more than item encoding. In three experiments to distinguish these hypotheses, participants prepared for an item fragment completion test, an order reconstruction test, or both types of tests, in trials with different durations of presentation. Overall, our results were better accounted for by a model which assumes that dividing attention between preparation for item and order testing affects the asymptote of encoding more for order than for items, with no effects on the rates of order or item encoding compared to preparation for a single test. The findings not only replicate our prior results, but also demonstrate that the allocation of attention to item or order processing can be disentangled from the time on task. (PsycInfo Database Record (c) 2023 APA, all rights reserved).
Figures


Similar articles
-
Attention allocation between item and order information in short-term memory.Q J Exp Psychol (Hove). 2023 Jun;76(6):1391-1409. doi: 10.1177/17470218221118451. Epub 2022 Aug 24. Q J Exp Psychol (Hove). 2023. PMID: 35899857 Free PMC article.
-
Tradeoffs between Item and Order Information in Short-Term Memory.J Mem Lang. 2022 Feb;122:104300. doi: 10.1016/j.jml.2021.104300. Epub 2021 Nov 12. J Mem Lang. 2022. PMID: 36061403 Free PMC article.
-
Asymmetrical interference between item and order information in short-term memory.J Exp Psychol Learn Mem Cogn. 2021 Feb;47(2):243-263. doi: 10.1037/xlm0000956. Epub 2020 Aug 24. J Exp Psychol Learn Mem Cogn. 2021. PMID: 32833467 Free PMC article.
-
Arousal affects short-term serial recall.Can J Exp Psychol. 2022 Jun;76(2):99-110. doi: 10.1037/cep0000272. Epub 2022 Feb 24. Can J Exp Psychol. 2022. PMID: 35201797
-
Interference between maintenance and processing in working memory: the effect of item-distractor similarity in complex span.J Exp Psychol Learn Mem Cogn. 2012 May;38(3):665-85. doi: 10.1037/a0026337. Epub 2011 Dec 5. J Exp Psychol Learn Mem Cogn. 2012. PMID: 22141748 Review.
Cited by
-
How are patterned movements stored in working memory?Front Psychol. 2023 Feb 17;14:1074520. doi: 10.3389/fpsyg.2023.1074520. eCollection 2023. Front Psychol. 2023. PMID: 36874799 Free PMC article.
-
The Relation Between Attention and Memory.Annu Rev Psychol. 2024 Jan 18;75:183-214. doi: 10.1146/annurev-psych-040723-012736. Epub 2023 Sep 15. Annu Rev Psychol. 2024. PMID: 37713810 Free PMC article. Review.
-
An embedded computational framework of memory: The critical role of representations in veridical and false recall predictions.Psychon Bull Rev. 2025 Apr 11. doi: 10.3758/s13423-025-02669-7. Online ahead of print. Psychon Bull Rev. 2025. PMID: 40216666 Review.
-
Expectation violation enhances short-term source memory.Psychon Bull Rev. 2025 Jun 6. doi: 10.3758/s13423-025-02715-4. Online ahead of print. Psychon Bull Rev. 2025. PMID: 40481295
-
Similar working memory outcomes with successive versus concurrent presentation of tones and colors.Atten Percept Psychophys. 2025 Apr;87(3):884-898. doi: 10.3758/s13414-025-03036-3. Epub 2025 Mar 18. Atten Percept Psychophys. 2025. PMID: 40102328 Free PMC article.
References
-
- Abrahamse EL, van Dijck J-P, & Fias W (2017). Grounding verbal working memory: The case of serial order. Current Directions in Psychological Science, 26, 429–433. 10.1177/0963721417704404 - DOI
-
- Anderson JR, & Matessa M (1997). A production system theory of serial memory. Psychological Review, 104, 728–748. 10.1037/0033-295X.104.4.728 - DOI
-
- Anderson JR, Bothell D, Lebiere C, & Matessa M (1998). An integrated theory of list memory. Journal of Memory and Language, 38, 341–380. 10.1006/jmla.1997.2553 - DOI
-
- Barrouillet P, & Camos V (2015). Working memory: Loss and reconstruction London, UK: Psychology Press.
