. 2022 Nov 10;17(11):e0275066.
doi: 10.1371/journal.pone.0275066. eCollection 2022.

Human lipoproteins comprise at least 12 different classes that are lognormally distributed

Affiliations

Human lipoproteins comprise at least 12 different classes that are lognormally distributed

Tomokazu Konishi et al. PLoS One. .

Abstract

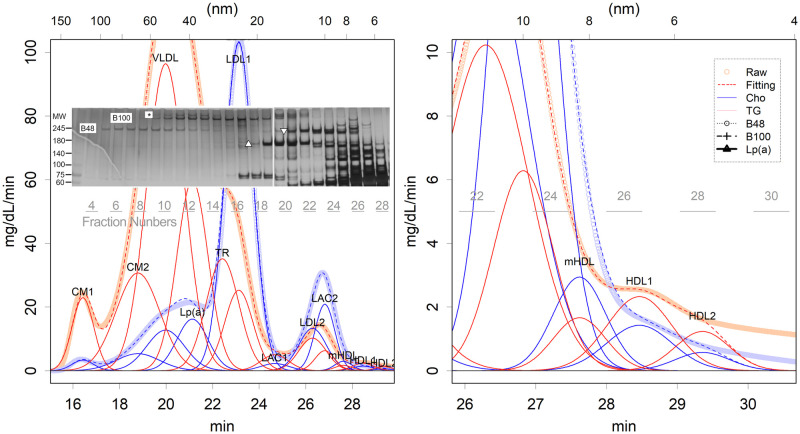
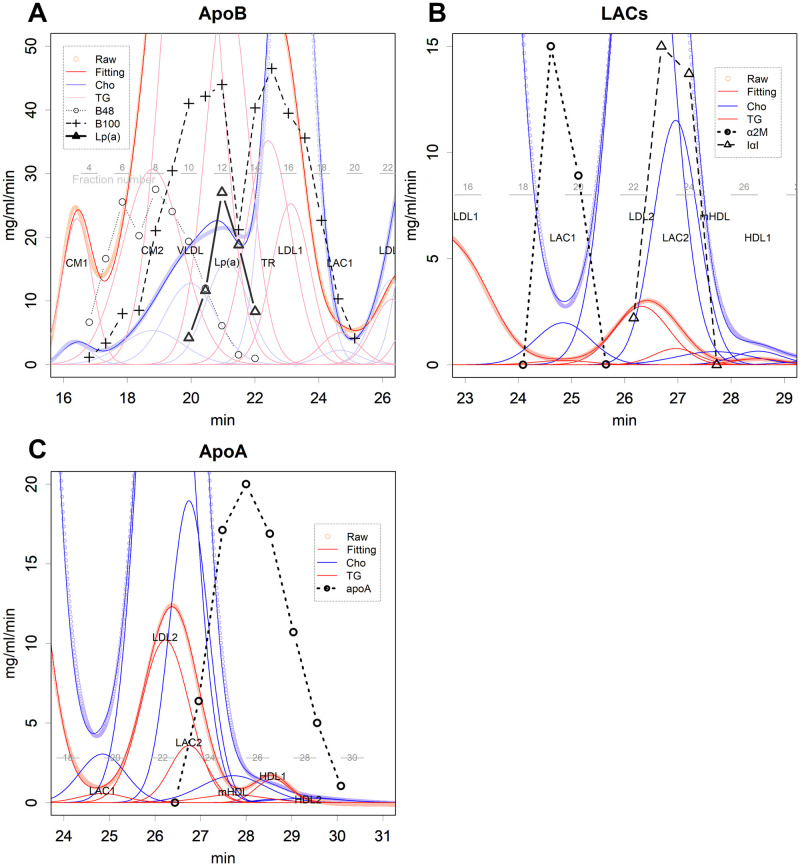
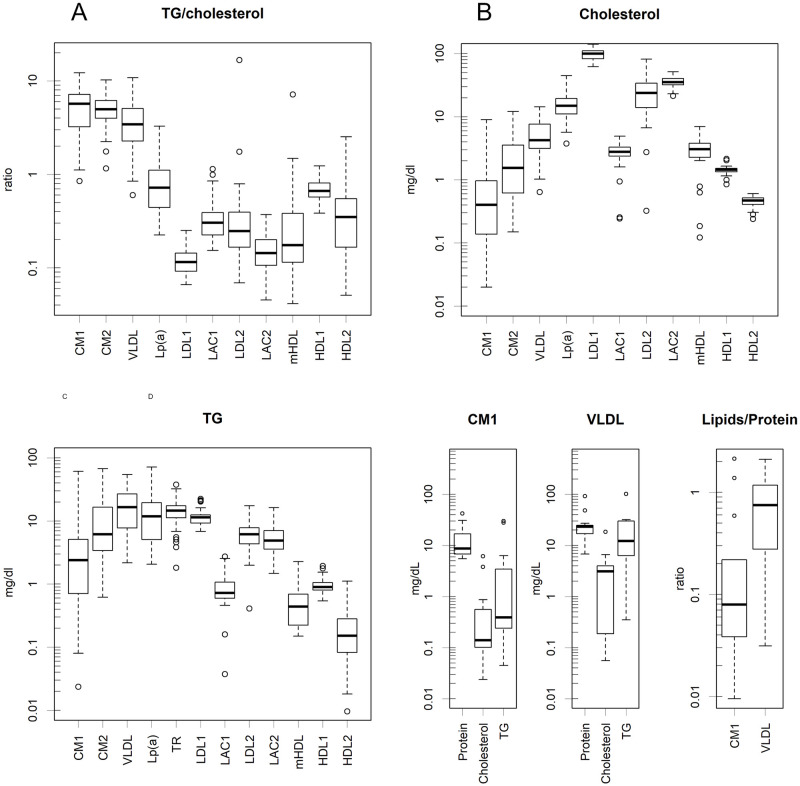
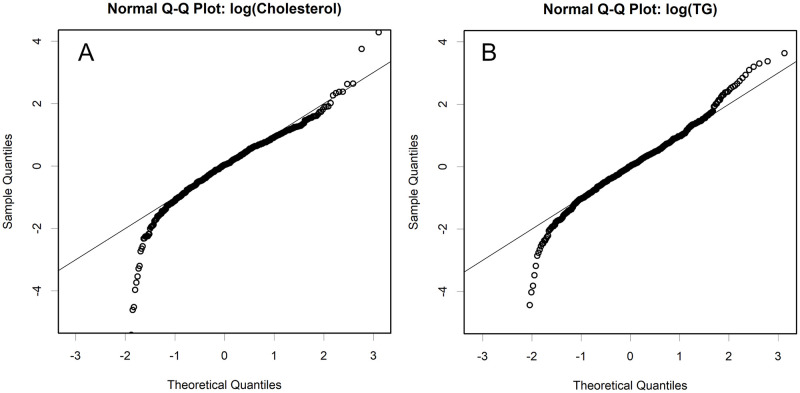
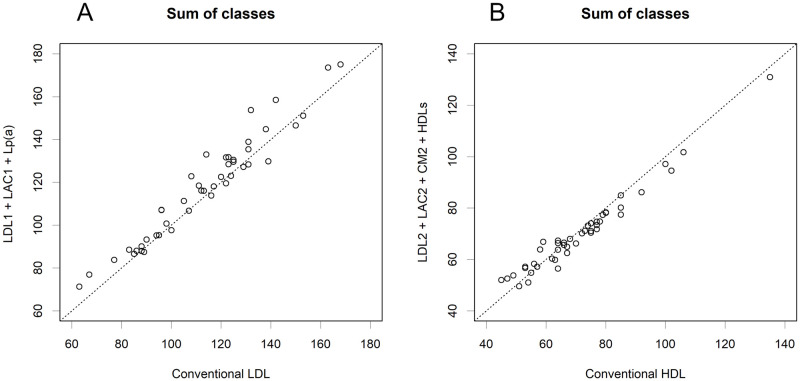
This study presents the results of HPLC, a gentler and rapid separation method in comparison with the conventional ultracentrifugation, for 55 human serum samples. The elution patterns were analysed parametrically, and the attribute of each class was confirmed biochemically. Human samples contained 12 classes of lipoproteins, each of which may consist primarily of proteins. There are three classes of VLDLs. The level of each class was distributed lognormally, and the standard amount and the 95% range were estimated. Some lipoprotein classes with a narrow range could become ideal indicators of specific diseases. This lognormal character suggests that the levels are controlled by the synergy of multiple factors; multiple undesirable lifestyle habits may drastically increase the levels of specific lipoprotein classes. Lipoproteins in medical samples have been measured by enzymatic methods that coincide with conventional ultracentrifugation; however, the high gravity and time required for ultracentrifugation can cause sample degradation. Actually, the enzymatic methods measured the levels of several mixed classes. The targets of enzymatic methods have to be revised.


Conflict of interest statement

The authors have declared that no competing interests exist.

Figures

Fig 1
Fig 1. Elution pattern of HPLC of a hyperlipidaemia patient.
In gel filtration, the shorter the elution time, the larger the particle size; elution time is proportional to the logarithms of the diameter of the particles. Left: Whole image, right: Enlarged view around HDLs. The bold line presents the measurement raw data, the red (TG) and blue (cholesterol) lines are the curve-fitted classes, and the dotted lines are their sum. There are 12 classes. The superimposed photo is a part of SDS-PAGE. Each lane corresponds to the fraction number displayed directly below it (gray). B100 and B48 are the respective ApoB positions. ▵:Alpha-2-macroglobulin, ▿: Inter-alpha-trypsin inhibitor heavy chain, *: Lp(a). Here an example of a hyperlipidaemic patient is shown so that the classes can be easily observed. An alternative to healthy volunteers is shown in S3 Fig in S1 File.
Fig 2
Fig 2. Elution pattern of proteins.
A. ApoB100, ApoB48, and Lp(a). B. LACs. Bands of the silver-stained SAS-PAGEs were determined by densitometry. The bands were identified by MALDI-TOF MS and western blotting using specific antibodies. The grey horizontal numbers and lines indicate the fraction numbers collected in the HPLC separation. C. Western blot results for ApoA.
Fig 3
Fig 3. Box plot of the logarithm of quantity.
All the y-axes are on a logarithmic scale. A. The ratio of TG/cholesterol. Naturally, the ones produced with TG are higher. The contents are B. Cholesterol and C. TG (mg / dL). While LDL1, LACs, and HDLs appeared within a certain narrow range, CM and VLDL levels fluctuated. D. Amounts and ratios of CM and VLDL measured by the preparative HPLC of healthy samples. Lipids (TG + cholesterol) are less than proteins in those classes.
Fig 4
Fig 4. Normal QQ plot of the logarithms of normalized data.
Cholesterol (A.) and TG (B). Quantiles are compared between the theoretical normal distribution and the z-normalized log-data. Here a lognormal distribution will form a straight relationship.
Fig 5
Fig 5. Estimation of the sets of classes that are measured by a conventional method.
If the conventional methods extract most of the cholesterol from particular classes, these would present the sum of the quantities of the classes. The combinations presented here were the ones with the highest correlation and the closest amounts. A. Conventional LDL. Pearson’s r = 0.9680; p < 2.2e-16. B. Conventional HDL. Pearson’s r = 0.9806; p < 2.2e-16.

References

    1. Redgrave TG, Roberts DC, West CE. Separation of plasma lipoproteins by density-gradient ultracentrifugation. Anal Biochem. 1975;65(1–2):42–9. doi: 10.1016/0003-2697(75)90488-1 . - DOI - PubMed
    1. Chapman MJ, Goldstein S, Lagrange D, Laplaud PM. A density gradient ultracentrifugal procedure for the isolation of the major lipoprotein classes from human serum. J Lipid Res. 1981;22(2):339–58. . - PubMed
    1. Oschry Y, Eisenberg S. Rat plasma lipoproteins: re-evaluation of a lipoprotein system in an animal devoid of cholesteryl ester transfer activity. J Lipid Res. 1982;23(8):1099–106. . - PubMed
    1. Stahlman M, Davidsson P, Kanmert I, Rosengren B, Boren J, Fagerberg B, et al.. Proteomics and lipids of lipoproteins isolated at low salt concentrations in D2O/sucrose or in KBr. J Lipid Res. 2008;49(2):481–90. Epub 2007/11/21. doi: 10.1194/jlr.D700025-JLR200 . - DOI - PubMed
    1. Havel RJ, Eder HA, Bragdon JH. The distribution and chemical composition of ultracentrifugally separated lipoproteins in human serum. The Journal of Clinical Investigation. 1955;34(9):1345–53. doi: 10.1172/JCI103182 - DOI - PMC - PubMed

Publication types