

Molecular Characterization of Acquired Resistance to KRASG12C-EGFR Inhibition in Colorectal Cancer
- PMID: 36355783
- PMCID: PMC9827113
- DOI: 10.1158/2159-8290.CD-22-0405
Molecular Characterization of Acquired Resistance to KRASG12C-EGFR Inhibition in Colorectal Cancer
Abstract
With the combination of KRASG12C and EGFR inhibitors, KRAS is becoming a druggable target in colorectal cancer. However, secondary resistance limits its efficacy. Using cell lines, patient-derived xenografts, and patient samples, we detected a heterogeneous pattern of putative resistance alterations expected primarily to prevent inhibition of ERK signaling by drugs at progression. Serial analysis of patient blood samples on treatment demonstrates that most of these alterations are detected at a low frequency except for KRASG12C amplification, a recurrent resistance mechanism that rises in step with clinical progression. Upon drug withdrawal, resistant cells with KRASG12C amplification undergo oncogene-induced senescence, and progressing patients experience a rapid fall in levels of this alteration in circulating DNA. In this new state, drug resumption is ineffective as mTOR signaling is elevated. However, our work exposes a potential therapeutic vulnerability, whereby therapies that target the senescence response may overcome acquired resistance.
Significance: Clinical resistance to KRASG12C-EGFR inhibition primarily prevents suppression of ERK signaling. Most resistance mechanisms are subclonal, whereas KRASG12C amplification rises over time to drive a higher portion of resistance. This recurrent resistance mechanism leads to oncogene-induced senescence upon drug withdrawal and creates a potential vulnerability to senolytic approaches. This article is highlighted in the In This Issue feature, p. 1.
©2022 The Authors; Published by the American Association for Cancer Research.
Figures
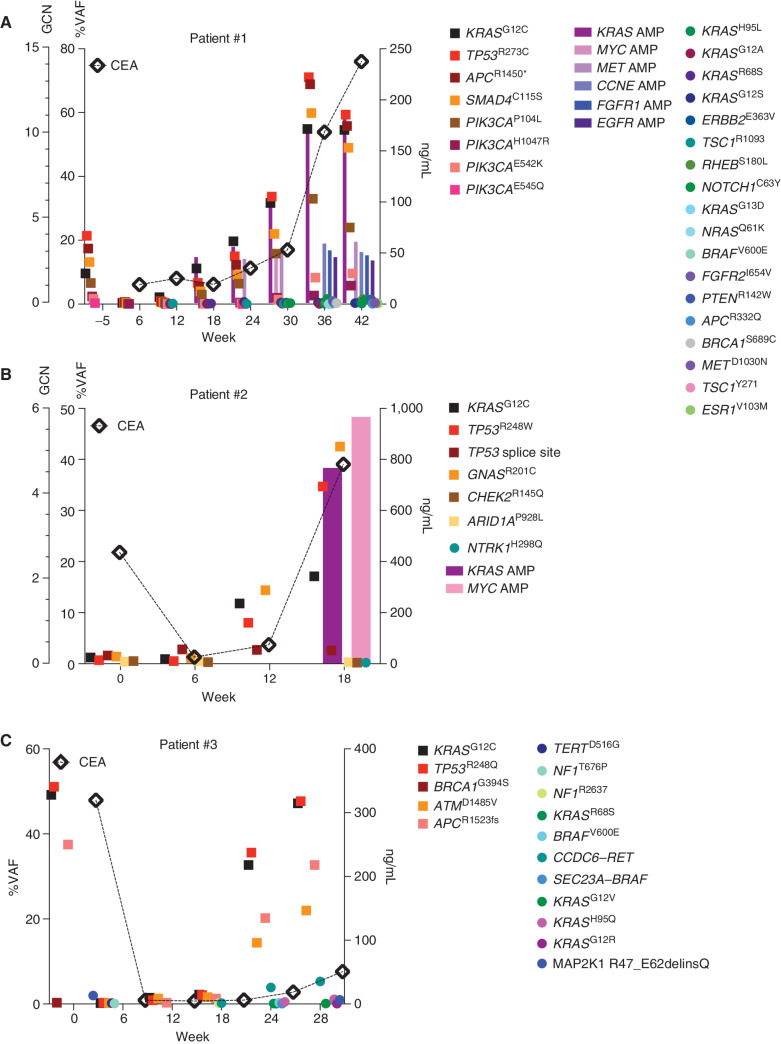
![Figure 1. Mechanisms of resistance to combined KRASG12C and EGFR inhibition in colorectal cancer. A, Graph showing cell viability of parental and resistant C106 and RW7213 cells. Statistical analyses and P values represent Mann–Whitney test (t test); ****, P d 0.0001. B, Heat map of KRASG12C and NRAS G12D alleles detected by single-cell sequencing of C106-resistant subline. VAF: variant allelic frequency; GQ: genotyping quality score from GATK; DP: sequencing depth. C, FISH staining for KRAS gene in RW7213 parental and resistant subline. Manual review of parental RW7213 cells indicated no amplification [mean KRAS (red)/Cen12 (green) ratio of 1.1; 50 cells counted] in approximately 90% of the hybridized area and approximately 10% hybridized area with increased KRAS copies (mean red/green ratio of 3.5; 50 cells counted). Mean red/green ratio in the resistant subline, based on manual counting of 20 cells, was 6.4 with >20 KRAS (red) signals in all cells. Scale bars, 5 µm. D, Nonsynonymous somatic mutations identified by MSK-IMPACT in the CLR-113 original and resistant PDX. Mutation types (left) and CCF of mutations identified (right) are color coded according to the legend. E, CNAs of the CLR-113 original and resistant PDX (top). Copy-number log2 ratios are shown on the y-axis according to the chromosomes on the x-axis. The arrow shows KRAS amplification. F, Plot showing duration of response to KRASG12C inhibitor (adagrasib/sotorasib) plus EGFR inhibitor (cetuximab/panitumumab) by patient ID number. Best response by RECIST is noted at the end of each bar, and partial responses are shaded green and stable disease shaded orange. G, Oncoprint of emergent alterations detected in circulating tumor DNA (ctDNA) of colorectal cancer patients at the time of radiographic or clinical progression through combined KRASG12C and EGFR inhibition. Patient 12 had both ctDNA and tumor tissue analyzed at progression, and emergent alterations identified only in tissue are marked with an asterisk.](https://cdn.ncbi.nlm.nih.gov/pmc/blobs/736b/9827113/25d413c6695a/41fig1.jpg)
Comment in
References
Publication types
MeSH terms
Substances
Grants and funding
LinkOut - more resources
Full Text Sources
Medical
Research Materials
Miscellaneous
