

Stochastic mortality forecasts for Bangladesh
- PMID: 36355800
- PMCID: PMC9648772
- DOI: 10.1371/journal.pone.0276966
Stochastic mortality forecasts for Bangladesh
Abstract
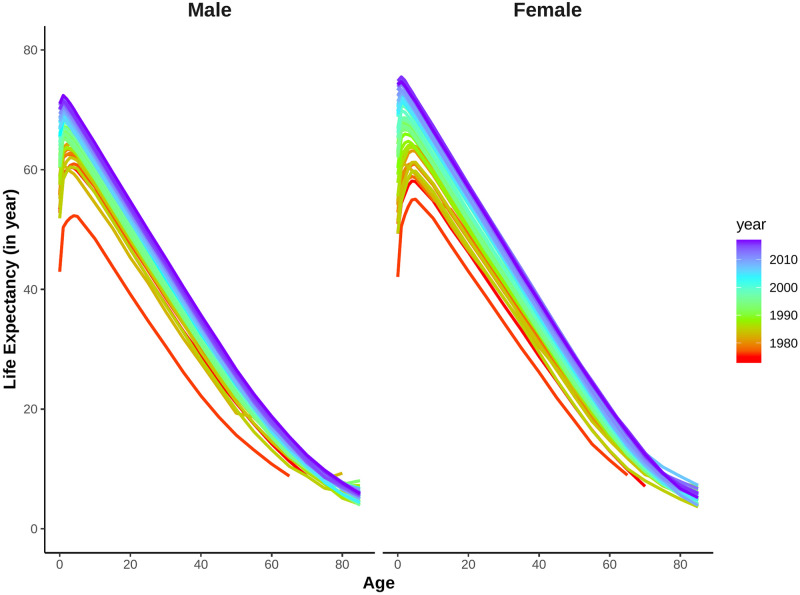
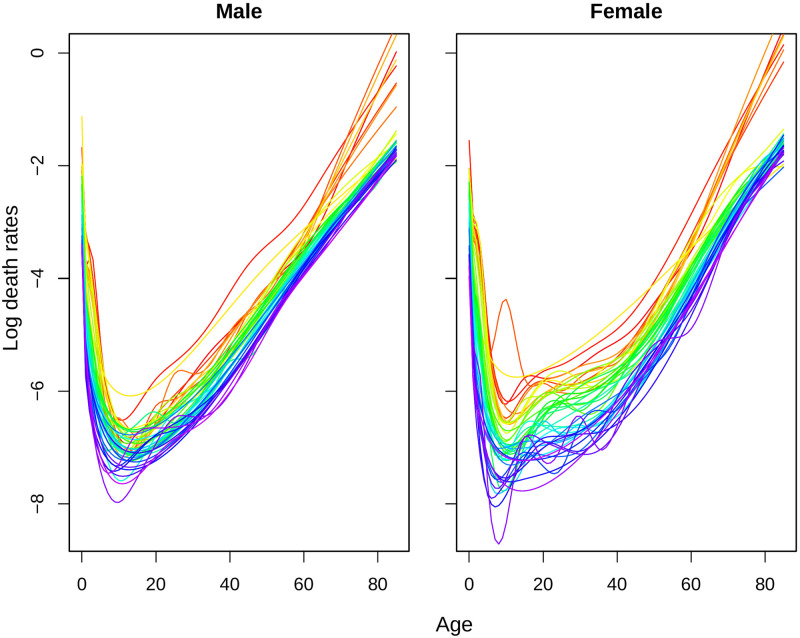
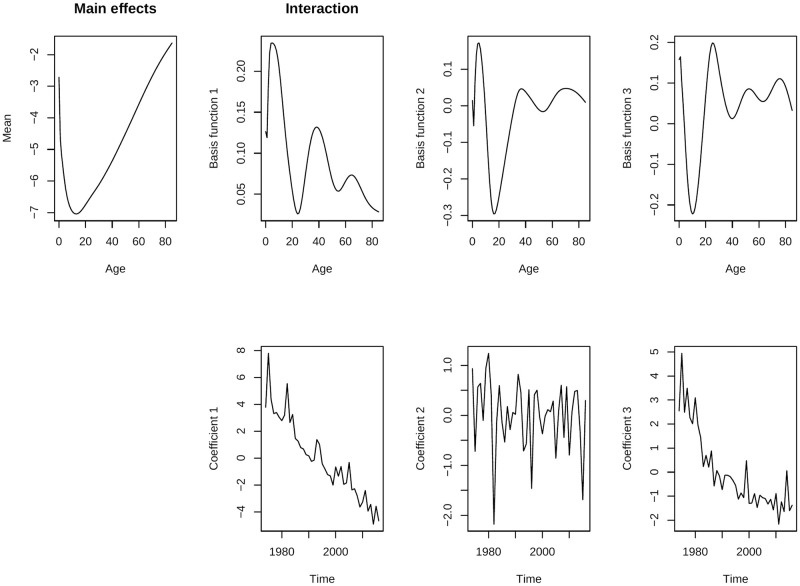
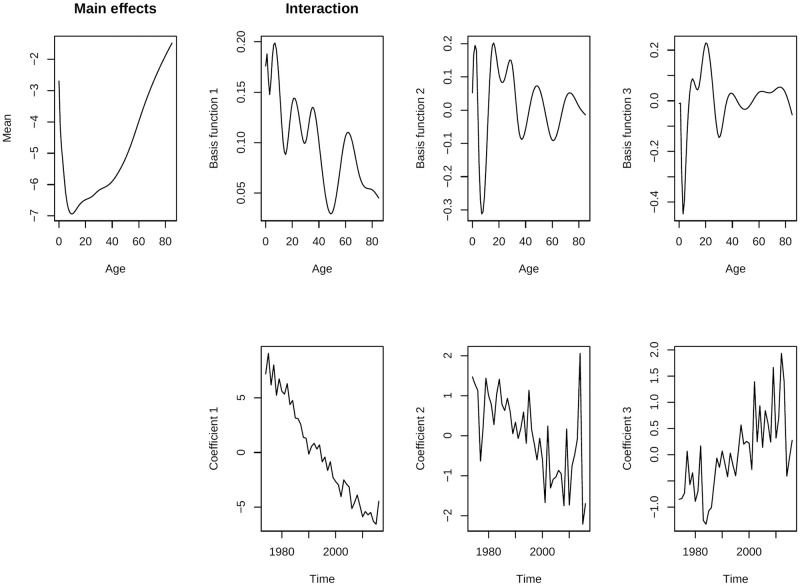
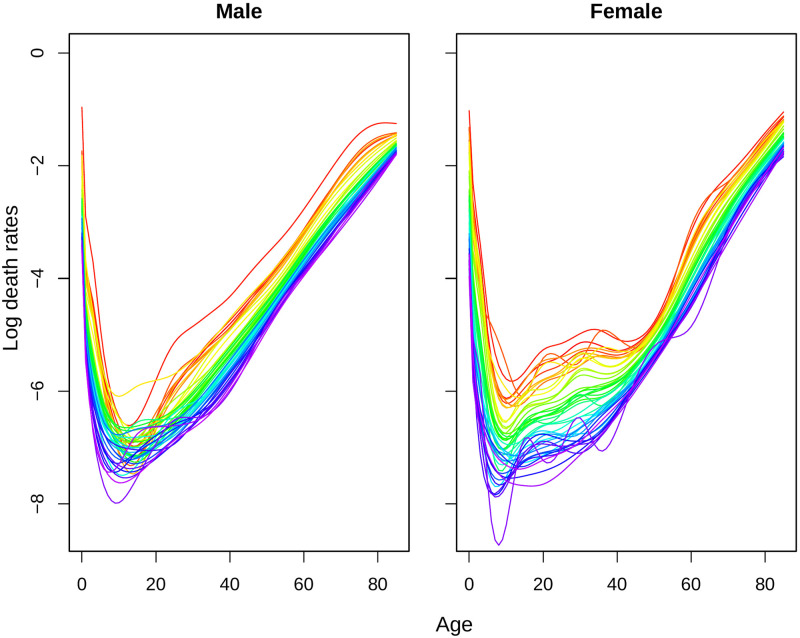
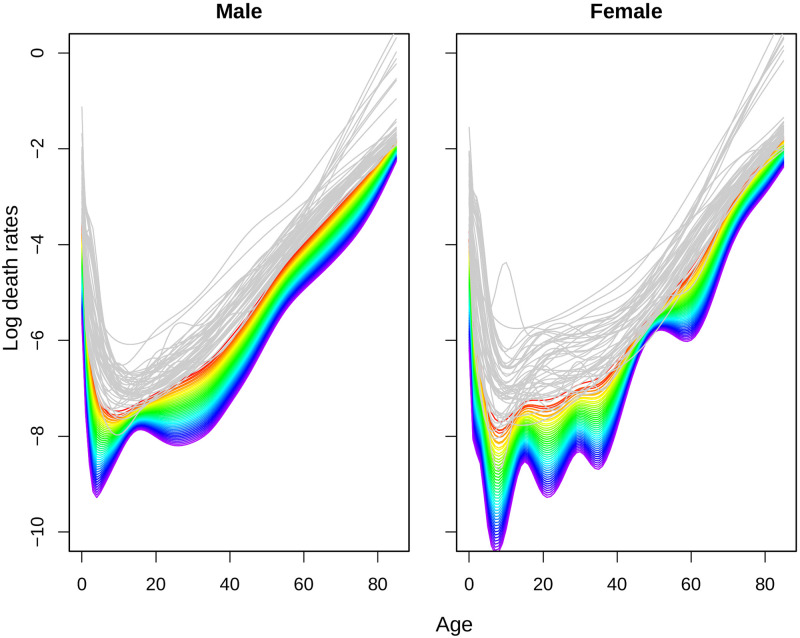
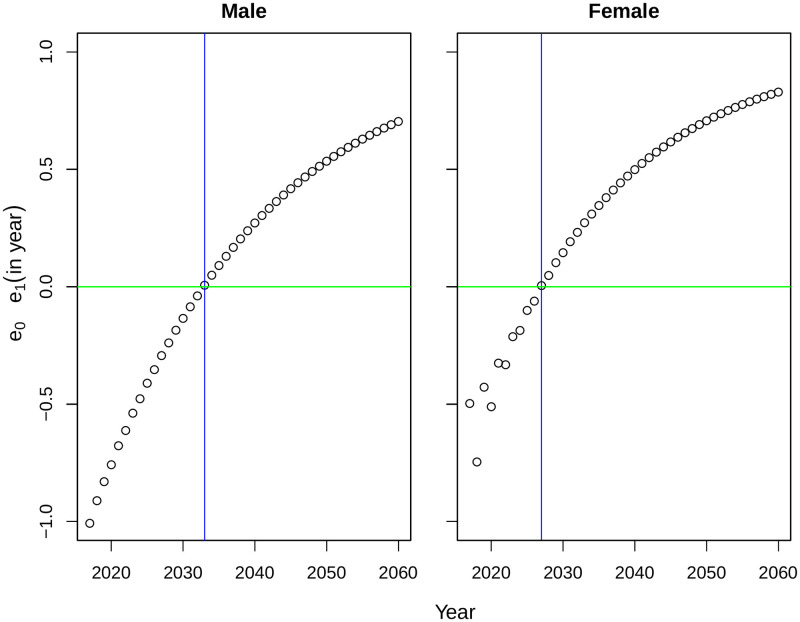
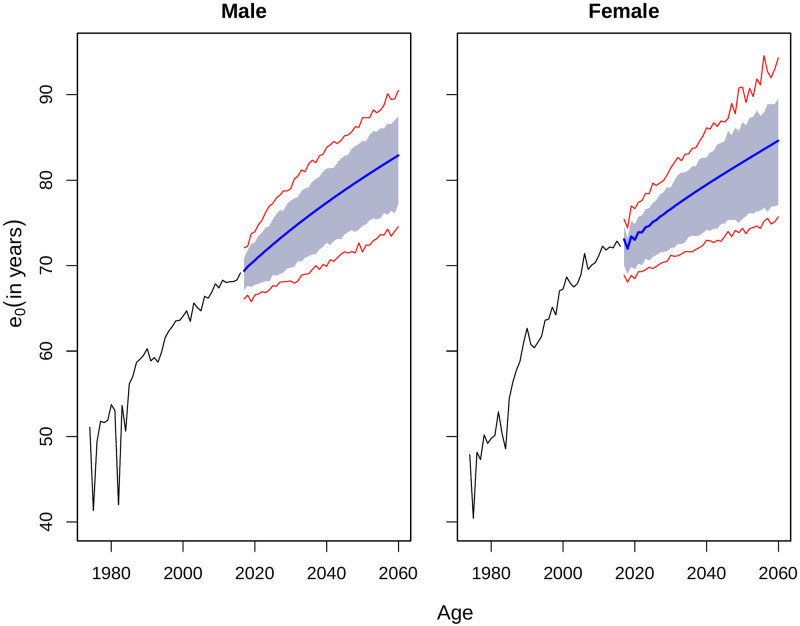
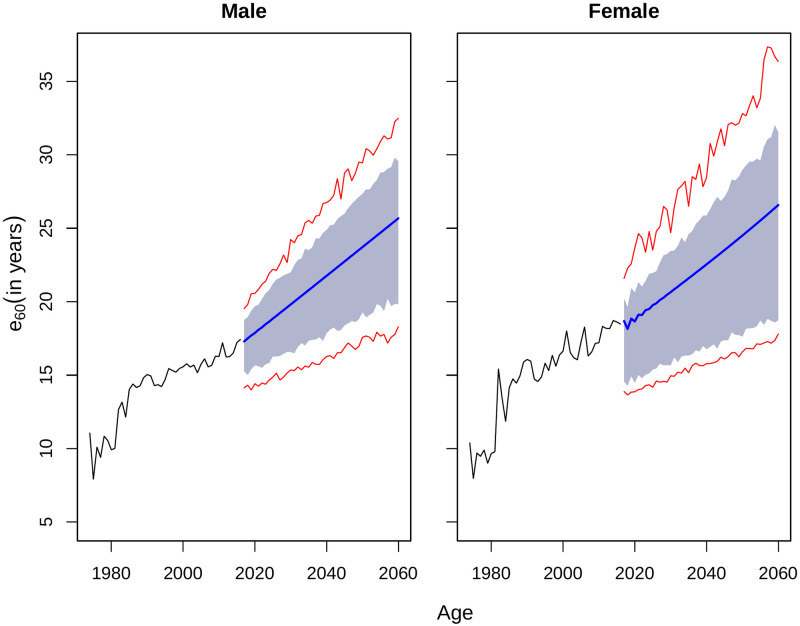
Mortality forecasts are essential part for policymaking in any aging society. In recent years, methods to model and forecast mortality have improved considerably. Among them, Lee-Carter method is one of the most influential method. In this paper, Lee-Carter method is applied to forecast mortality and life expectancy of Bangladesh. A functional data analysis approach is used to decompose the smoothed log-mortality rates in Lee-Carter framework for higher goodness-of-fit of the models and for longer forecast horizons. Bangladesh has been experiencing a mortality transition and has gained life expectancy in last few decades. The fitted model here showed higher pace of mortality decline for women in Bangladesh than that of men. The forecasts showed continuation of mortality improvement in long run and by 2060 life expectancy at birth is expected to reach over 80 years for both sexes in Bangladesh. The study also predicts the effect of reduction in infant mortality on the life expectancy in Bangladesh.
Copyright: © 2022 Fazle Rabbi, Khan. This is an open access article distributed under the terms of the Creative Commons Attribution License, which permits unrestricted use, distribution, and reproduction in any medium, provided the original author and source are credited.
Conflict of interest statement
The authors have declared that no competing interests exist.
Figures
Similar articles
-
A multi-country comparison of stochastic models of breast cancer mortality with P-splines smoothing approach.BMC Med Res Methodol. 2020 Dec 9;20(1):299. doi: 10.1186/s12874-020-01187-5. BMC Med Res Methodol. 2020. PMID: 33297980 Free PMC article.
-
Effect of Excess Mortality on Longevity During the COVID-19 Pandemic in South Asia.J Eval Clin Pract. 2025 Feb;31(1):e14258. doi: 10.1111/jep.14258. J Eval Clin Pract. 2025. PMID: 39699059
-
Modeling and forecasting health expectancy: theoretical framework and application.Demography. 2013 Apr;50(2):673-97. doi: 10.1007/s13524-012-0156-2. Demography. 2013. PMID: 23104206
-
Aging in America in the twenty-first century: demographic forecasts from the MacArthur Foundation Research Network on an Aging Society.Milbank Q. 2009 Dec;87(4):842-62. doi: 10.1111/j.1468-0009.2009.00581.x. Milbank Q. 2009. PMID: 20021588 Free PMC article. Review.
-
Forecasting continuously increasing life expectancy: what implications?Ageing Res Rev. 2012 Apr;11(2):325-8. doi: 10.1016/j.arr.2012.01.002. Epub 2012 Feb 1. Ageing Res Rev. 2012. PMID: 22326652 Review.
Cited by
-
Age-Specific Mortality Forecasting in Kazakhstan: Alternative Approaches to the Lee-Carter Model.Int J Environ Res Public Health. 2025 Feb 26;22(3):346. doi: 10.3390/ijerph22030346. Int J Environ Res Public Health. 2025. PMID: 40238332 Free PMC article.
References
-
- Nigri A, Barbi E, Levantesi S. The relationship between longevity and lifespan variation. Statistical Methods & Applications. 2022;31(3):481–493. doi: 10.1007/s10260-021-00584-4 - DOI
-
- Levantesi S, Nigri A, Piscopo G. Clustering-based simultaneous forecasting of life expectancy time series through long-short term memory neural networks. International Journal of Approximate Reasoning. 2022;140:282–297. doi: 10.1016/j.ijar.2021.10.008 - DOI
-
- Hyndman RJ, Booth H. Stochastic population forecasts using functional data models for mortality, fertility and migration. International Journal of Forecasting. 2008;24(3):323–342. doi: 10.1016/j.ijforecast.2008.02.009 - DOI
MeSH terms
LinkOut - more resources
Full Text Sources
