

Monitoring Internal Training Intensity Correlated with Neuromuscular and Well-Being Status in Croatian Professional Soccer Players during Five Weeks of the Pre-Season Training Phase
- PMID: 36355823
- PMCID: PMC9699058
- DOI: 10.3390/sports10110172
Monitoring Internal Training Intensity Correlated with Neuromuscular and Well-Being Status in Croatian Professional Soccer Players during Five Weeks of the Pre-Season Training Phase
Abstract
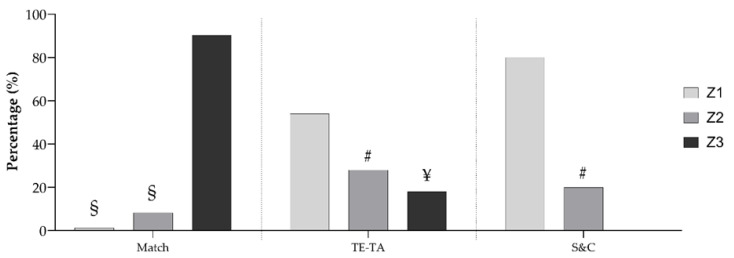
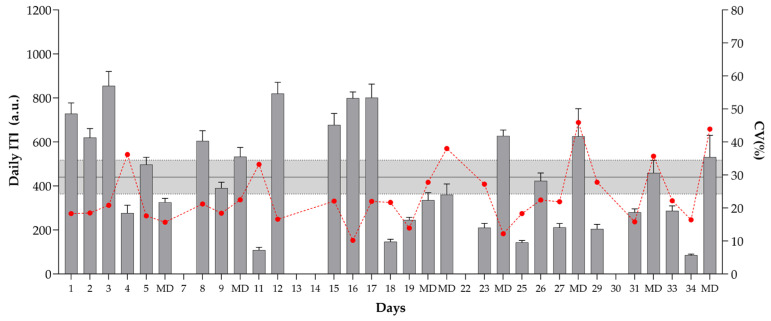
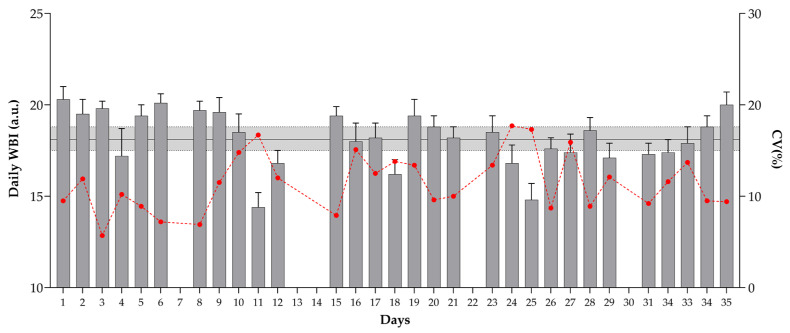
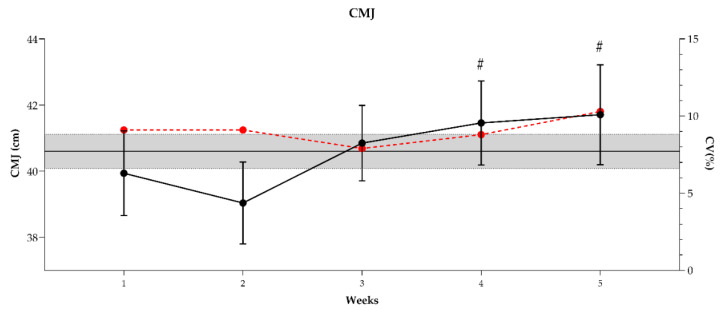
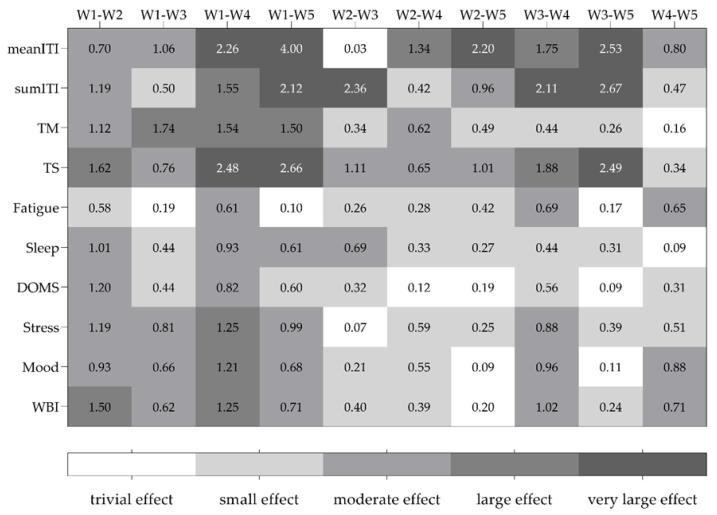
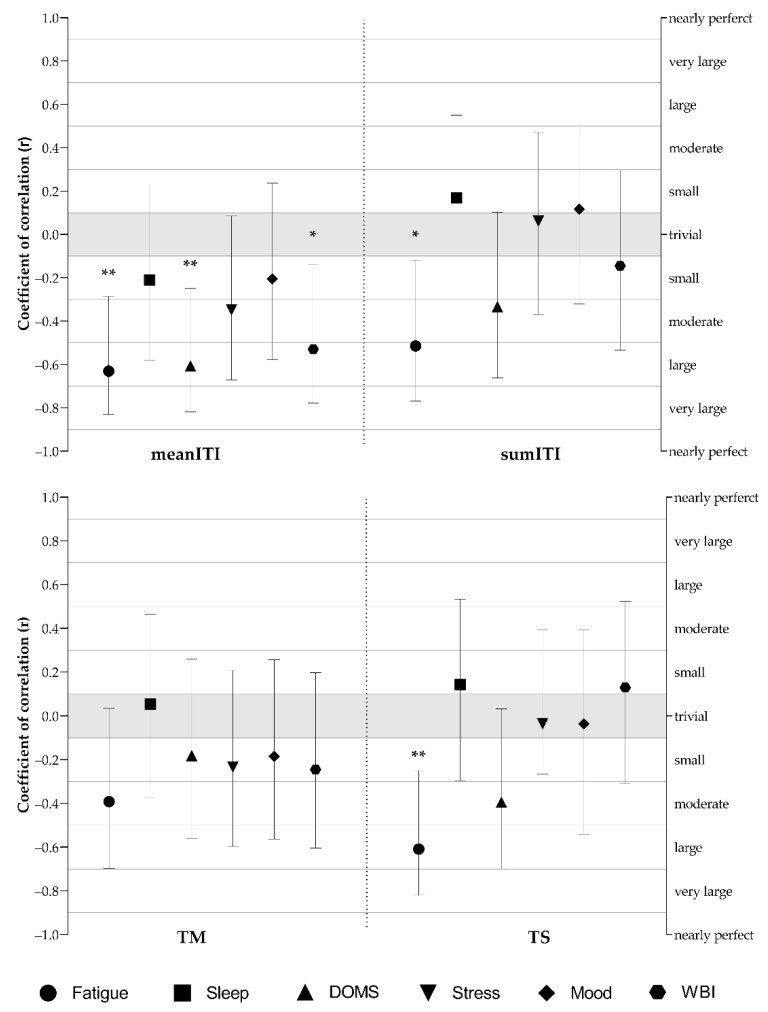
This study aimed to investigate the changes in internal training intensity, well-being, and countermovement jump (CMJ) performance and to determine their relationship across five weeks of the pre-season training phase in professional soccer players. A total of 22 professional male soccer players (age = 21.7 ± 4 years, body height = 185.9 ± 6.3 cm, body weight = 79 ± 6.3 kg, BMI = 22.8 ± 1.4 kg·m−2; VO2max = 52.9 ± 3.2) from the Croatian Second League voluntary participated in this study. The players spent 2230 ± 117 min in 32 technical/tactical and strength/conditioning training sessions, mostly at the low intensity zone (61%), and played 8 friendly matches at a high intensity (>90%). A one-way repeated measure of analysis ANOVA revealed a significant difference between weeks in CMJ performance (F(1,22) = 11.8, p < 0.001), with CMJ height in weeks 4 and 5 being likely to very likely higher than that noted in week 1. Moreover, significant differences between weeks were found in all internal training intensity measures (average [F(1,22) = 74.8, p < 0.001] and accumulated weekly internal training intensity [F(1,22) = 55.4, p < 0.001], training monotony [F(1,22) = 23.9, p < 0.001], and training strain [F(1,22) = 34.5, p < 0.001]). Likewise, differences were observed for wellness status categories (fatigue [F(1,22) = 4.3, p = 0.003], sleep [F(1,22) = 7.1, p < 0.001], DOMS [F(1,22) = 5.7, p < 0.001], stress [F(1,22) = 15.6, p < 0.001]), mood [F(1,22) = 12.7, p < 0.001], and overall well-being status score (F(1,22) = 13.2, p < 0.001). Correlation analysis showed large negative correlations between average weekly internal training intensity and fatigue (r = −0.63, p = 0.002), DOMS (r = −0.61, p = 0.003), and WBI (r = −0.53, p = 0.011). Additionally, fatigue was significantly associated (large negative correlation) with accumulated weekly internal training intensity (r = −0.51, p = 0.014) and training strain (r = −0.61, p = 0.003). Small, but non-significant, correlations were found between CMJ performance and wellness status measures. These findings highlight the utility and simplicity of monitoring tools to improve athletes’ performance.
Keywords: professional soccer; training intensity; well-being.
Conflict of interest statement
The authors declare no conflict of interest.
Figures
Similar articles
-
In-Season Internal Load and Wellness Variations in Professional Women Soccer Players: Comparisons between Playing Positions and Status.Int J Environ Res Public Health. 2021 Dec 5;18(23):12817. doi: 10.3390/ijerph182312817. Int J Environ Res Public Health. 2021. PMID: 34886543 Free PMC article.
-
Effect of pre-season training phase on anthropometric, hormonal and fitness parameters in young soccer players.PLoS One. 2019 Nov 25;14(11):e0225471. doi: 10.1371/journal.pone.0225471. eCollection 2019. PLoS One. 2019. PMID: 31765396 Free PMC article.
-
Relationships between training load, peak height velocity, muscle soreness and fatigue status in elite-level young soccer players: a competition season study.BMC Pediatr. 2023 Feb 3;23(1):55. doi: 10.1186/s12887-023-03869-7. BMC Pediatr. 2023. PMID: 36732715 Free PMC article.
-
The Interplay Between Plasma Hormonal Concentrations, Physical Fitness, Workload and Mood State Changes to Periods of Congested Match Play in Professional Soccer Players.Front Physiol. 2020 Jul 21;11:835. doi: 10.3389/fphys.2020.00835. eCollection 2020. Front Physiol. 2020. PMID: 32792977 Free PMC article.
-
Hematology, Hormones, Inflammation, and Muscle Damage in Elite and Professional Soccer Players: A Systematic Review with Implications for Exercise.Sports Med. 2021 Dec;51(12):2607-2627. doi: 10.1007/s40279-021-01522-w. Epub 2021 Aug 4. Sports Med. 2021. PMID: 34347283
References
-
- Borg G. Perceived Exertion as an Indicator of Somatic Stress—PsycNET. Scand. J. Rehabil. Med. 1970;2:92–98. - PubMed
LinkOut - more resources
Full Text Sources
