

Protein prediction models support widespread post-transcriptional regulation of protein abundance by interacting partners
- PMID: 36356032
- PMCID: PMC9681107
- DOI: 10.1371/journal.pcbi.1010702
Protein prediction models support widespread post-transcriptional regulation of protein abundance by interacting partners
Abstract
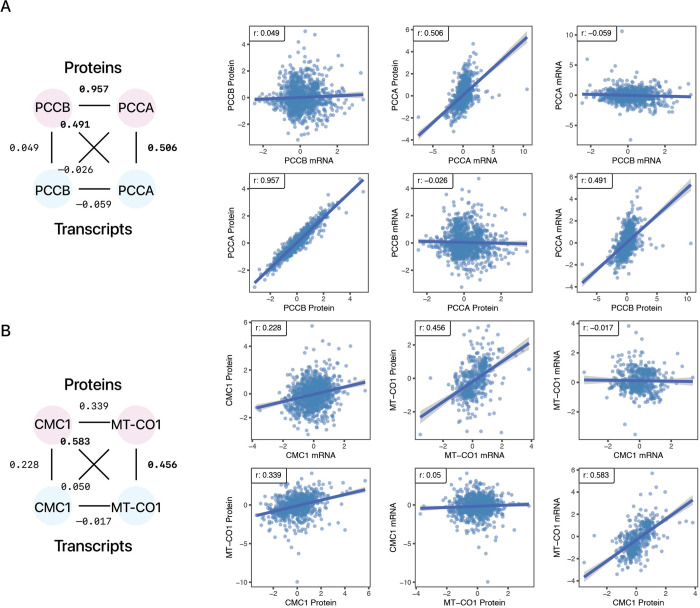
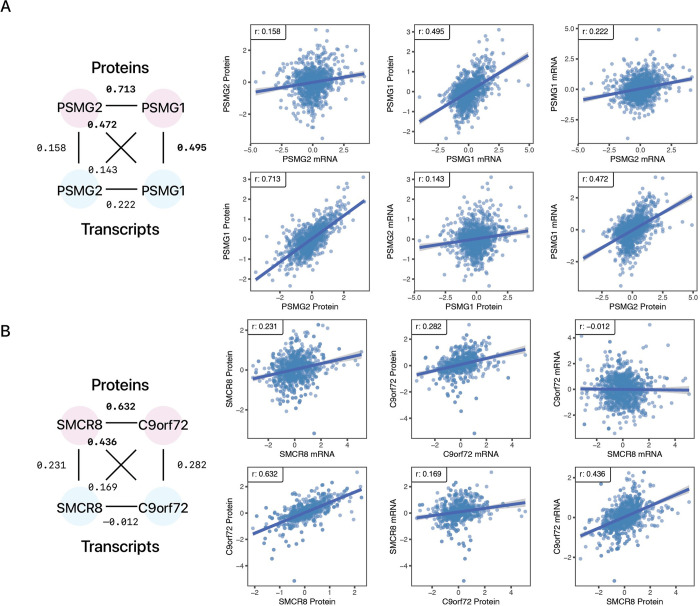
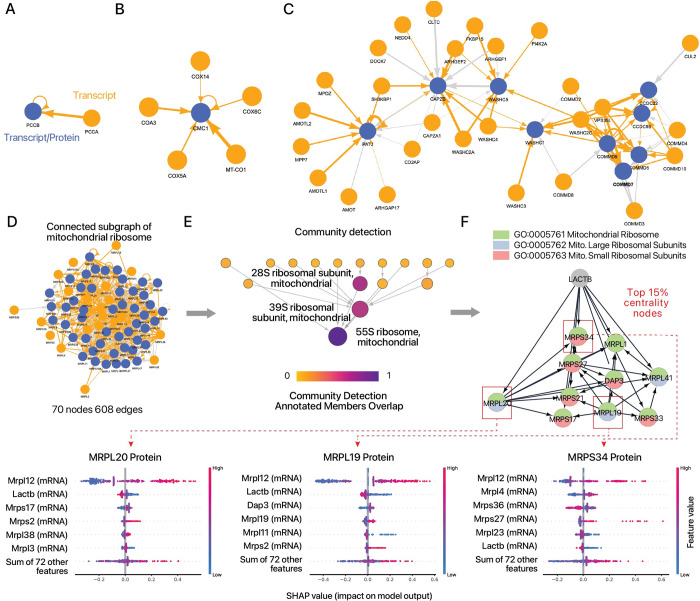
Protein and mRNA levels correlate only moderately. The availability of proteogenomics data sets with protein and transcript measurements from matching samples is providing new opportunities to assess the degree to which protein levels in a system can be predicted from mRNA information. Here we examined the contributions of input features in protein abundance prediction models. Using large proteogenomics data from 8 cancer types within the Clinical Proteomic Tumor Analysis Consortium (CPTAC) data set, we trained models to predict the abundance of over 13,000 proteins using matching transcriptome data from up to 958 tumor or normal adjacent tissue samples each, and compared predictive performances across algorithms, data set sizes, and input features. Over one-third of proteins (4,648) showed relatively poor predictability (elastic net r ≤ 0.3) from their cognate transcripts. Moreover, we found widespread occurrences where the abundance of a protein is considerably less well explained by its own cognate transcript level than that of one or more trans locus transcripts. The incorporation of additional trans-locus transcript abundance data as input features increasingly improved the ability to predict sample protein abundance. Transcripts that contribute to non-cognate protein abundance primarily involve those encoding known or predicted interaction partners of the protein of interest, including not only large multi-protein complexes as previously shown, but also small stable complexes in the proteome with only one or few stable interacting partners. Network analysis further shows a complex proteome-wide interdependency of protein abundance on the transcript levels of multiple interacting partners. The predictive model analysis here therefore supports that protein-protein interaction including in small protein complexes exert post-transcriptional influence on proteome compositions more broadly than previously recognized. Moreover, the results suggest mRNA and protein co-expression analysis may have utility for finding gene interactions and predicting expression changes in biological systems.
Copyright: © 2022 Srivastava et al. This is an open access article distributed under the terms of the Creative Commons Attribution License, which permits unrestricted use, distribution, and reproduction in any medium, provided the original author and source are credited.
Conflict of interest statement
The authors have declared that no competing interests exist.
Figures


Similar articles
-
Challenges in proteogenomics: a comparison of analysis methods with the case study of the DREAM proteogenomics sub-challenge.BMC Bioinformatics. 2019 Dec 20;20(Suppl 24):669. doi: 10.1186/s12859-019-3253-z. BMC Bioinformatics. 2019. PMID: 31861998 Free PMC article.
-
Workability of mRNA Sequencing for Predicting Protein Abundance.Genes (Basel). 2023 Nov 11;14(11):2065. doi: 10.3390/genes14112065. Genes (Basel). 2023. PMID: 38003008 Free PMC article. Review.
-
A deep proteome and transcriptome abundance atlas of 29 healthy human tissues.Mol Syst Biol. 2019 Feb 18;15(2):e8503. doi: 10.15252/msb.20188503. Mol Syst Biol. 2019. PMID: 30777892 Free PMC article.
-
Joint learning improves protein abundance prediction in cancers.BMC Biol. 2019 Dec 23;17(1):107. doi: 10.1186/s12915-019-0730-9. BMC Biol. 2019. PMID: 31870366 Free PMC article.
-
Insights into the regulation of protein abundance from proteomic and transcriptomic analyses.Nat Rev Genet. 2012 Mar 13;13(4):227-32. doi: 10.1038/nrg3185. Nat Rev Genet. 2012. PMID: 22411467 Free PMC article. Review.
Cited by
-
Proteome-wide copy-number estimation from transcriptomics.Mol Syst Biol. 2024 Nov;20(11):1230-1256. doi: 10.1038/s44320-024-00064-3. Epub 2024 Sep 27. Mol Syst Biol. 2024. PMID: 39333715 Free PMC article.
-
Proteomics applications in next generation induced pluripotent stem cell models.Expert Rev Proteomics. 2024 Apr;21(4):217-228. doi: 10.1080/14789450.2024.2334033. Epub 2024 Mar 27. Expert Rev Proteomics. 2024. PMID: 38511670 Free PMC article. Review.
-
An Extensive Atlas of Proteome and Phosphoproteome Turnover Across Mouse Tissues and Brain Regions.bioRxiv [Preprint]. 2024 Oct 17:2024.10.15.618303. doi: 10.1101/2024.10.15.618303. bioRxiv. 2024. Update in: Cell. 2025 Apr 17;188(8):2267-2287.e21. doi: 10.1016/j.cell.2025.02.021. PMID: 39464138 Free PMC article. Updated. Preprint.
-
Solid stress compression enhances breast cancer cell migration through the upregulation of Interleukin-6.Front Cell Dev Biol. 2025 Apr 30;13:1541953. doi: 10.3389/fcell.2025.1541953. eCollection 2025. Front Cell Dev Biol. 2025. PMID: 40371393 Free PMC article.
-
Turnover atlas of proteome and phosphoproteome across mouse tissues and brain regions.Cell. 2025 Apr 17;188(8):2267-2287.e21. doi: 10.1016/j.cell.2025.02.021. Epub 2025 Mar 20. Cell. 2025. PMID: 40118046
References
Publication types
MeSH terms
Substances
Grants and funding
LinkOut - more resources
Full Text Sources
Miscellaneous
