. 2023 Feb 23;141(8):917-929.
doi: 10.1182/blood.2022016846.

Secreted mutant calreticulins as rogue cytokines in myeloproliferative neoplasms

Affiliations

Secreted mutant calreticulins as rogue cytokines in myeloproliferative neoplasms

Christian Pecquet et al. Blood. .

Abstract

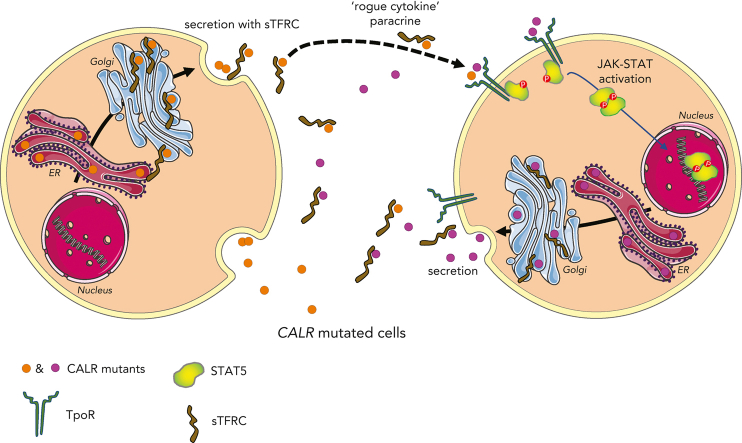
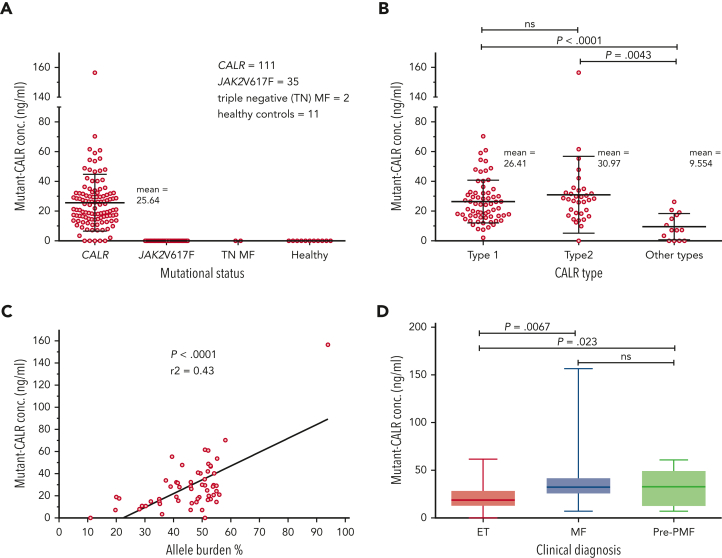
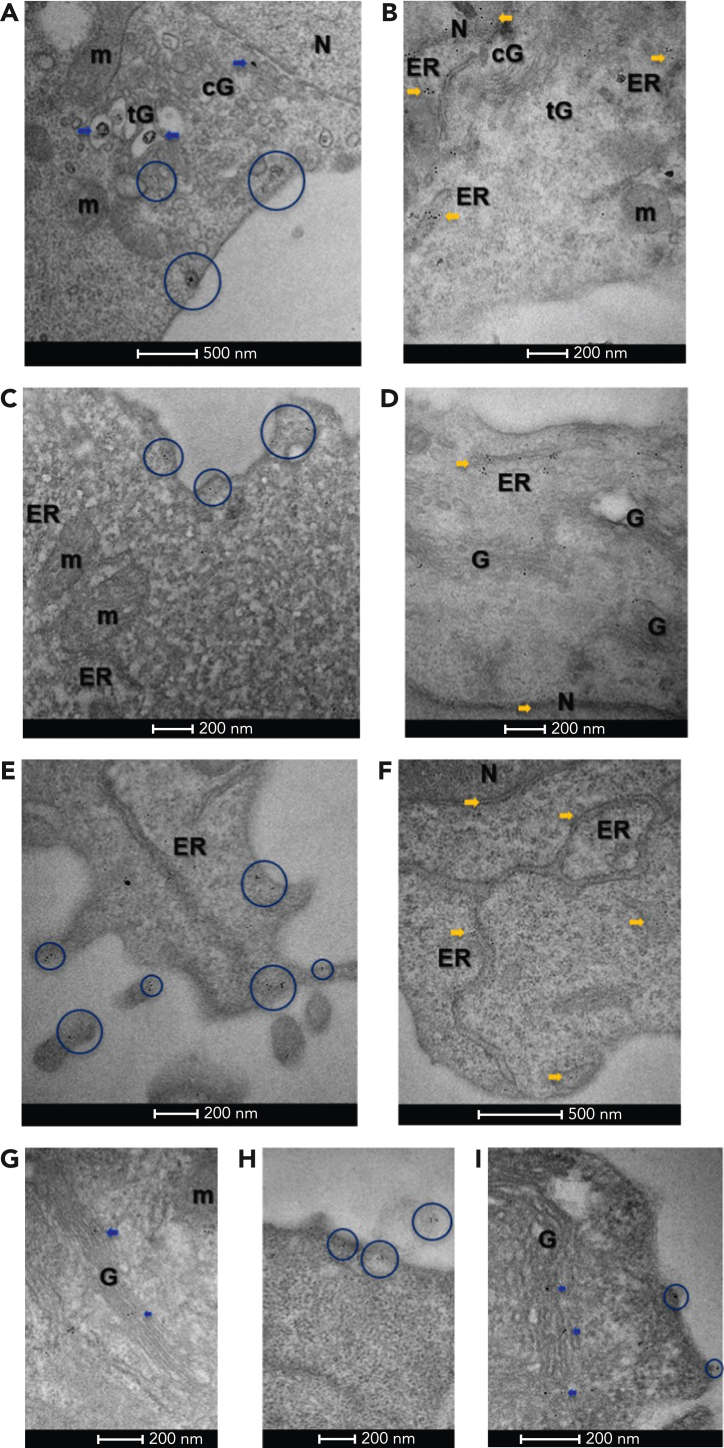
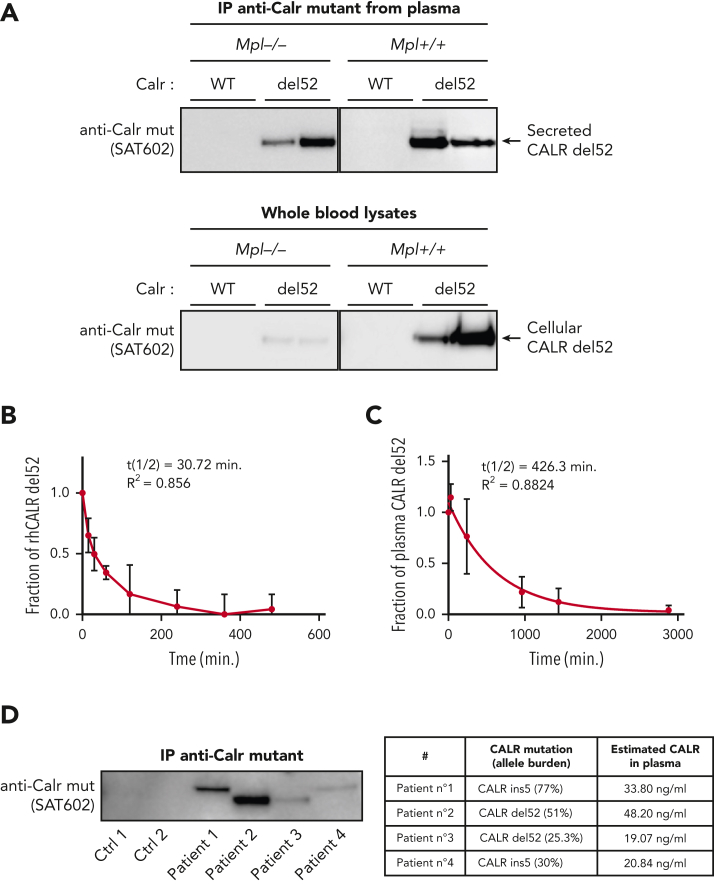
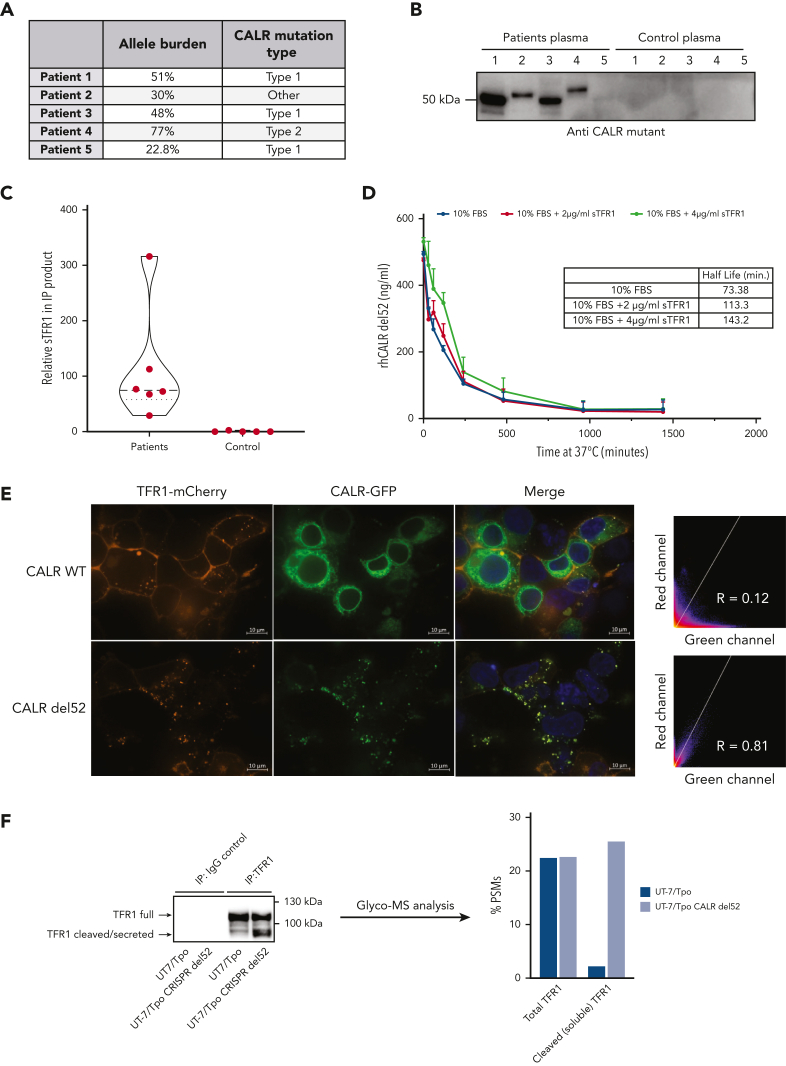
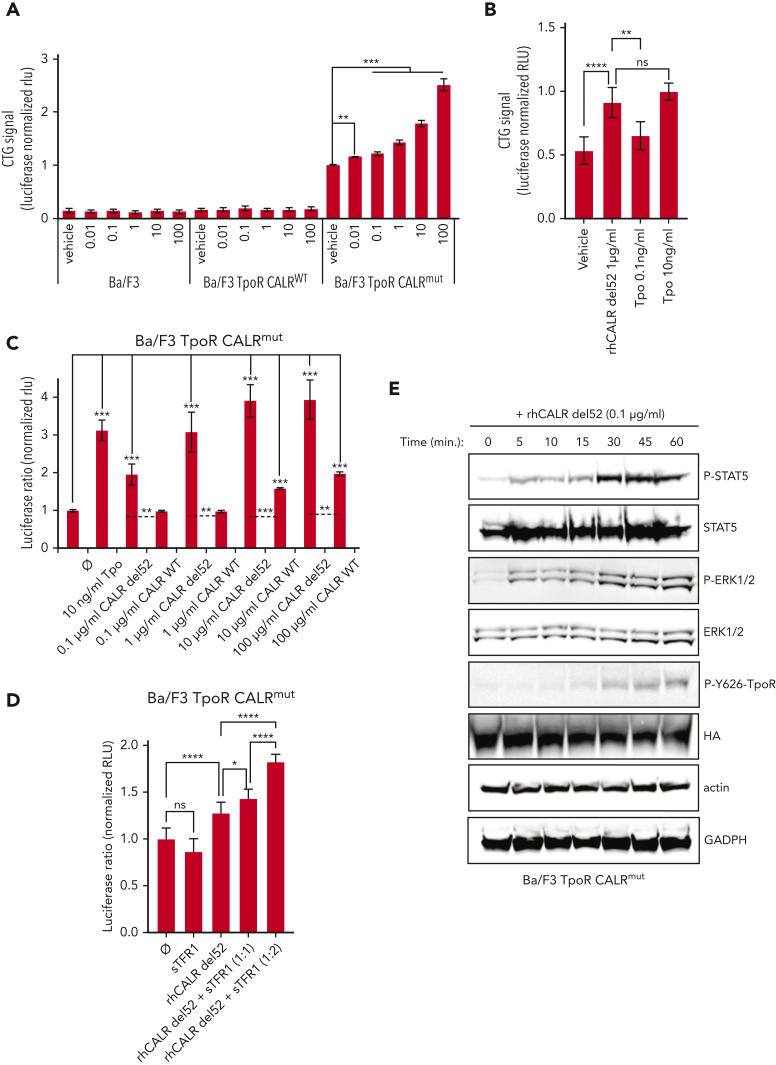
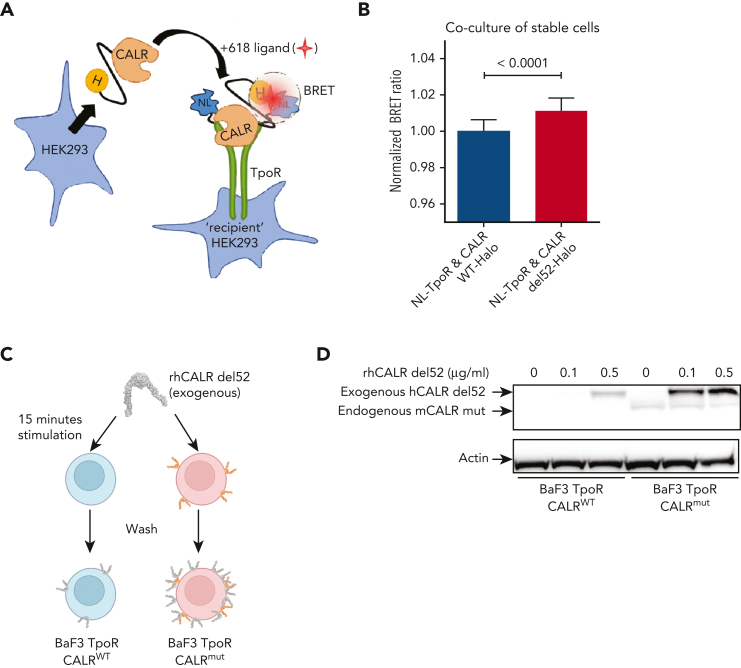
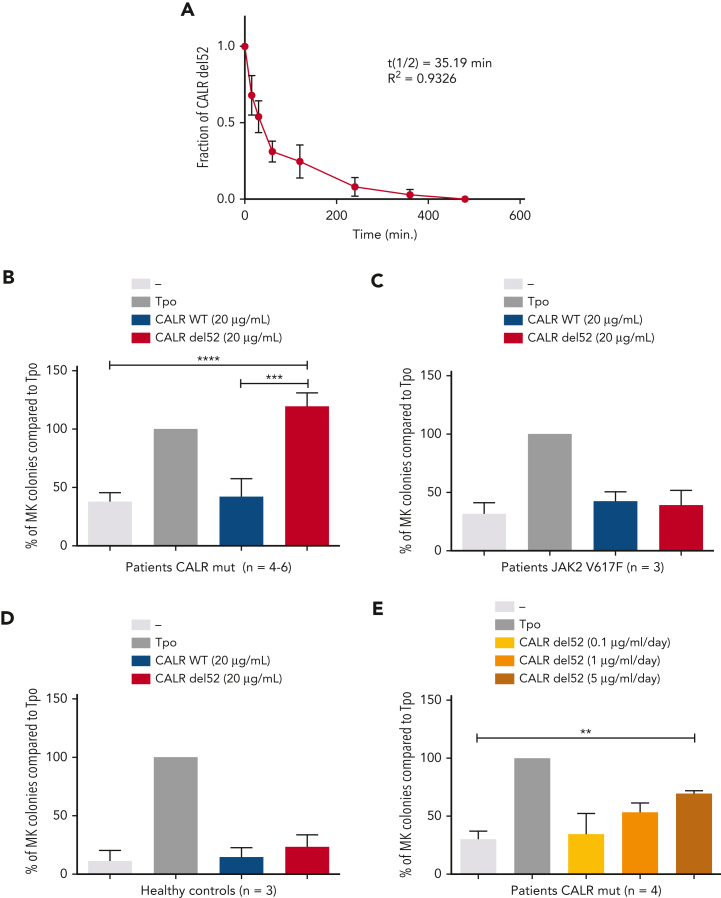
Mutant calreticulin (CALR) proteins resulting from a -1/+2 frameshifting mutation of the CALR exon 9 carry a novel C-terminal amino acid sequence and drive the development of myeloproliferative neoplasms (MPNs). Mutant CALRs were shown to interact with and activate the thrombopoietin receptor (TpoR/MPL) in the same cell. We report that mutant CALR proteins are secreted and can be found in patient plasma at levels up to 160 ng/mL, with a mean of 25.64 ng/mL. Plasma mutant CALR is found in complex with soluble transferrin receptor 1 (sTFR1) that acts as a carrier protein and increases mutant CALR half-life. Recombinant mutant CALR proteins bound and activated the TpoR in cell lines and primary megakaryocytic progenitors from patients with mutated CALR in which they drive thrombopoietin-independent colony formation. Importantly, the CALR-sTFR1 complex remains functional for TpoR activation. By bioluminescence resonance energy transfer assay, we show that mutant CALR proteins produced in 1 cell can specifically interact in trans with the TpoR on a target cell. In comparison with cells that only carry TpoR, cells that carry both TpoR and mutant CALR are hypersensitive to exogenous mutant CALR proteins and respond to levels of mutant CALR proteins similar to those in patient plasma. This is consistent with CALR-mutated cells that expose TpoR carrying immature N-linked sugars at the cell surface. Thus, secreted mutant CALR proteins will act more specifically on the MPN clone. In conclusion, a chaperone, CALR, can turn into a rogue cytokine through somatic mutation of its encoding gene.


Conflict of interest statement

Conflict-of-interest disclosure: R.K. and S.N.C. and are cofounders of MyeloPro GmbH. The remaining authors declare no competing financial interests.

Figures

None
Graphical abstract
Figure 1.
Figure 1.
Quantification of mutant CALR in plasma from patients with MPN and correlation of protein levels to the disease state. (A) Quantification of free mutant CALR proteins in the plasma from patients with MPN, separated by their mutational status, and assayed by ELISA. Red bars represent mean ± standard deviation (SD). (B) The same ELISA results for patients with mutated CALR as shown in panel A, separated according to their mutation type. Red bars represent mean ± SD. (C) XY plot of the allele burden of each patient by their level of free plasmatic mutant CALR. A linear regression was applied and shows a statistically significant correlation between the 2 parameters. (D) The same ELISA results for patients with mutated CALR as shown in panel A, represented as a box and whisker plot, arranged according to patient disease status. All statistical analysis (using the Prism6 software) were performed by the unpaired t test. conc., concentration; MF, myelofibrosis; ns, not significant; TN, triple-negative.
Figure 2.
Figure 2.
Immuno-electron microscopy of CALR. (A) In BaF3 cells, Flag-tagged CALR-del52 localized in both the cis-Golgi (cG) and trans-Golgi (tG) compartments (blue arrows), as well as vesicles distributed between the trans-Golgi network and the plasma membrane (blue circles), suggesting it follows the secretory pathway to the cell surface. (B) By contrast, Flag-tagged CALR WT predominantly localized in the ER and nuclear heterochromatin (yellow arrows) and was less frequent in the Golgi network (cG, tG). (C) In cytokine-independent, proliferating clustered regularly interspaced short palindromic repeats (CRISPR)-modified BaF3 TpoR Calrmut cells, which expressed both CALR-del52 as well as endogenous CALR, anti–N-terminus labeling was frequently observed at the plasma membrane (blue circles), suggesting CALR secretion is maintained in this cell line. (D) In control CRISPR BaF3 TpoR Calrwt cells, endogenous CALR localized mostly in the nucleus (N), perinuclear space, ER (yellow arrows), and the Golgi (G) network. (E) In primary Calr del52/WT KI mouse bone marrow cells, N-terminus–labeled CALR could be detected within the Golgi network (not shown), as well as at the plasma membrane (blue circles), suggesting secretion of CALR is maintained in these cells. (F) In control CalrWT/WT mouse bone marrow cells, endogenous CALR was mostly localized at the ER and the nucleus (N). When using a mutant-specific anti-CALR antibody labeling could be detected in the Golgi network of CRISPR-modified BaF3 TpoR Calrmut cells (G) (blue arrows) but also at the plasma membrane (H), including associated with ectosomes (blue circles). (I) Similarly, the mutant-specific antibody identified CALR-del52 in the secretory pathway of Calrdel52/WT KI mouse bone marrow cells (blue arrows and circles). Gold particle size is on average 0.8 nm in panel A and 6 or 10 nm in panels B to I. Scale bars represent 500 nm (A,F) and 200 nm (B-E,G-I). m, mitochondria.
Figure 3.
Figure 3.
Secretion and stability of plasma CALR-del52 from Calr-del52/WT KI mouse and patients with MPN. (A) Immunoprecipitation (IP) of murine plasma CALR-del52 and whole-blood lysates. Secretion rate of CALR-del52 was evaluated by comparing the cellular and plasmatic CALR-del52 levels from blood of KI-Calrdel52/WT mice expressing or not expressing TpoR. (B) Stability study of mutant CALR in plasma from patients with MPN harboring mutated CALR-del52. Samples (n = 8) from patients with MPN harboring mutated CALR-del52 maintained at 37°C for various time points were measured in duplicate by ELISA and analyzed using a 1-phase decay model (Prism6) to determine the averaged half-life (t½) and the coefficient of determination (R2). Error bars represent SDs. (C) Stability study of rhCALR-del52 in culture medium in absence of fetal bovine serum. A fixed amount of rhCALR-del52 was incubated in culture medium at 37°C for various lengths of time before measurement by ELISA analysis using a 1-phase decay model (Prism6) to determine the averaged half-life and R2. Error bars represent SDs. (D) CALR mutant proteins after immunoprecipitation in various MPN patients (left) and CALR mutant proteins quantification by western blotting (optical density) of the same patients (right). Ctrl, control; mut, mutant.
Figure 4.
Figure 4.
sTFR1 is a carrier protein for mutant CALR. (A) Allele burden and mutation profile of patients included in this study the analysis. (B) Identification of partners of plasmatic mutant CALR. Plasma from 5 patients with mutated CALR and 5 healthy controls was isolated by IP with biotinylated antimutant CALR antibody. Immunoblot shows the presence of mutant CALR in the IP product detected with a different antimutant CALR antibody. The IP product was analyzed by nontargeted MS to identify interacting partners. (C) Truncated violin plot of relative sTFR1 amount found coimmunoprecipitating with plasma CALR-del52. Negative control corresponds to the IP product after anti–mutant CALR IP to control for nonspecific binding to anti–mutant CALR antibody. (D) Stability study of rhCALR-del52 in medium with 10% fetal bovine serum (FBS), with or without addition of 2 or 4 μg/mL of rhTFRC. rhCALR-del52 mutant in different media was maintained at 37°C for various lengths of time and measured by ELISA before analysis using a 1-phase decay model (Prism6) to determine the averaged half-life. Values represent mean of triplicate ± SD. (E) Representative confocal microscopy pictures of HEK293T cotransfected with either CALR WT or CALR-del52 fused to green fluorescent protein at the C-terminus and TFR1 fused to mCherry at its C-terminus. Scale bars represent 10 μm. Microscopy analysis shows colocalization between CALR-del52 and TFR1 in subcellular compartments with high correlation between the 2 constructs. (F) IP and glycosylation profile analysis of endogenous TFR1 from UT-7/Tpo or UT-7/Tpo CRISPR CALR-del52. Western blot shows the TFR1 forms analyzed by MS. Data represent the percentage of peptide-spectrum match of immature N-glycans (high mannose) present on residue Asn251 in the cleaved or full form of TFR1.
Figure 5.
Figure 5.
Exogenous CALR-del52 is inducing cell growth and JAK/STAT signaling in BaF3 cells expressing TpoR and mutant CALR. (A) Short-term proliferation of parental BaF3 and stable BaF3 cells expressing the indicated constructs were analyzed after daily exposition of the indicated doses of rhCALR-del52 over 72 hours with CTG assay (Promega). Values shown represent the average of 5 experiments with at least 29 biological replicates ± standard error of the mean (SEM). (B) Short-term proliferation of BaF3 TpoR CALRmut cells was analyzed after daily exposition of 1 μg/mL of rhCALR-del52, 0.1 ng/mL of Tpo, or 10 ng/mL of Tpo over 72 hours with CTG assay (Promega). Average ± SD of 6 replicates. (A-B). Statistical analysis (Jmp pro14) was performed by the nonparametric multiple comparisons Steel test with a control group (vehicle). ∗∗∗∗P < .0001, ∗∗∗P < .001, ∗∗P < .01. (C) BaF3 TpoR Calrmut cells were transiently transfected with the Spi-Luc luciferase STAT5 reporter and the internal control pRL-TK used for normalization. The cells were cultured with different concentrations of recombinant human CALR-del52 or CALR WT over 24 hours before performing a Dual-Luciferase assay (Promega) for STAT5 transcriptional activity. (D) BaF3 TpoR Calrmut cells transfected with Spi-Luc and pRL-TK were treated for 24 hours with vehicle or 1 μg/mL of rhCALR-del52 and indicated molar rations of rhTFRC and STAT5 transcriptional activity was measured by Dual-Luciferase assay. (C-D) Luciferase activity was normalized to vehicle condition (⌀). Values shown represent the average of 6 to 12 biological replicates ± SEM. Statistical analysis (Jmp pro14) was performed by the nonparametric multiple comparisons Steel test with a control group (⌀). ∗∗∗P < .001, ∗∗P < .01, ∗P < .05. Statistical analysis of 2 specific conditions (see dashed lines) were performed by the unpaired t test. (E) Western blots showing time-dependent phosphorylation of TpoR, STAT5, and extracellular signal-regulated kinase 1/2 (ERK1/2) in BaF3 TpoR Calrmut cells treated or not treated with 0.1 μg/mL rhCALR-del52 for various lengths of time (5, 10, 15, 30, 45, and 60 minutes). P-Y626-TpoR denotes phosphorylation of tyrosine residue 112 of the intracellular chain of TpoR. HA denotes detection of total HA-tagged TpoR. GAPDH, glyceraldehyde-3-phosphate dehydrogenase; HA, hemagglutinin (tag).
Figure 6.
Figure 6.
Binding of soluble mutant CALR proteins to TpoR at the cell surface. (A) Cartoon representation of our exogenous CALR, cell coculture NanoBRET setup. HaloTag (H) is fused to the C-terminal of CALR, nano-luciferase (NL) is fused to the N-terminal of TpoR, and 618-ligand is a fluorescent molecule with very high affinity for HaloTag. The circle represents a bioluminescence resonance energy transfer (BRET) phenomenon that occurs only when the energy donor (NL) is within 10 nm of the energy acceptor (618-ligand). (B) BRET detection between CALR-HaloTag and cell-surface nano-luciferase-TpoR in a stable cell coculture assay. HEK293 cells stably expressing either CALR WT or del52-HaloTag were cocultivated overnight in presence of 618-ligand with HEK293 cells stably expressing NL-TpoR. Data from 3 independent experiments were pooled and values were normalized to the NL-TpoR and CALR WT-Halo condition. Statistical analysis (Jmp pro14) was performed by a 2-tailed student t test and aforementioned P values. (C) Cartoon representation of our assay to measure binding of rhCALR-del52 to BaF3 TpoR CalrWT and BaF3 TpoR Calrmut cells. Cells were incubated for 15 minutes with varying amounts of rhCALR-del52 before extensive washing. (D) Western blotting showing the presence of rhCALR-del52 bound to BaF3 TpoR CalrWT and BaF3 TpoR Calrmut cells after 15 minutes incubation with different concentration of rhCALR-del52.
Figure 7.
Figure 7.
Induction of differentiation of MK progenitors by CALR-del52. (A) Stability study of rhCALR-del52 colony-forming unit MK culture medium. Six samples maintained at 37°C for various lengths of time were measured in duplicate by ELISA and analyzed using a 1-phase decay model (Prism6) to determine the averaged half-life and R2. Error bars represent SDs. CD34+CD41+ progenitors from 4 to 6 patients with mutated CALR (B), 3 patients with JAK2 V617F (B), and 3 normal controls (C) were sorted and cloned at 1 cell per well in 96-well plates in serum-free medium containing SCF and treated with a single, large dose of CALR-del52. Percentages of MK colonies were calculated compared with the Tpo condition. Results are shown as mean ± SEM. ∗∗∗∗P < .0001, ∗∗∗P < .001. One-way analysis of variance, Holm-Sidak multiple comparisons test. (D) Effect of daily treatment of CALR-del52 (0.1, 1, or 5 μg/mL) on MK colony formation. CD34+CD41+ progenitors from 4 patients with mutated CALR were tested and the percentages of MK colonies were calculated compared with the Tpo condition. Results are shown as mean ± SEM. ∗∗P < .01. One-way analysis of variance, Holm-Sidak multiple comparisons test.

Comment in

  • CALR goes rogue.
    Melo-Cardenas J, Crispino JD. Melo-Cardenas J, et al. Blood. 2023 Feb 23;141(8):818-820. doi: 10.1182/blood.2022018788. Blood. 2023. PMID: 36821187 No abstract available.

References

    1. Nangalia J, Massie CE, Baxter EJ, et al. Somatic CALR mutations in myeloproliferative neoplasms with nonmutated JAK2. N Engl J Med. 2013;369(25):2391–2405. - PMC - PubMed
    1. Klampfl T, Gisslinger H, Harutyunyan AS, et al. Somatic mutations of calreticulin in myeloproliferative neoplasms. N Engl J Med. 2013;369(25):2379–2390. - PubMed
    1. Michalak M, Groenendyk J, Szabo E, Gold LI, Opas M. Calreticulin, a multi-process calcium-buffering chaperone of the endoplasmic reticulum. Biochem J. 2009;417(3):651–666. - PubMed
    1. Chachoua I, Pecquet C, El-Khoury M, et al. Thrombopoietin receptor activation by myeloproliferative neoplasm associated calreticulin mutants. Blood. 2016;127(10):1325–1335. - PubMed
    1. Nivarthi H, Chen D, Cleary C, et al. Thrombopoietin receptor is required for the oncogenic function of CALR mutants. Leukemia. 2016;30(8):1759–1763. - PMC - PubMed