. 2023 Mar 2;141(9):1070-1086.
doi: 10.1182/blood.2022017262.

A novel RIPK1 inhibitor reduces GVHD in mice via a nonimmunosuppressive mechanism that restores intestinal homeostasis

Affiliations

A novel RIPK1 inhibitor reduces GVHD in mice via a nonimmunosuppressive mechanism that restores intestinal homeostasis

Xiaoliang Yu et al. Blood. .

Abstract

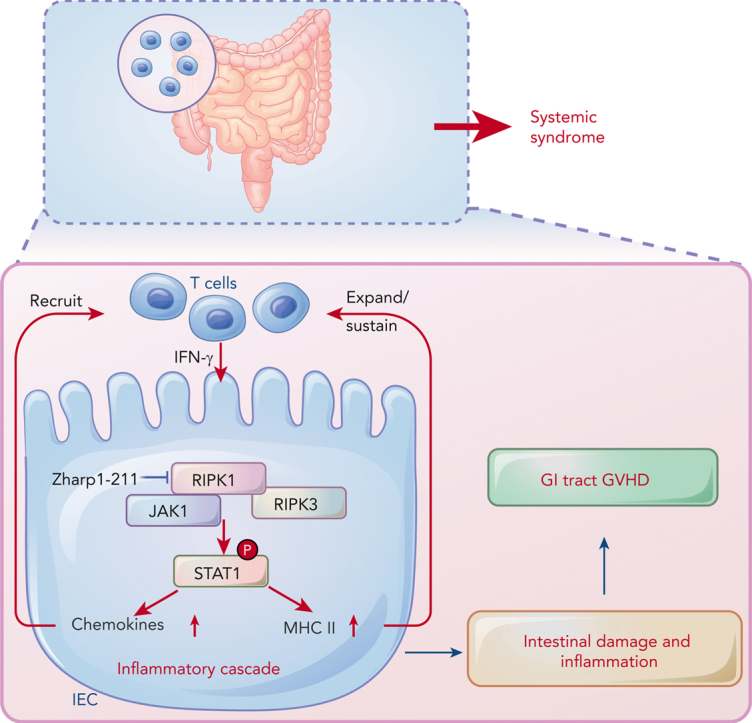
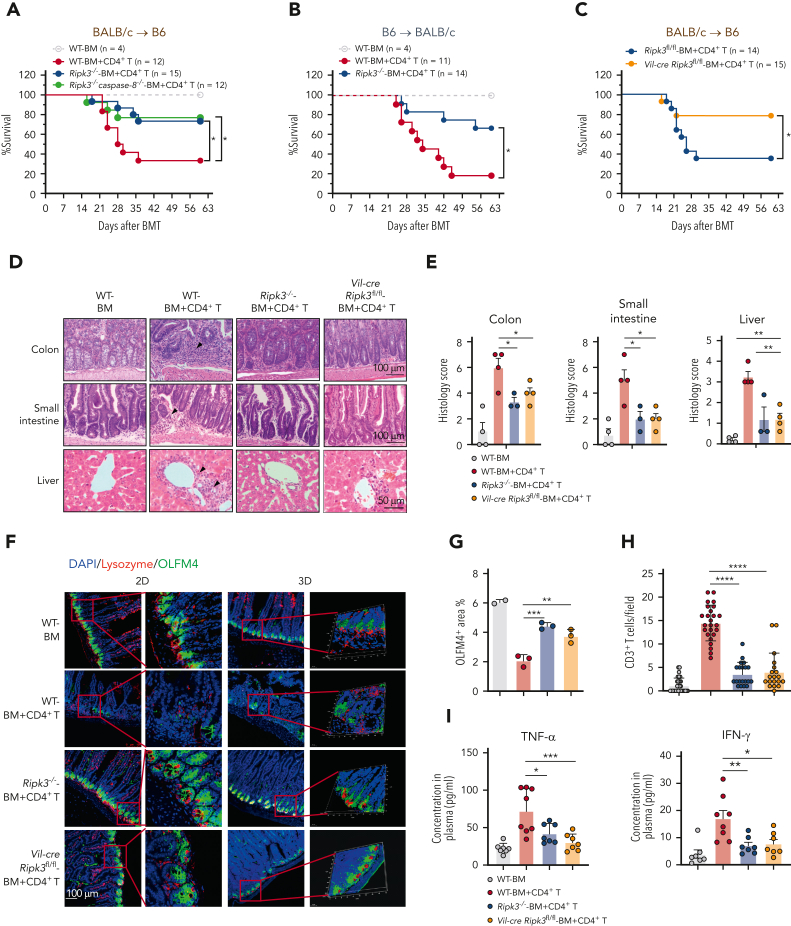
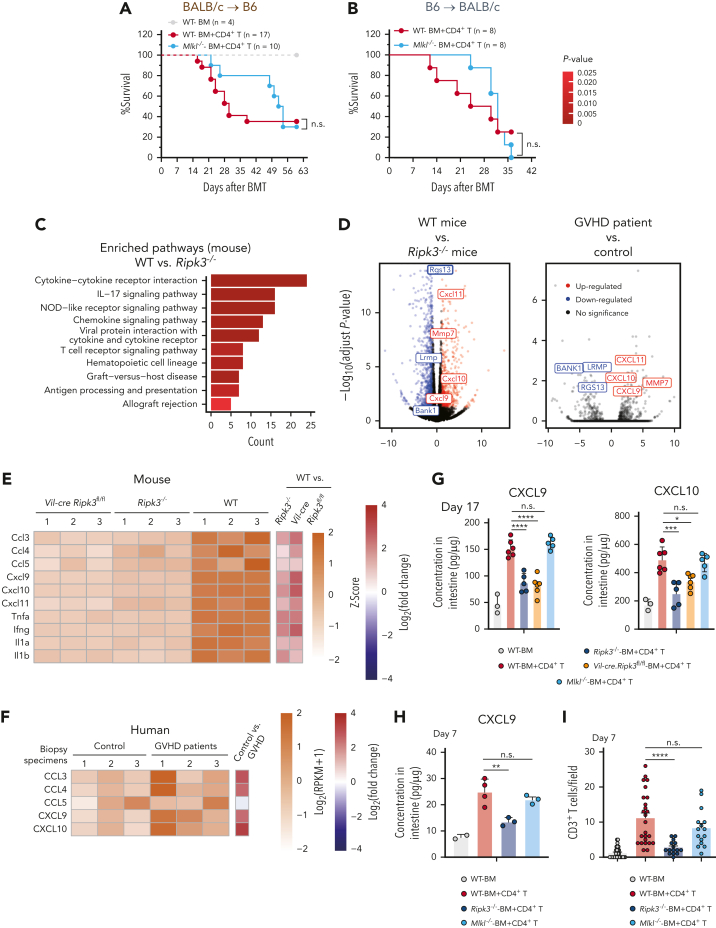
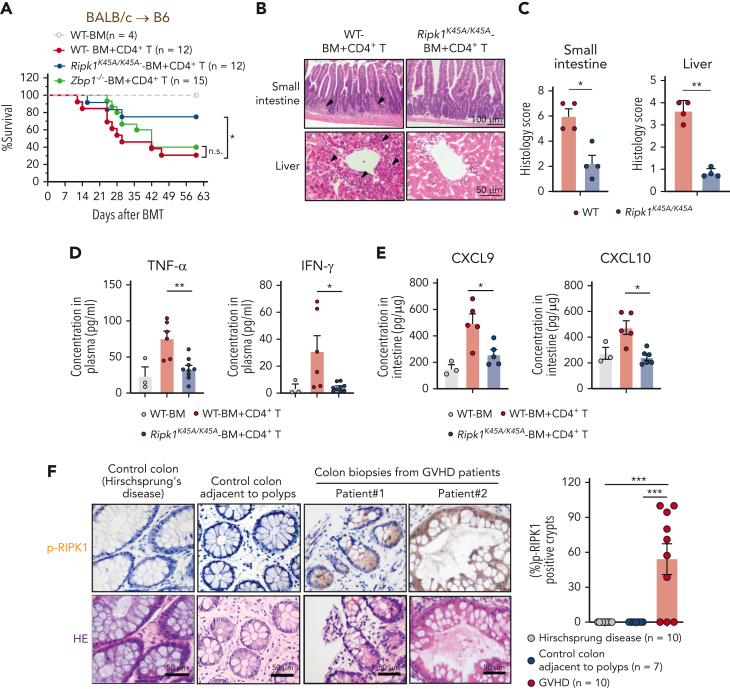
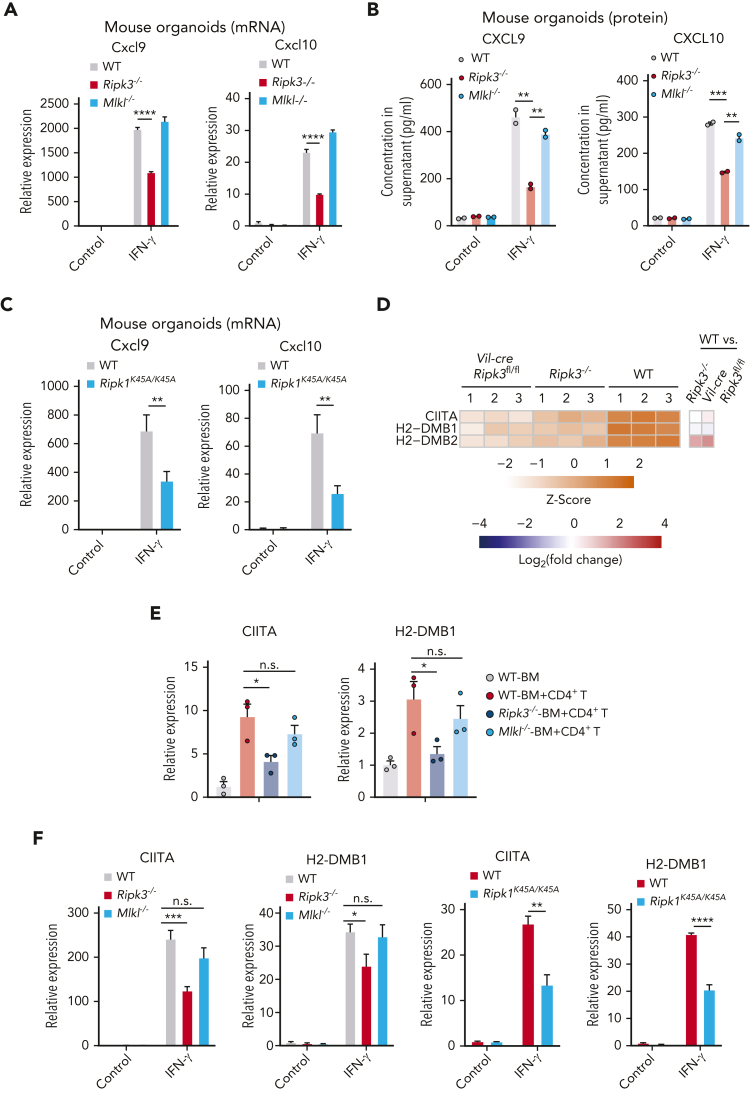
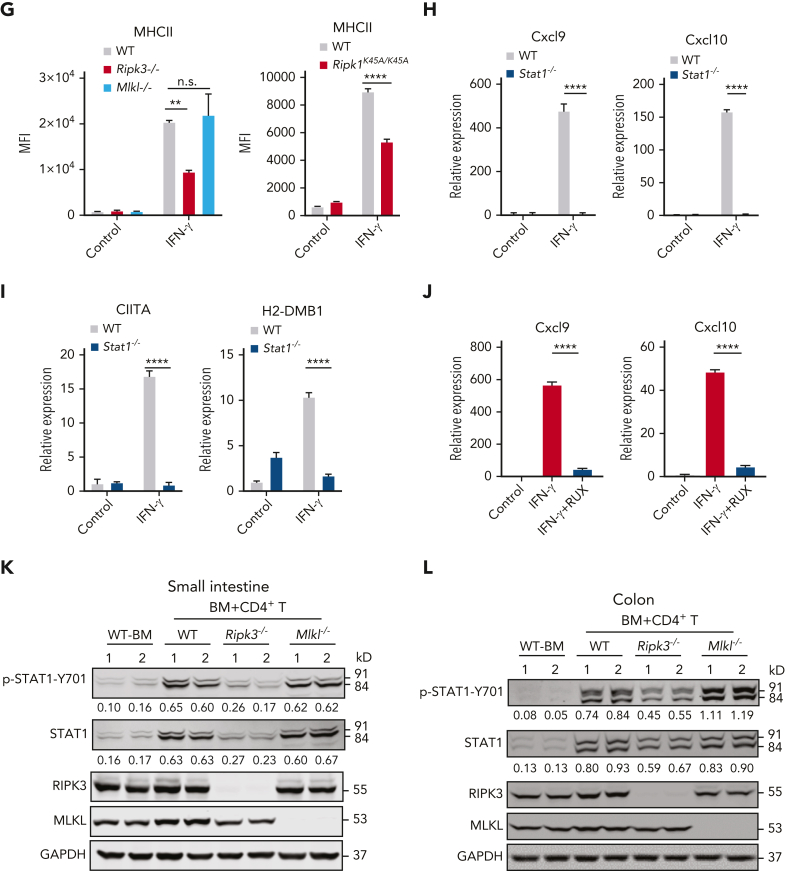
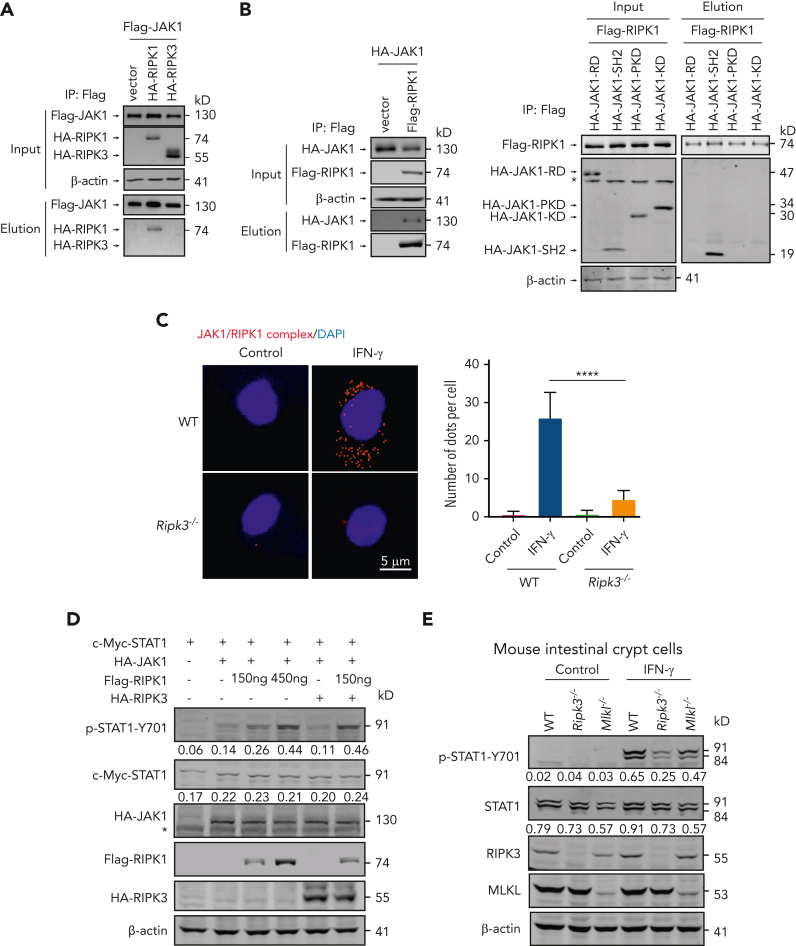
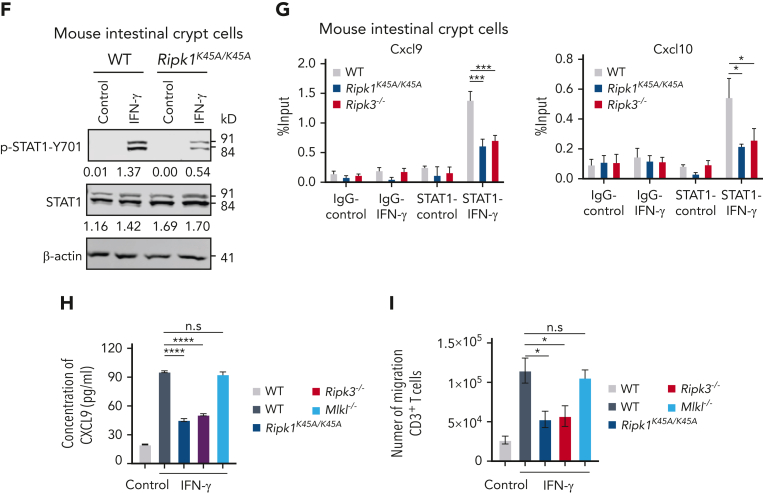
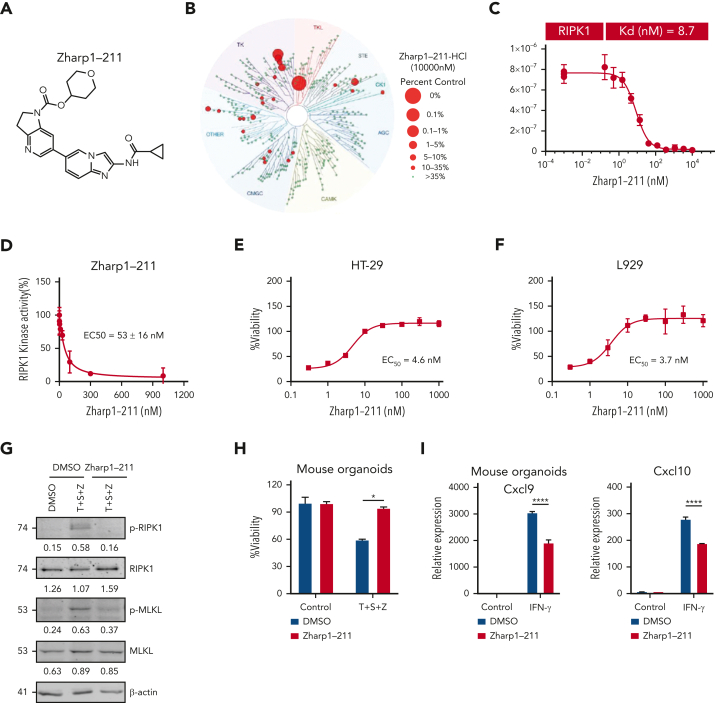
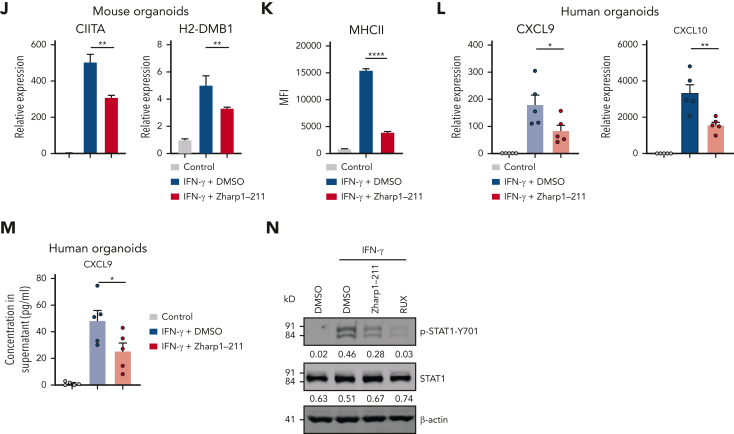
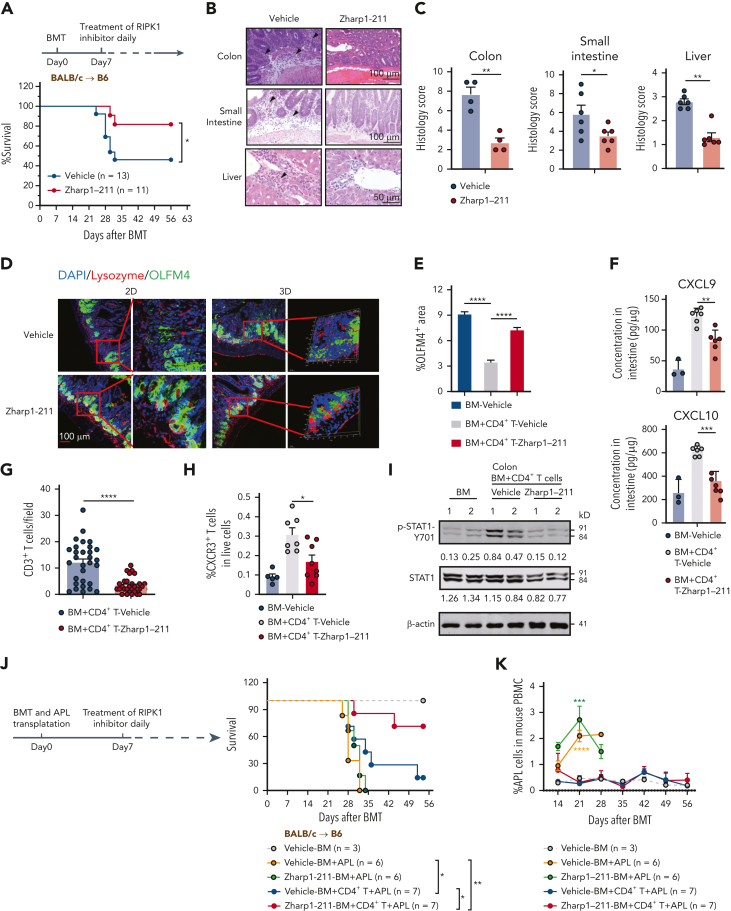
Intestinal epithelial cells (IECs) are implicated in the propagation of T-cell-mediated inflammatory diseases, including graft-versus-host disease (GVHD), but the underlying mechanism remains poorly defined. Here, we report that IECs require receptor-interacting protein kinase-3 (RIPK3) to drive both gastrointestinal (GI) tract and systemic GVHD after allogeneic hematopoietic stem cell transplantation. Selectively inhibiting RIPK3 in IECs markedly reduces GVHD in murine intestine and liver. IEC RIPK3 cooperates with RIPK1 to trigger mixed lineage kinase domain-like protein-independent production of T-cell-recruiting chemokines and major histocompatibility complex (MHC) class II molecules, which amplify and sustain alloreactive T-cell responses. Alloreactive T-cell-produced interferon gamma enhances this RIPK1/RIPK3 action in IECs through a JAK/STAT1-dependent mechanism, creating a feed-forward inflammatory cascade. RIPK1/RIPK3 forms a complex with JAK1 to promote STAT1 activation in IECs. The RIPK1/RIPK3-mediated inflammatory cascade of alloreactive T-cell responses results in intestinal tissue damage, converting the local inflammation into a systemic syndrome. Human patients with severe GVHD showed highly activated RIPK1 in the colon epithelium. Finally, we discover a selective and potent RIPK1 inhibitor (Zharp1-211) that significantly reduces JAK/STAT1-mediated expression of chemokines and MHC class II molecules in IECs, restores intestinal homeostasis, and arrests GVHD without compromising the graft-versus-leukemia (GVL) effect. Thus, targeting RIPK1/RIPK3 in IECs represents an effective nonimmunosuppressive strategy for GVHD treatment and potentially for other diseases involving GI tract inflammation.


Conflict of interest statement

Conflict-of-interest disclosure: X. Zhang and S. He are co-founders, consultants, and shareholders of Accro Bioscience Inc, which supports research in their labs. The remaining authors declare no competing financial interests.

Figures

None
Graphical abstract
Figure 1.
Figure 1.
Loss of RIPK3 in IECs reduces both local and systemic GVHD. (A) Survival of the lethally irradiated WT, Ripk3−/−, and Ripk3−/−caspase-8−/− B6 recipients (BALB/c→B6) that received BALB/c TCD BM cells (BM) with or without CD4+ T cells (BM+CD4+ T). (B) Survival of the lethally irradiated WT and Ripk3−/− BALB/c recipients (B6→BALB/c) that received B6 TCD BM cells with CD4+ T cells. (C) Survival of the lethally irradiated Ripk3fl/fl and Vil-cre Ripk3fl/fl B6 recipients (BALB/c→B6) that received BALB/c TCD BM cells with CD4+ T cells. (D-E) Histology analysis of small intestine, colon, and liver obtained from WT, Ripk3−/− and Vil-cre Ripk3fl/fl B6 recipients (BALB/c→B6) on day 17 after allo-HCT. Representative hematoxylin and eosin (H&E) images (D) and quantification of pathology scores (E). Bars in colon and small intestine represent 100 μm. Bar in liver represents 50 μm. Black arrows indicate areas of inflammatory cell infiltration or cell damage. (F) Representative 2D and 3D confocal images of OLFM4+ ISCs and lysozyme+ Paneth cells in the small intestine from the indicated B6 recipients on day 17 after allo-HCT. Bar represents 100 μm. (G) Quantification of IHC staining of OLFM4 in the small intestine from the indicated B6 recipients on day 17 after allo-HCT. (H) Quantification of infiltrated CD3+ T cells in the small intestine from the indicated B6 recipients (BALB/c→B6) on day 17 after allo-HCT. Three mice were examined in each group. (I) TNF-α and IFN-γ levels in serum from the indicated B6 recipients on day 17 after allo-HCT. Data shown are representative of 2 or 3 independent experiments. Data are shown as the mean ± SD (G-H), histology scores, and concentrations of cytokines are shown as the mean ± SEM (E,I). ∗P < .05; ∗∗P < .01; ∗∗∗P < .001; ∗∗∗∗P < .0001. Survival comparisons were evaluated by log-rank test (A-C). Multiple comparisons were evaluated by one-way ANOVA (E,G-I). ANOVA, analysis of variance; IHC, immunohistochemistry; SD, standard deviation; SEM, standard error of the mean.
Figure 2.
Figure 2.
IEC RIPK3 promotes MLKL-independent alloreactive T-cell responses. (A) Survival of the lethally irradiated WT and Mlkl−/− B6 recipients (BALB/c→B6) received BALB/c TCD BM alone (BM) or TCD BM plus CD4+ T cells (BM+CD4+ T). (B) Survival of the lethally irradiated WT and Mlkl−/− BALB/c recipients (B6→BALB/c) received B6 TCD BM alone (BM) or TCD BM plus CD4+ T cells (BM+CD4+ T). (C) KEGG pathway enrichment analyses of the DEGs in small intestine samples from WT and Ripk3−/− mice collected on day 17 after allo-HCT (P < .05, the P value is calculated by hypergeometric distribution). (D) Volcano plot showing fold changes of genes in small intestine samples collected from WT vs Ripk3−/− mice on day 17 after allo-HCT (left), or fold changes of genes in colonic biopsy specimens from patients with GVHD vs control colonic biopsy specimens from children without signs of intestinal injury (right). Significantly upregulated (red) and downregulated (blue) mouse or human homologous genes are shown. (E) Gene expression of chemokines and cytokines in the small intestine collected from WT, Ripk3−/−, and Vil-cre Ripk3fl/fl mice on day 17 after allo-HCT. (F) Gene expression of human chemokines in control colonic biopsy specimens and colonic biopsy specimens from patients with GVHD. (G) ELISA analysis of CXCL9 and CXCL10 proteins in the small intestine from the indicated B6 recipients (BALB/c→B6) 17 days after allo-HCT. (H) ELISA analysis of CXCL9 proteins in the small intestine from the indicated B6 recipients (BALB/c→B6) 7 days after allo-HCT. (I) Quantification of infiltrated CD3+ T cells in the small intestine from the indicated B6 recipients (BALB/c→B6) on day 7 after allo-HCT. Data shown are representative of 2 or 3 independent experiments. Data are shown as the mean ± SD (I), histology scores and chemokine concentrations are shown as the mean ± SEM (G-H). ∗P < .05; ∗∗P < .01; ∗∗∗P < .001; ∗∗∗∗P < .0001. Survival comparisons were evaluated by log-rank test (A-B). Multiple comparisons were evaluated by one-way ANOVA (G-I). ANOVA, analysis of variance; DEGs, differentially expressed genes; ELISA, enzyme-linked immunosorbent assay analysis; n.s., not significant; SD, standard deviation; SEM, standard error of the mean.
Figure 3.
Figure 3.
RIPK1 activates RIPK3 signaling in IECs during GVHD. (A-E) The lethally irradiated WT, Ripk1K45A/K45A, and Zbp1−/− B6 recipients (BALB/c→B6) received BALB/c TCD BM cells with or without CD4+ T cells. (A) Survival of mice after allo-HCT. (B-C) Histology analysis of small intestine and liver samples obtained from WT and Ripk1K45A/K45A B6 recipients on day 17 after allo-HCT. Representative H&E images (B) and quantification of pathology scores (C). Bar in small intestine represents 100 μm. Bar in liver represents 50 μm. Black arrows indicate areas of inflammatory cell infiltration or cell damage. (D) Levels of TNF-α and IFN-γ in serum from WT and Ripk1K45A/K45A B6 recipients on day 17 after allo-HCT. (E) ELISA analysis of CXCL9 and CXCL10 proteins in the small intestine from WT and Ripk1K45A/K45A B6 recipients on day 17 after allo-HCT. (F) Sections of 10 colon biopsies from patients with GVHD involved in the GI tract after allo-HCT, 10 control colon samples (from patients with Hirschsprung's disease) and 7 control colon samples adjacent to polyps were stained with an anti–p-RIPK1 antibody. Shown are representative images of IHC staining with anti–p-RIPK1 antibody and H&E staining from the control colon sample and 2 biopsies of patients with GVHD (left panel), and quantification of p-RIPK1 positive crypts in each sample (right panel). Bars represent 50 μm. Data shown are representative of 2 or 3 independent experiments. Data are shown as the mean ± SD (D-F), histology scores are shown as the mean ± SEM (C). ∗P < .05; ∗∗P < .01; ∗∗∗P < .001. Survival comparisons were evaluated by log-rank test (A). Multiple comparisons were evaluated by one-way ANOVA (D-F), two-group comparisons used unpaired t tests (two-tailed) (C). ANOVA, analysis of variance; ELISA, enzyme-linked immunosorbent assay analysis; IHC, immunohistochemistry; SD, standard deviation; SEM, standard error of the mean.
Figure 4.
Figure 4.
JAK/STAT1 signaling mediates RIPK1/RIPK3 induction of chemokines and MHC class II molecules in IECs. (A-B) Small intestinal organoids prepared from WT, Ripk3−/−, and Mlkl−/− B6 mice were treated with control (PBS) or IFN-γ (10 ng/mL) for 12 hours, with qPCR measurement of Cxcl9 and Cxcl10 expression (A); ELISA measurement of CXCL9 and CXCL10 protein levels (B). Identical concentrations for IFN-γ were used in later experiments unless otherwise stated. (C) qPCR analysis for the expression of Cxcl9 and Cxcl10 in small intestinal organoids from WT and Ripk1K45A/K45A B6 mice that were treated with control, IFN-γ for 12 hours. (D) Gene expression of antigen presentation-related genes in small intestine samples collected from WT, Ripk3−/−, and Vil-cre Ripk3fl/fl mice on day 17 after allo-HCT. (E) qPCR analysis of CIITA and H2-DMB1 mRNA levels in the small intestine from the indicated B6 recipients (BALB/c→B6) 17 days after allo-HCT. (F) Small intestinal organoids prepared from indicated B6 mice were treated with IFN-γ or control for 12 hours. CIITA and H2-DMB1 expression levels were analyzed using qPCR. (G) Small intestinal organoids prepared from indicated B6 mice were treated with IFN-γ or control for 24 hours. The MFI of MHC II was determined by flow cytometer analysis. (H-I) Small intestinal organoids prepared from WT and Stat1−/− B6 mice were treated with control or IFN-γ for 12 hours. qPCR for expression of Cxcl9, Cxcl10 (H), CIITA, and H2-DMB1 (I). (J) Small intestinal organoids from WT B6 mice were treated with 300 nM ruxolitinib (RUX) for 2 hours before IFN-γ treatment for 12 hours; gene expression was analyzed by qPCR. (K-L) Immunoblotting analysis of p-STAT1, STAT1, RIPK3, MLKL, and GAPDH in small intestine and colon from the indicated B6 recipients on day 7 after allo-HCT. Quantification of p-STAT1 or STAT1 normalized to GAPDH was shown under the band. Data shown are representative of 3 independent experiments. Data are shown as the mean ± SD (A-C,F-J), qPCR analysis in the small intestine are shown as the mean ± SEM (E). ∗P < .05; ∗∗P < .01; ∗∗∗P < .001; ∗∗∗∗P < .0001. Multiple comparisons were evaluated by one-way ANOVA (A-B,E-G,J), two-group comparisons used unpaired t tests (two-tailed) (C,F-I). ANOVA, analysis of variance; ELISA, enzyme-linked immunosorbent assay analysis; GAPDH, glyceraldehyde-3-phosphate dehydrogenase; MFI, mean fluorescence intensity; n.s., not significant; PBS, phosphate-buffered saline; SD, standard deviation; SEM, standard error of the mean.
Figure 4.
Figure 4.
JAK/STAT1 signaling mediates RIPK1/RIPK3 induction of chemokines and MHC class II molecules in IECs. (A-B) Small intestinal organoids prepared from WT, Ripk3−/−, and Mlkl−/− B6 mice were treated with control (PBS) or IFN-γ (10 ng/mL) for 12 hours, with qPCR measurement of Cxcl9 and Cxcl10 expression (A); ELISA measurement of CXCL9 and CXCL10 protein levels (B). Identical concentrations for IFN-γ were used in later experiments unless otherwise stated. (C) qPCR analysis for the expression of Cxcl9 and Cxcl10 in small intestinal organoids from WT and Ripk1K45A/K45A B6 mice that were treated with control, IFN-γ for 12 hours. (D) Gene expression of antigen presentation-related genes in small intestine samples collected from WT, Ripk3−/−, and Vil-cre Ripk3fl/fl mice on day 17 after allo-HCT. (E) qPCR analysis of CIITA and H2-DMB1 mRNA levels in the small intestine from the indicated B6 recipients (BALB/c→B6) 17 days after allo-HCT. (F) Small intestinal organoids prepared from indicated B6 mice were treated with IFN-γ or control for 12 hours. CIITA and H2-DMB1 expression levels were analyzed using qPCR. (G) Small intestinal organoids prepared from indicated B6 mice were treated with IFN-γ or control for 24 hours. The MFI of MHC II was determined by flow cytometer analysis. (H-I) Small intestinal organoids prepared from WT and Stat1−/− B6 mice were treated with control or IFN-γ for 12 hours. qPCR for expression of Cxcl9, Cxcl10 (H), CIITA, and H2-DMB1 (I). (J) Small intestinal organoids from WT B6 mice were treated with 300 nM ruxolitinib (RUX) for 2 hours before IFN-γ treatment for 12 hours; gene expression was analyzed by qPCR. (K-L) Immunoblotting analysis of p-STAT1, STAT1, RIPK3, MLKL, and GAPDH in small intestine and colon from the indicated B6 recipients on day 7 after allo-HCT. Quantification of p-STAT1 or STAT1 normalized to GAPDH was shown under the band. Data shown are representative of 3 independent experiments. Data are shown as the mean ± SD (A-C,F-J), qPCR analysis in the small intestine are shown as the mean ± SEM (E). ∗P < .05; ∗∗P < .01; ∗∗∗P < .001; ∗∗∗∗P < .0001. Multiple comparisons were evaluated by one-way ANOVA (A-B,E-G,J), two-group comparisons used unpaired t tests (two-tailed) (C,F-I). ANOVA, analysis of variance; ELISA, enzyme-linked immunosorbent assay analysis; GAPDH, glyceraldehyde-3-phosphate dehydrogenase; MFI, mean fluorescence intensity; n.s., not significant; PBS, phosphate-buffered saline; SD, standard deviation; SEM, standard error of the mean.
Figure 5.
Figure 5.
IFN-γ enhances the binding of RIPK1 to JAK1 to activate STAT1 in IECs. (A) HEK293T cells were cotransfected with a DNA plasmid expressing Flag-tagged JAK1 plus the plasmid expressing HA-tagged RIPK1 or RIPK3. Cell lysates were collected and immunoprecipitated with anti-Flag agarose. The Flag-JAK1 immunocomplex was analyzed by immunoblotting analysis. (B) HEK293T cells were cotransfected with a DNA plasmid expressing Flag-tagged RIPK1 plus the plasmid expressing HA-tagged JAK1 or the truncated form of JAK1 as indicated. Cell lysates were collected and immunoprecipitated with anti-Flag agarose. The Flag-RIPK1 immunocomplex was analyzed by immunoblotting analysis. (C) Intestinal crypt cells isolated from WT and Ripk3−/− B6 mice were treated with IFN-γ for 1 hour. Representative images of in situ PLA between JAK1 and RIPK1 (red). 4′,6-diamidino-2-phenylindole was shown (blue). Bar represents 5 μm. (D) Immunoblotting analysis of p-STAT1, c-myc-tagged STAT1, Flag tagged-RIPK1, HA tagged-RIPK3, and β-actin in HEK293T cells transfected with the indicated DNA plasmid(s). Quantification of p-STAT1 or STAT1 normalized to β-actin was shown under the band. (E) Intestinal crypt cells isolated from WT, Ripk3−/−, and Mlkl−/− B6 mice were treated with IFN-γ for 0.5 hour. Immunoblotting analysis of p-STAT1, STAT1, RIPK3, MLKL, and β-actin. Quantification of p-STAT1 or STAT1 normalized to β-actin was shown under the band. (F) Intestinal crypt cells isolated from WT and Ripk1K45A/K45A B6 mice were treated with IFN-γ for 0.5 hour. Immunoblotting analysis of p-STAT1, STAT1, and β-actin. Quantification of p-STAT1 or STAT1 normalized to β-actin was shown under the band. (G) Intestinal crypt cells isolated from WT, Ripk1K45A/K45A, and Ripk3−/− B6 mice were treated with IFN-γ for 0.5 hour. STAT1 binding to selected regions of the Cxcl9 and Cxcl10 promoters was determined by ChIP-qPCR. The amount of precipitated DNA was calculated as percent input. (H-I) Intestinal crypt cells isolated from WT, Ripk3−/−, Mlkl−/−, and Ripk1K45A/K45A B6 mice were treated with IFN-γ for 24 hours, and the culture medium was collected for ELISA measurement of CXCL9 protein (H), and for further experiment (I). The culture medium was then added into the bottom compartment of a transwell chamber and T cells isolated from WT B6 mice were plated into the upper compartment. After 6 hours, migration of T cells was assessed by transwell assay (I). Data shown are representative of 3 independent experiments. Data are shown as the mean ± SD. ∗P < .05; ∗∗∗P < .001; ∗∗∗∗P < .0001. Multiple comparisons were evaluated by one-way ANOVA. ANOVA, analysis of variance; ChIP, chromatin immunoprecipitation; ELISA, enzyme-linked immunosorbent assay analysis; n.s., not significant; PLA, proximity ligation assay. SD, standard deviation.
Figure 5.
Figure 5.
IFN-γ enhances the binding of RIPK1 to JAK1 to activate STAT1 in IECs. (A) HEK293T cells were cotransfected with a DNA plasmid expressing Flag-tagged JAK1 plus the plasmid expressing HA-tagged RIPK1 or RIPK3. Cell lysates were collected and immunoprecipitated with anti-Flag agarose. The Flag-JAK1 immunocomplex was analyzed by immunoblotting analysis. (B) HEK293T cells were cotransfected with a DNA plasmid expressing Flag-tagged RIPK1 plus the plasmid expressing HA-tagged JAK1 or the truncated form of JAK1 as indicated. Cell lysates were collected and immunoprecipitated with anti-Flag agarose. The Flag-RIPK1 immunocomplex was analyzed by immunoblotting analysis. (C) Intestinal crypt cells isolated from WT and Ripk3−/− B6 mice were treated with IFN-γ for 1 hour. Representative images of in situ PLA between JAK1 and RIPK1 (red). 4′,6-diamidino-2-phenylindole was shown (blue). Bar represents 5 μm. (D) Immunoblotting analysis of p-STAT1, c-myc-tagged STAT1, Flag tagged-RIPK1, HA tagged-RIPK3, and β-actin in HEK293T cells transfected with the indicated DNA plasmid(s). Quantification of p-STAT1 or STAT1 normalized to β-actin was shown under the band. (E) Intestinal crypt cells isolated from WT, Ripk3−/−, and Mlkl−/− B6 mice were treated with IFN-γ for 0.5 hour. Immunoblotting analysis of p-STAT1, STAT1, RIPK3, MLKL, and β-actin. Quantification of p-STAT1 or STAT1 normalized to β-actin was shown under the band. (F) Intestinal crypt cells isolated from WT and Ripk1K45A/K45A B6 mice were treated with IFN-γ for 0.5 hour. Immunoblotting analysis of p-STAT1, STAT1, and β-actin. Quantification of p-STAT1 or STAT1 normalized to β-actin was shown under the band. (G) Intestinal crypt cells isolated from WT, Ripk1K45A/K45A, and Ripk3−/− B6 mice were treated with IFN-γ for 0.5 hour. STAT1 binding to selected regions of the Cxcl9 and Cxcl10 promoters was determined by ChIP-qPCR. The amount of precipitated DNA was calculated as percent input. (H-I) Intestinal crypt cells isolated from WT, Ripk3−/−, Mlkl−/−, and Ripk1K45A/K45A B6 mice were treated with IFN-γ for 24 hours, and the culture medium was collected for ELISA measurement of CXCL9 protein (H), and for further experiment (I). The culture medium was then added into the bottom compartment of a transwell chamber and T cells isolated from WT B6 mice were plated into the upper compartment. After 6 hours, migration of T cells was assessed by transwell assay (I). Data shown are representative of 3 independent experiments. Data are shown as the mean ± SD. ∗P < .05; ∗∗∗P < .001; ∗∗∗∗P < .0001. Multiple comparisons were evaluated by one-way ANOVA. ANOVA, analysis of variance; ChIP, chromatin immunoprecipitation; ELISA, enzyme-linked immunosorbent assay analysis; n.s., not significant; PLA, proximity ligation assay. SD, standard deviation.
Figure 6.
Figure 6.
Development of a novel RIPK1 kinase inhibitor. (A) Chemical structure of Zharp1-211. (B) Assessment of Zharp1-211 (10 μM) binding against 468 human kinases (DiscoverX kinase panel). TREEspot kinase interaction map of Zharp1-211 with 468 kinases. Red circles indicate kinases that were inhibited by AC002 >65%. Full data are presented in extended Data supplemental Table 2. (C) The binding constant (Kd) of Zharp1-211 with human recombinant RIPK1. (D) In vitro kinase activity assays using recombinant RIPK1. (E-F) Dose response curve and EC50 for Zharp1-211 in TNF-α–induced necroptosis in human HT-29 cells and mouse L929 cells. HT-29 cells were pretreated with Zharp1-211 at the indicated concentration for 2 hours before the treatment with necroptotic stimuli, TNF-α (40 ng/mL), the inhibitor of apoptosis protein (IAP) antagonist Smac mimetic (100 nM), and the pan-caspase inhibitor z-VAD (20 μM), for 48 hours (E). L929 cells were pretreated with Zharp1-211 at the indicated concentration for 2 hours before treatment with TNF-α (40 ng/mL) and z-VAD (20 μM) for 24 hours (F). Cell viability was assessed by measuring ATP levels. (G-H) Small intestinal organoids from WT B6 mice were treated with Zharp1-211 (100 nM) for 2 hours and then treated with TNF-α (40 ng/mL), Smac mimetic (100 nM), and z-VAD (20 μM). Immunoblotting of cell lysates from organoids with antibodies against RIPK1, p-RIPK1, MLKL, p-MLKL, and β-actin was performed at 8 hours after treatment with TNF-α, Smac mimetic, and z-VAD (G). Quantification of p-RIPK1, RIPK1, p-MLKL, or MLKL normalized to β-actin was shown under the band. Cell viability in organoids at 24 hours aftertreatment with TNF-α, Smac mimetic, and z-VAD, assessed by measuring ATP levels (H). (I-J) Small intestinal organoids prepared from B6 mice were pretreated with Zharp1-211 (100 nM) for 2 hours before the treatment with IFN-γ for 12 hours. qPCR measurement of Cxcl9, Cxcl10 expression (I), CIITA, and H2-DMB1 expression (J). (K) Small intestinal organoids prepared from B6 mice were pretreated with Zharp1-211 (100 nM) for 2 hours before the treatment with IFN-γ for 24 hours. The MFI of MHC II was determined by flow cytometer analysis. (L-M) Human intestinal organoids from 5 individual donors (n = 5) were treated with Zharp1-211 (100 nM) for 2 hours and then stimulated with IFN-γ for 12 hours. Expression of the indicated genes was analyzed by qPCR (L) and protein levels were measured by ELISA (M). (N) Intestinal crypt cells isolated from WT B6 mice were treated with DMSO, 100 nM Zharp1-211, or ruxolitinib (RUX) for 2 hours before stimulation with IFN-γ (100 ng/mL) for 1 hour. Cell lysates was collected for immunoblotting with antibodies against p-STAT1, STAT1, and β-actin. Quantification of p-STAT1 or STAT1 normalized to β-actin was shown under the band. Data shown are representative of 3 independent experiments. Data are shown as the mean ± SD. ∗P < .05; ∗∗P < .01; ∗∗∗∗P < .0001. Multiple comparisons were evaluated by one-way ANOVA (J-M), two-group comparisons used unpaired t test (two-tailed) (H-I). ANOVA, analysis of variance; ATP, adenosine triphosphate; ELISA, enzyme-linked immunosorbent assay analysis; MFI, mean fluorescence intensity; SD, standard deviation.
Figure 6.
Figure 6.
Development of a novel RIPK1 kinase inhibitor. (A) Chemical structure of Zharp1-211. (B) Assessment of Zharp1-211 (10 μM) binding against 468 human kinases (DiscoverX kinase panel). TREEspot kinase interaction map of Zharp1-211 with 468 kinases. Red circles indicate kinases that were inhibited by AC002 >65%. Full data are presented in extended Data supplemental Table 2. (C) The binding constant (Kd) of Zharp1-211 with human recombinant RIPK1. (D) In vitro kinase activity assays using recombinant RIPK1. (E-F) Dose response curve and EC50 for Zharp1-211 in TNF-α–induced necroptosis in human HT-29 cells and mouse L929 cells. HT-29 cells were pretreated with Zharp1-211 at the indicated concentration for 2 hours before the treatment with necroptotic stimuli, TNF-α (40 ng/mL), the inhibitor of apoptosis protein (IAP) antagonist Smac mimetic (100 nM), and the pan-caspase inhibitor z-VAD (20 μM), for 48 hours (E). L929 cells were pretreated with Zharp1-211 at the indicated concentration for 2 hours before treatment with TNF-α (40 ng/mL) and z-VAD (20 μM) for 24 hours (F). Cell viability was assessed by measuring ATP levels. (G-H) Small intestinal organoids from WT B6 mice were treated with Zharp1-211 (100 nM) for 2 hours and then treated with TNF-α (40 ng/mL), Smac mimetic (100 nM), and z-VAD (20 μM). Immunoblotting of cell lysates from organoids with antibodies against RIPK1, p-RIPK1, MLKL, p-MLKL, and β-actin was performed at 8 hours after treatment with TNF-α, Smac mimetic, and z-VAD (G). Quantification of p-RIPK1, RIPK1, p-MLKL, or MLKL normalized to β-actin was shown under the band. Cell viability in organoids at 24 hours aftertreatment with TNF-α, Smac mimetic, and z-VAD, assessed by measuring ATP levels (H). (I-J) Small intestinal organoids prepared from B6 mice were pretreated with Zharp1-211 (100 nM) for 2 hours before the treatment with IFN-γ for 12 hours. qPCR measurement of Cxcl9, Cxcl10 expression (I), CIITA, and H2-DMB1 expression (J). (K) Small intestinal organoids prepared from B6 mice were pretreated with Zharp1-211 (100 nM) for 2 hours before the treatment with IFN-γ for 24 hours. The MFI of MHC II was determined by flow cytometer analysis. (L-M) Human intestinal organoids from 5 individual donors (n = 5) were treated with Zharp1-211 (100 nM) for 2 hours and then stimulated with IFN-γ for 12 hours. Expression of the indicated genes was analyzed by qPCR (L) and protein levels were measured by ELISA (M). (N) Intestinal crypt cells isolated from WT B6 mice were treated with DMSO, 100 nM Zharp1-211, or ruxolitinib (RUX) for 2 hours before stimulation with IFN-γ (100 ng/mL) for 1 hour. Cell lysates was collected for immunoblotting with antibodies against p-STAT1, STAT1, and β-actin. Quantification of p-STAT1 or STAT1 normalized to β-actin was shown under the band. Data shown are representative of 3 independent experiments. Data are shown as the mean ± SD. ∗P < .05; ∗∗P < .01; ∗∗∗∗P < .0001. Multiple comparisons were evaluated by one-way ANOVA (J-M), two-group comparisons used unpaired t test (two-tailed) (H-I). ANOVA, analysis of variance; ATP, adenosine triphosphate; ELISA, enzyme-linked immunosorbent assay analysis; MFI, mean fluorescence intensity; SD, standard deviation.
Figure 7.
Figure 7.
Pharmacological inhibition of RIPK1 reduces ongoing GVHD while preserving GVL activity. (A-I) The lethally irradiated B6 recipients (BALB/c→B6) received BALB/c TCD BM cells with CD4+ T cells. Starting at 7 days after allo-HCT, mice were treated daily (intraperitoneally) with vehicle or Zharp1-211 (5 mg/kg). (A) Survival of mice after allo-HCT. (B-C) Histological analysis of small intestine and liver, assessed on day 17 after allo-HCT. Representative H&E images (B) and quantification of pathology scores (C). Bars in colon and small intestine represent 100 μm. Bar in liver represents 50 μm. Black arrows indicate areas of inflammatory cell infiltration or cell damage. (D) Representative 2D and 3D confocal images of OLFM4+ ISCs and lysozyme+ Paneth cells in small intestines from the indicated mice at 17 days after allo-HCT. Bar represents 100 μm. (E) Quantitation of IHC staining of OLFM4 in small intestines on day 17 after allo-HCT. (F) ELISA analysis of CXCL9 and CXCL10 protein levels in the small intestine from the indicated mice at 17 days after allo-HCT. (G) Quantification of infiltrated CD3+ T cells in the small intestines from the indicated B6 recipients at day 17 after allo-HCT. (H) Quantification of infiltrated CXCR3+ CD3+ T cells in the small intestine from the indicated B6 recipients at day 17 after allo-HCT. (I) Immunoblotting analysis of p-STAT1, STAT1, and β-actin in the intestine from the indicated B6 recipients after allo-HCT. Quantification of p-STAT1 or STAT1 normalized to β-actin was shown under the band. (J-K) The lethally irradiated B6 recipients received TCD BM cells (BM) alone, or in combination with CD4+ T cells from BALB/c mice. Subsequently, these mice were challenged with 1 × 106 APL at the time of the BM transplant. Starting at 7 days after allo-HCT, recipients were treated daily (intraperitoneally) with vehicle or Zharp1-211 (5 mg/kg). The survival rates (J) and percentage of APL cells in peripheral blood from day 14(K) were measured. Vehicle-BM+APL group and Zharp1-211-BM+APL group were compared with Vehicle-BM group on day 21. Data shown are representative of 2 or 3s independent experiments. Data are shown as the mean ± SD (E), histology scores and concentrations of cytokines are shown as the mean ± SEM (C,F-H,K). ∗P < .05; ∗∗P < .01; ∗∗∗P < .001; ∗∗∗∗P < .0001. Survival comparisons were evaluated by log-rank test (A,J). Multiple comparisons were evaluated by one-way ANOVA (E-F,H); two-group comparisons used unpaired t tests (two-tailed) (C,G); APL cell measurements were evaluated by two-way ANOVA (K). ANOVA, analysis of variance; ELISA, enzyme-linked immunosorbent assay analysis; IHC, immunohistochemistry; SD, standard deviation; SEM, standard error of the mean.

Comment in

  • A novel RIPK1 inhibitor attenuates GVHD.
    Hill GR, Koyama M. Hill GR, et al. Blood. 2023 Mar 2;141(9):969-970. doi: 10.1182/blood.2022019019. Blood. 2023. PMID: 36862437 Free PMC article. No abstract available.

References

    1. Peterson LW, Artis D. Intestinal epithelial cells: regulators of barrier function and immune homeostasis. Nat Rev Immunol. 2014;14(3):141–153. - PubMed
    1. Lane RS, Lund AW. Non-hematopoietic control of peripheral tissue T cell responses: implications for solid tumors. Front Immunol. 2018;9:2662–2677. - PMC - PubMed
    1. Patankar JV, Becker C. Cell death in the gut epithelium and implications for chronic inflammation. Nat Rev Gastroenterol Hepatol. 2020;17(9):543–556. - PubMed
    1. Koyama M, Kuns RD, Olver SD, et al. Recipient nonhematopoietic antigen-presenting cells are sufficient to induce lethal acute graft-versus-host disease. Nat Med. 2011;18(1):135–142. - PubMed
    1. Koyama M, Mukhopadhyay P, Schuster IS, et al. MHC class II antigen presentation by the intestinal epithelium initiates graft-versus-host disease and is influenced by the microbiota. Immunity. 2019;51(5):885–898.e7. - PMC - PubMed

Publication types

Substances