. 2022 Dec 1;82(23):4410-4427.e12.
doi: 10.1016/j.molcel.2022.10.022. Epub 2022 Nov 9.

Transcription factor antagonism regulates heterogeneity in embryonic stem cell states

Affiliations

Transcription factor antagonism regulates heterogeneity in embryonic stem cell states

Sofia Hu et al. Mol Cell. .

Abstract

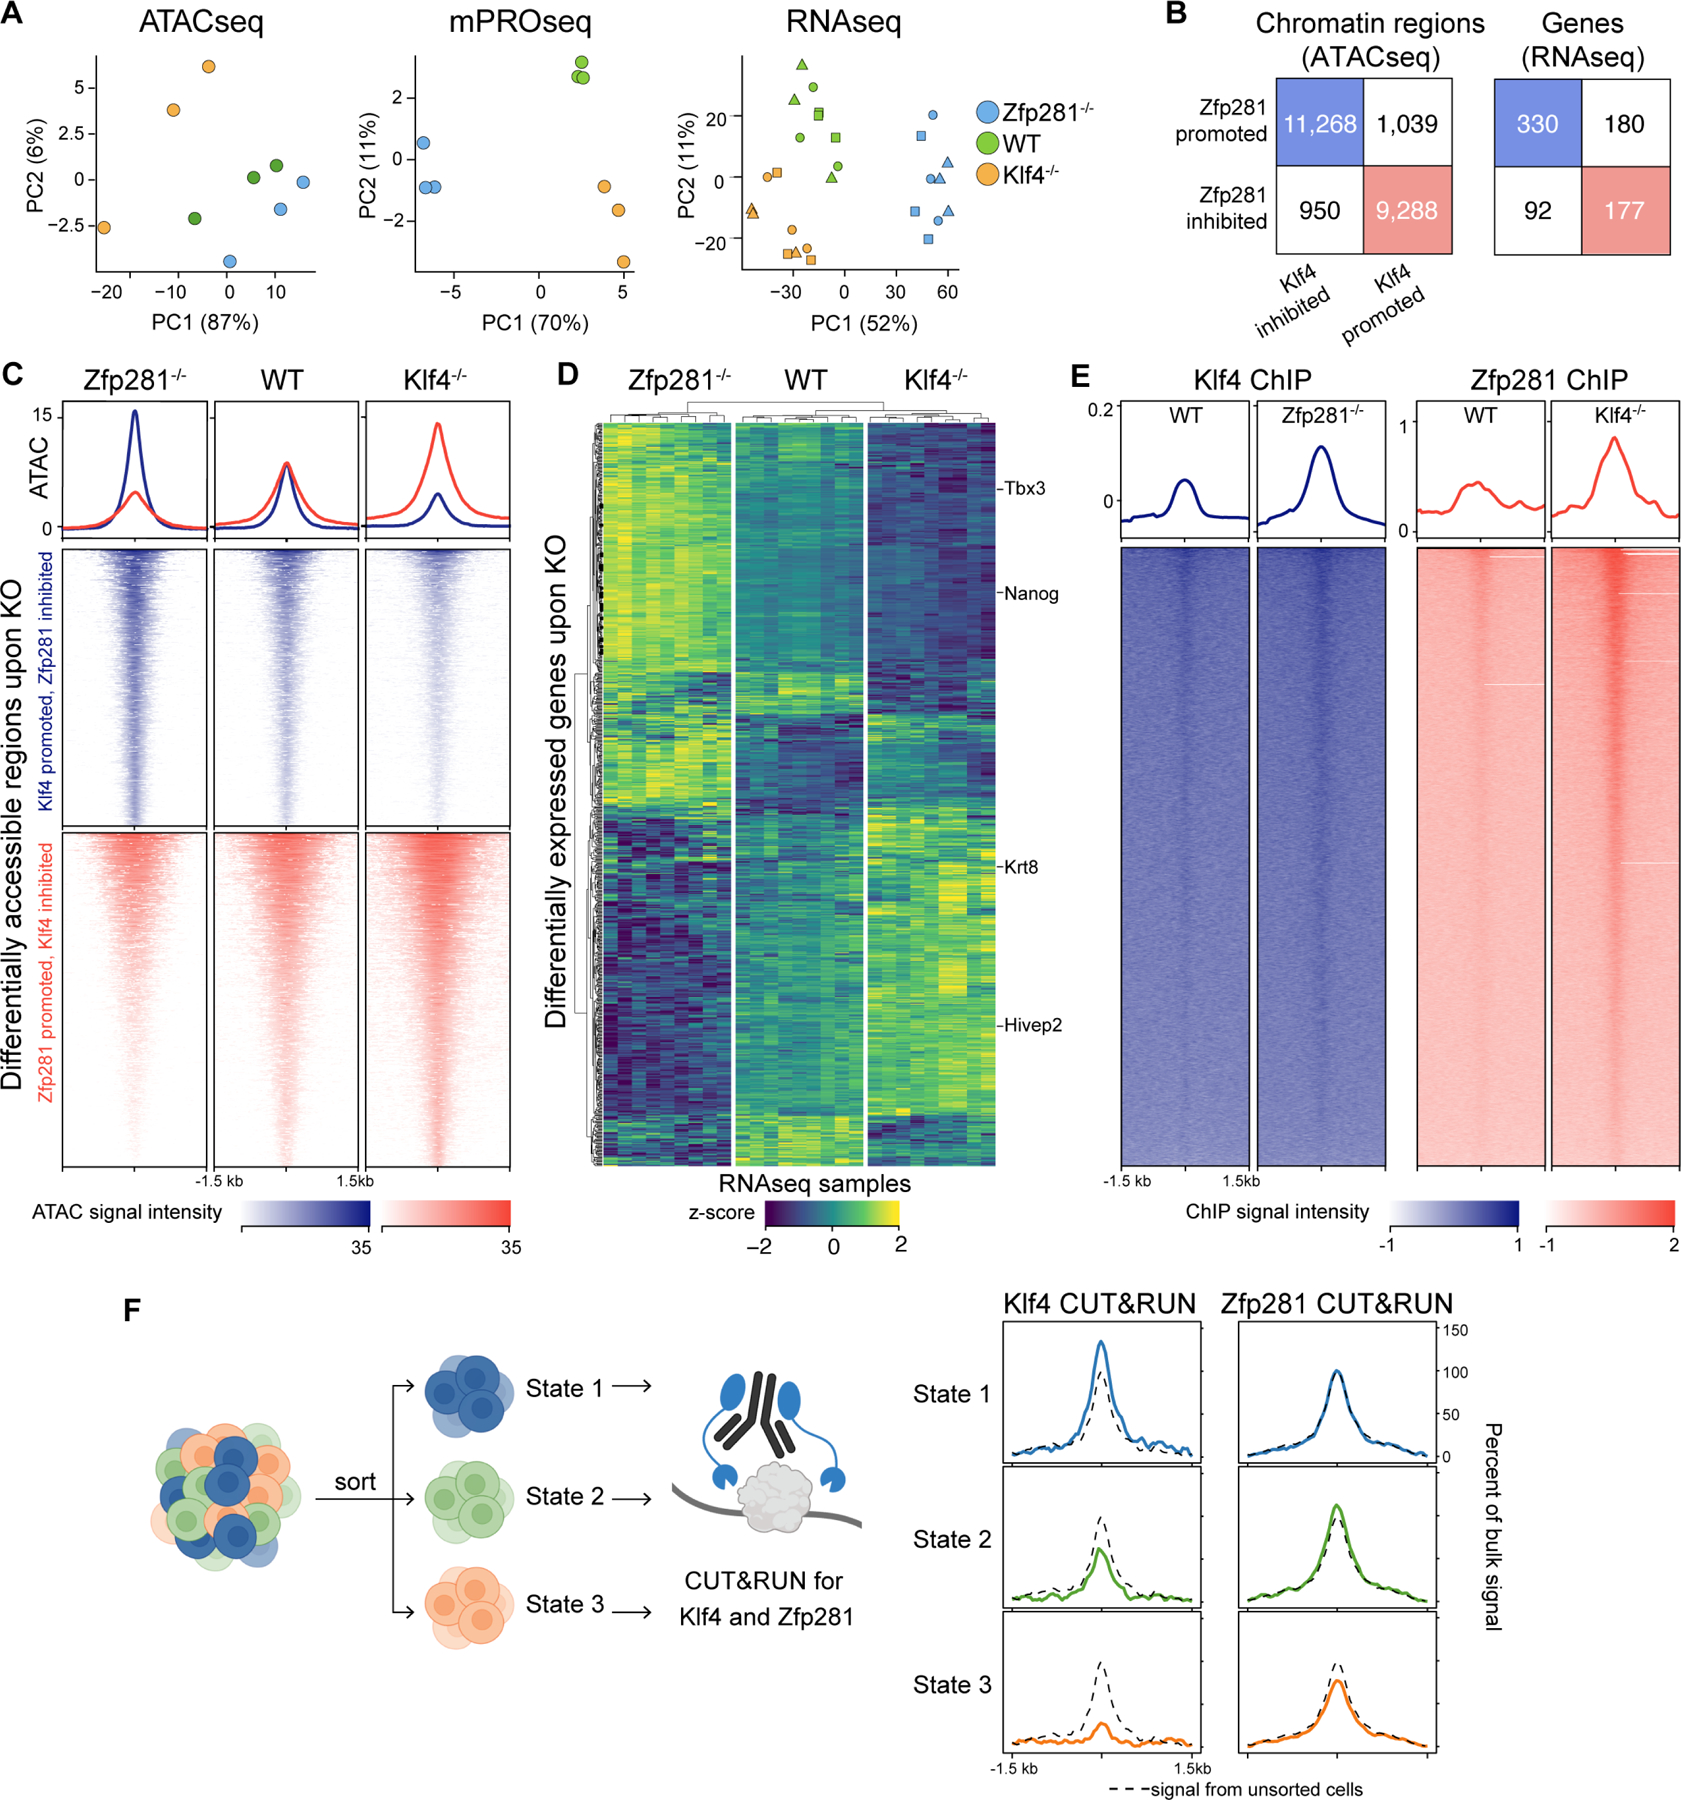
Gene expression heterogeneity underlies cell states and contributes to developmental robustness. While heterogeneity can arise from stochastic transcriptional processes, the extent to which it is regulated is unclear. Here, we characterize the regulatory program underlying heterogeneity in murine embryonic stem cell (mESC) states. We identify differentially active and transcribed enhancers (DATEs) across states. DATEs regulate differentially expressed genes and are distinguished by co-binding of transcription factors Klf4 and Zfp281. In contrast to other factors that interact in a positive feedback network stabilizing mESC cell-type identity, Klf4 and Zfp281 drive opposing transcriptional and chromatin programs. Abrogation of factor binding to DATEs dampens variation in gene expression, and factor loss alters kinetics of switching between states. These results show antagonism between factors at enhancers results in gene expression heterogeneity and formation of cell states, with implications for the generation of diverse cell types during development.

Keywords: Klf4; Zfp281; cell-to-cell variation; embryonic stem cell state; enhancer RNA; gene expression variation; transcription factors.


Conflict of interest statement

Declaration of interests The authors declare no competing interests.

Figures

FIGURE 1:
FIGURE 1:. Variable enhancer transcription across heterogeneous mESC states
A-B. mESC organize into and switch between three cell states, defined by Nanog and Sox2 expression levels. Heterozygous knock-in GFP-P2A-Nanog and Sox2-P2A-mCherry mESC were previously generated (Chakraborty et al., 2020) and analyzed by flow cytometry, yielding States 1, 2, and 3. C. Single mESC were cloned, grown for 7 days, and colonies analyzed by flow cytometry for distribution across States 1–3 (bottom). D. Heatmap and hierarchical clustering of differentially expressed genes (mPROseq) across mESC states. Three biological replicates are shown. E. Ternary plot showing the proportion of nascent eRNA reads across States 1, 2, and 3 for each enhancer. Differentially active and transcribed enhancers (DATEs) and stably active and transcribed enhancers (SATEs) are indicated. F. Heatmap showing distribution and strength of nascent RNA transcripts at enhancers across States 1, 2, and 3.
FIGURE 2:
FIGURE 2:. Differentially active and transcribed enhancers regulate variable gene expression and mESC state
A. Representative loci of State 1 (Tbx3) and State 3 (Krt8) differential gene and enhancer transcription. Tracks are shown for nascent RNA transcription (mPROseq) in each mESC state, along with ChIPseq for Nanog, H3K27Ac, H3K4me3, and RNA polymerase II (PolII) obtained from (Creyghton et al., 2010; Lin et al., 2011; Whyte et al., 2013). B. RT-qPCR analysis in States 1, 2, and 3 for levels of Tbx3 and Krt8 genes and DATEs. Data represent mean ± SEM of three technical replicates (one-way ANOVA, *p < 0.05, ** p < 0.01, *** p < 0.001). See also Fig. S3B. C. Repressive dCas9-KRAB was targeted to the enhancer, and eRNA produced from the enhancer and mRNA produced from the putative gene target measured by RT-qPCR. Samples were treated with either a non-targeting control guide (Control) or an enhancer-targeting guide (CRISPRi). Data represent mean ± SEM of three technical replicates and are representative of two biological replicates (two-tailed Student’s t-test, *p < 0.05, ** p < 0.01, *** p < 0.001). See also Fig. S3C. D. mPROseq enhancers were mapped to putative gene targets, and the coefficient of variation in gene expression across States 1–3 was calculated for each gene target and plotted. Genes associated with DATEs are more variably expressed than genes associated with SATEs (F-test, *** p < 0.001). E. Schematic of CRISPRi screen experiment. F. Enrichment of sgRNAs targeting the −5kb Nanog enhancer, calculated as log2 fold change in sgRNA frequency between sorted (Nanoghigh or Nanoglow) and unsorted populations in a biological replicate (paired t-test, **p < 0.01). See also Fig. S4A. G. CRISPRi screen enrichment of all sgRNAs detected across four biological replicates, calculated as log2 fold change in sgRNA frequency between Nanoghigh and Nanoglow sorted populations. Hits (gray region, see Methods) are colored based on whether the sgRNA targets a DATE or SATE. See also Fig. S4B–D.
FIGURE 3:
FIGURE 3:. Differential transcription factor binding at DATEs identifies a role for Klf4 and Zfp281
A. Heatmap of the overlap (Jaccard index) between the genomic binding sites of indicated factors at DATEs. See also Fig. S5A. B. Overlap between Klf4 and Zfp281 binding sites across the genome (left) and at DATEs (right). C. Klf4 and Zfp281 ChIPseq signal at DATEs, data from (Fidalgo et al., 2016; di Giammartino et al., 2019). D. Flow cytometry analysis of Zfp281−/−, WT, and Klf4−/− cells. Distributions are representative of three independent clones for each genotype. E. Zfp281−/−, WT, and Klf4−/− cells were immunohistochemically stained and quantified using p-Nitrophenyl Phosphate assay for alkaline phosphatase activity. The data represent mean ± SEM of three technical replicates from three biological replicates (one-way ANOVA, *** p < 0.001). F. Zfp281−/−, WT, and Klf4−/− cells were differentiated for 4 days in retinoic acid (RA). Cells were stained for neuroectoderm marker CD24 and analyzed by flow cytometry (left). RT-qPCR was performed for Nanog (right, one-way ANOVA, ** p < 0.01, *** p < 0.001).
FIGURE 4:
FIGURE 4:. Klf4 and Zfp281 drive opposing transcriptional and regulatory programs
A. Principal component analysis of ATACseq, mPROseq, and RNAseq signal at differentially accessible regions (ATACseq) or differentially expressed (mPROseq and RNAseq) protein coding genes in Zfp281−/−, WT, and Klf4−/− cells. Three biological replicates were analyzed in ATACseq and mPROseq. Three biological replicates of three lines for each genotype were analyzed in RNAseq (point shape denotes lines). B. Comparison of differentially accessible chromatin regions and differentially expressed genes upon Klf4 and Zfp281 knockout. See also Fig. S6A–F. C. ATACseq at differentially accessible regions upon Klf4 or Zfp281 knockout. D. Heatmap and hierarchical clustering of differentially expressed genes and RNAseq samples. Three biological replicates per three lines are shown for each genotype. E. Klf4 ChIPseq signal at Klf4-bound peaks in WT and Zfp281−/− cells, and Zfp281 ChIPseq signal at Zfp281-bound peaks in WT and Klf4 −/− cells. F. Klf4 and Zfp281 CUT&RUN signal at DATEs in sorted WT States 1, 2, and 3 cells. Signal is normalized and plotted relative to WT unsorted cells (dashed black lines).
FIGURE 5:
FIGURE 5:. Klf4 and Zfp281 antagonism at DATEs regulates variable expression of gene targets
A. Coverage tracks for gene and enhancer expression at representative loci (Tbx3 and Krt8) across Zfp281−/−, WT, and Klf4−/− cells. Arrows indicate genomic target sites for enhancer deletion (del) and base edits (BE). Representative Sanger sequencing traces show base editing of Klf4 and Zfp281 binding motifs (BE) compared to WT sequence (No edit). Klf4/Zfp281 co-bound regions are underlined, and edited bases are highlighted in red. B. RT-qPCR analysis for target gene expression following enhancer deletion (del) at sequences indicated above (Fig. 5A, right). Data represent mean ± SEM of three technical replicates and are representative of three biological replicates (one-way ANOVA, *** p < 0.001). C. RT-qPCR analysis for target gene expression following base editing (BE) at nucleotides indicated above (Fig. 5A, right). Data represent mean ± SEM of three technical replicates and are representative of three biological replicates (one-way ANOVA, *** p < 0.001). D. (left) RT-qPCR analysis for target gene expression in sorted States 1, 2, and 3 in WT and enhancer deletion (enh del) mESC, coefficient of variation across States 1–3 is indicated for each genotype. (right) Ratio between the highest and lowest expression levels in WT or enhancer deleted mESC is plotted (two-sided Student’s t-test, ** p < 0.01).
FIGURE 6:
FIGURE 6:. Relative levels of Klf4 and Zfp281 correlate with mESC state in single cells
A. mESC were stained for Klf4 and Zfp281. Merged image is shown. See also Fig. S8A. B. scRNAseq of WT mESC, visualized by UMAP. Each cell was scored for expression of State 1, 2, and 3 gene signatures and assigned to a state (see Methods). C. Each cell was scored for expression of Klf4 and Zfp281 gene targets (see Methods). The Klf4/Zfp281 program ratio was calculated as log2(Klf4 gene targets score / Zfp281 gene targets score). See also Fig. S8C–D. D. Klf4/Zfp281 program ratio plotted against State 1, 2, and 3 scores for each cell. E. UMAP embedding of WT, Klf4−/−, and Zfp281−/− cells, colored by genotype. Inset shows each genotype separately on the same UMAP embedding, pseudo-colored by density. F. Trajectory analysis applied to scRNAseq of WT, Klf4−/−, and Zfp281−/− cells. Inset shows cells colored by scored expression for States 1, 2, and 3 (see Methods). See also Fig. S8E–F. G. Proportion of WT, Klf4−/−, and Zfp281−/− cells along each segment of the trajectory. Proportions shown are the rolling average of 500 cells. See also Fig. S8G.
FIGURE 7:
FIGURE 7:. Klf4 and Zfp281 exert opposing effects on cell state kinetics
A. Single Klf4−/− or Zfp281−/− mESC were cloned, grown for 7 days, and colonies analyzed by flow cytometry for distribution of cell state. WT mESC from Fig. 1C shown for comparison. B. 150,000 cells per States 1–3 were isolated by flow cytometric sorting from WT, Klf4−/−, and Zfp281−/− mESCs. Sorted populations were analyzed every 2 days for mESC proportions in each cell state. Data represent mean ± SEM of three biological replicates. C. State proportions in WT, Klf4−/−, and Zfp281−/− mESCs from Fig. 7B were fit using a stochastic 3-state model to infer switching rates. k12 refers to the rate of switching from State 1 to State 2, k13 refers to the rate of switching from State 1 to State 3, and so forth. Significantly altered rates of switching (see Methods) are highlighted.

References

    1. Abranches E, Guedes AMV, Moravec M, Maamar H, Svoboda P, Raj A, and Henrique D (2014). Stochastic NANOG fluctuations allow mouse embryonic stem cells to explore pluripotency. Development 141, 2770–2779. 10.1242/dev.108910. - DOI - PMC - PubMed
    1. Acampora D, Omodei D, Petrosino G, Garofalo A, Savarese M, Nigro V, di Giovannantonio LG, Mercadante V, and Simeone A (2016). Loss of the Otx2-Binding Site in the Nanog Promoter Affects the Integrity of Embryonic Stem Cell Subtypes and Specification of Inner Cell Mass-Derived Epiblast. Cell Rep 15, 2651–2664. 10.1016/j.celrep.2016.05.041. - DOI - PubMed
    1. Acampora D, Giovanni Di Giovannantonio L, Garofalo A, Nigro V, Omodei D, Lombardi A, Zhang J, Chambers I, and Simeone A (2017). Functional Antagonism between OTX2 and NANOG Specifies a Spectrum of Heterogeneous Identities in Embryonic Stem Cells. Stem Cell Reports 9, 1642–1659. 10.1016/j.stemcr.2017.09.019. - DOI - PMC - PubMed
    1. Aksoy I, Giudice V, Delahaye E, Wianny F, Aubry M, Mure M, Chen J, Jauch R, Bogu GK, Nolden T, et al. (2014). Klf4 and Klf5 differentially inhibit mesoderm and endoderm differentiation in embryonic stem cells. Nat Commun 5, 3719. 10.1038/ncomms4719. - DOI - PubMed
    1. Andersson R, and Sandelin A (2020). Determinants of enhancer and promoter activities of regulatory elements. Nat Rev Genet 21, 71–87. 10.1038/s41576-019-0173-8. - DOI - PubMed

Publication types