. 2022 Dec 14;30(12):1745-1758.e7.
doi: 10.1016/j.chom.2022.10.012. Epub 2022 Oct 21.

Antigenic cartography of well-characterized human sera shows SARS-CoV-2 neutralization differences based on infection and vaccination history

Affiliations

Antigenic cartography of well-characterized human sera shows SARS-CoV-2 neutralization differences based on infection and vaccination history

Wei Wang et al. Cell Host Microbe. .

Abstract

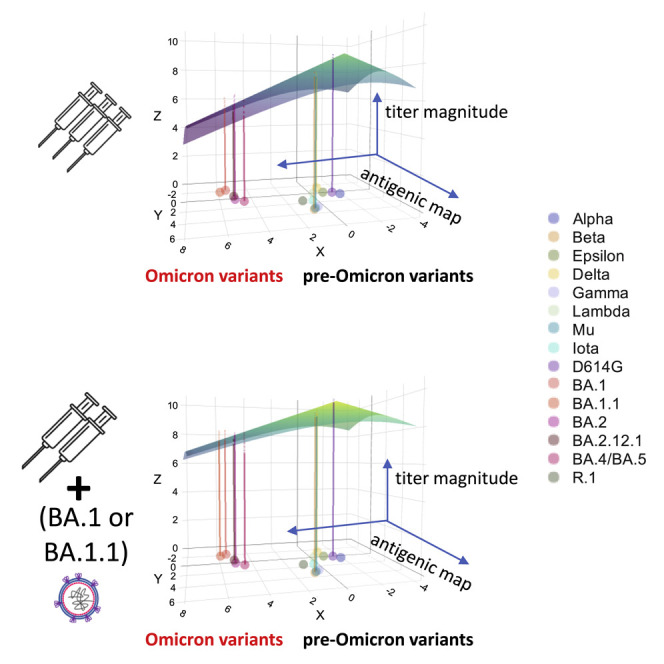
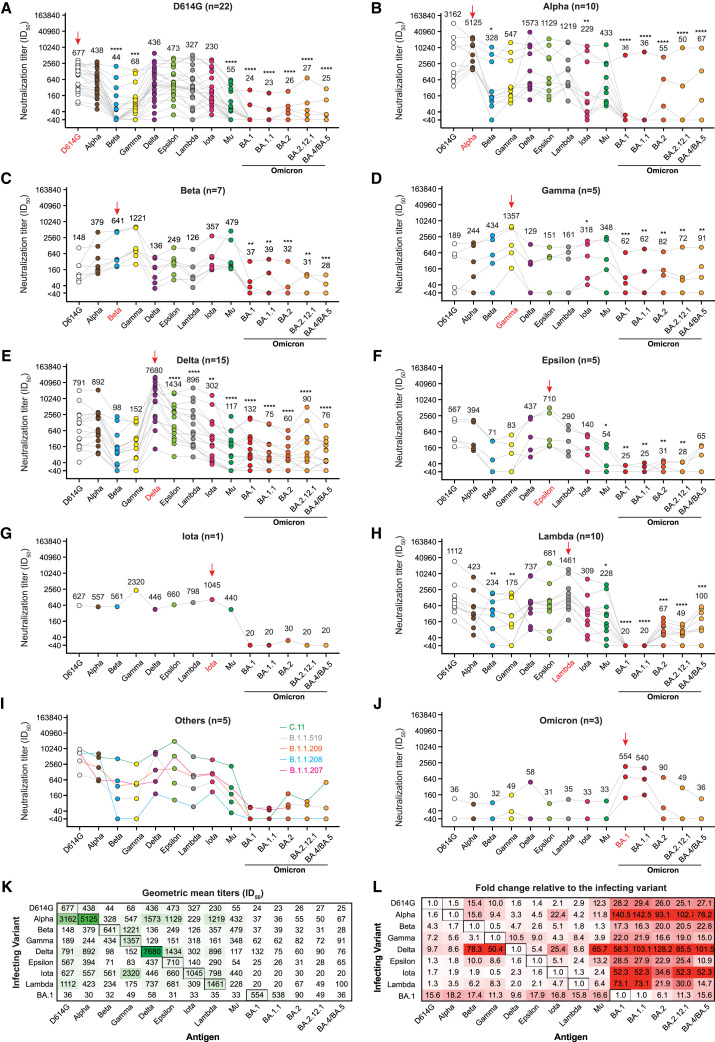
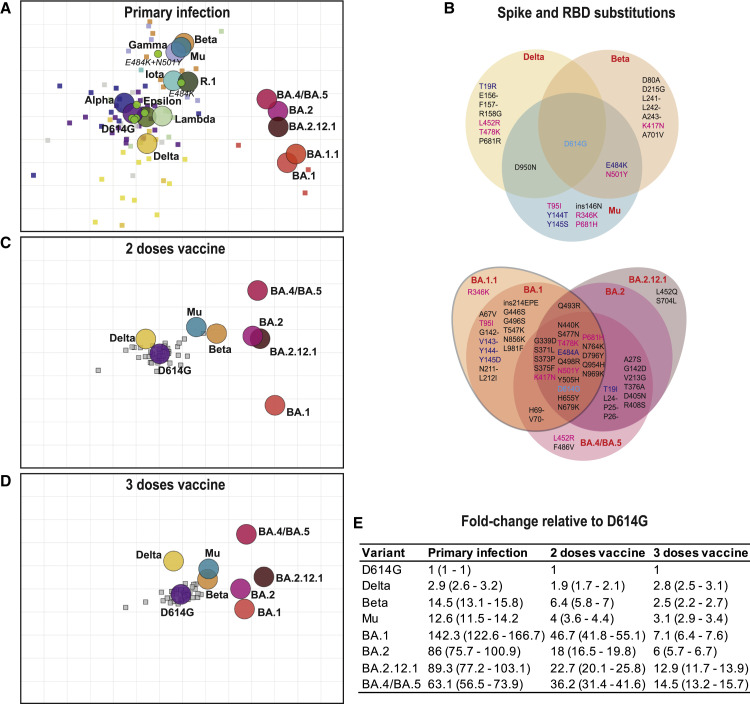
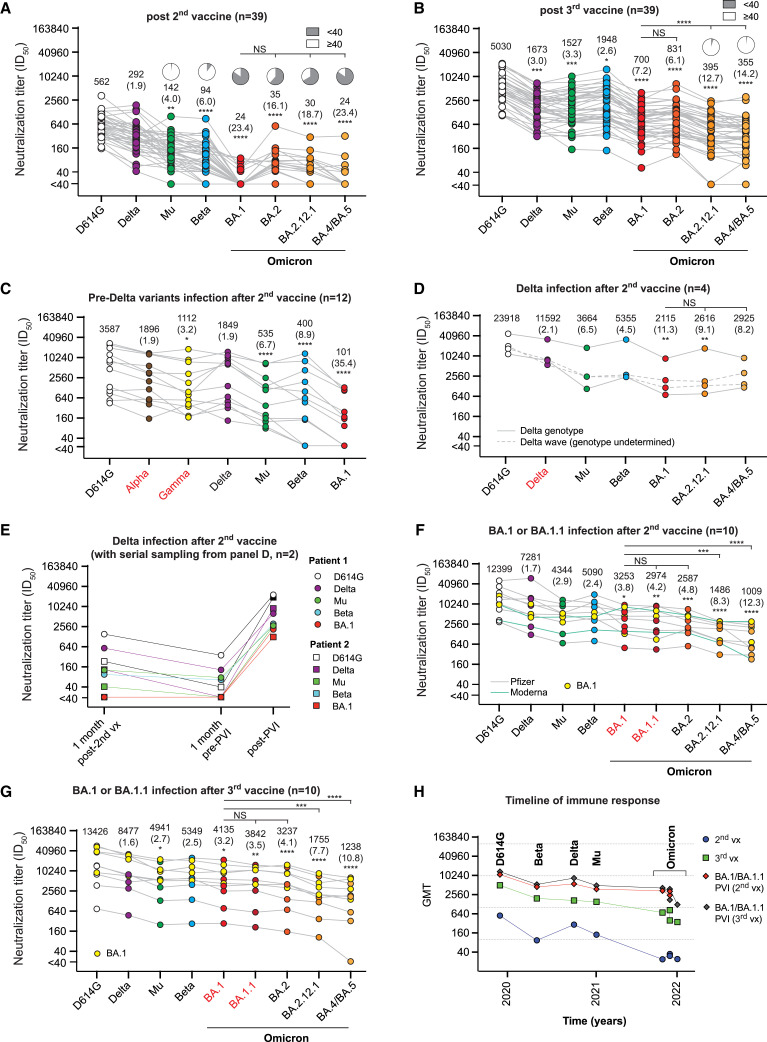
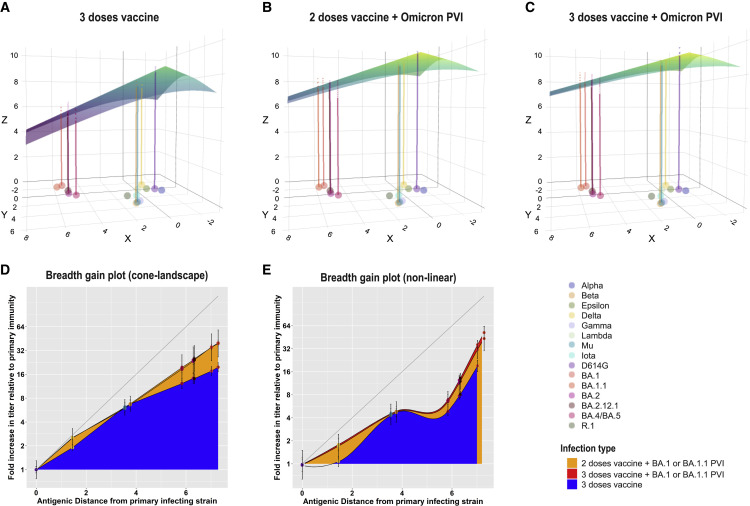
The rapid emergence of SARS-CoV-2 variants challenges vaccination strategies. Here, we collected 201 serum samples from persons with a single infection or multiple vaccine exposures, or both. We measured their neutralization titers against 15 natural variants and 7 variants with engineered spike mutations and analyzed antigenic diversity. Antigenic maps of primary infection sera showed that Omicron sublineages BA.2, BA.4/BA.5, and BA.2.12.1 are distinct from BA.1 and more similar to Beta/Gamma/Mu variants. Three mRNA COVID-19 vaccinations increased neutralization of BA.1 more than BA.4/BA.5 or BA.2.12.1. BA.1 post-vaccination infection elicited higher neutralization titers to all variants than three vaccinations alone, although with less neutralization to BA.2.12.1 and BA.4/BA.5. Those with BA.1 infection after two or three vaccinations had similar neutralization titer magnitude and antigenic recognition. Accounting for antigenic differences among variants when interpreting neutralization titers can aid the understanding of complex patterns in humoral immunity that informs the selection of future COVID-19 vaccine strains.

Keywords: COVID-19 vaccine; Omicron; SARS-CoV-2; SARS-CoV-2 variants; antigenic cartography; antigenic landscape; cartography; hybrid immunity; mRNA vaccine; spike.


Conflict of interest statement

Declaration of interests S.D.P., T.H.B, D.R.T., J.S.R., and M.P.S. report that the Uniformed Services University (USU) Infectious Diseases Clinical Research Program (IDCRP), a US Department of Defense institution, and the Henry M. Jackson Foundation (HJF) were funded under a Cooperative Research and Development Agreement to conduct an unrelated phase III COVID-19 monoclonal antibody immunoprophylaxis trial sponsored by AstraZeneca. The HJF, in support of the USU IDCRP, was funded by the Department of Defense Joint Program Executive Office for Chemical, Biological, Radiological, and Nuclear Defense to augment the conduct of an unrelated phase III vaccine trial sponsored by AstraZeneca. Both trials were part of the U.S. Government COVID-19 response. Neither is related to the work presented here.

Figures

None
Graphical abstract
Figure 1
Figure 1
Neutralization antibody titers (ID50 values) against SARS-CoV-2 variant pseudoviruses for primary infection sera from individuals infected by a major SARS-CoV-2 variant (A–J) Sera from (A) wild-type variant (D614G), (B) Alpha, (C) Beta, (D) Gamma, (E) Delta, (F) Epsilon, (G) Iota, (H) Lambda, (I) other variants, and (J) Omicron (BA.1 or BA.1.1). Each gray line corresponds to one serum sample. The red arrow denotes the infecting variant. Geometric mean neutralization titers (GMTs) are listed for each variant. Significance values for each variant are shown relative to the infecting variant. (K) GMTs from (A)–(J) for sera from the infecting variants (rows) against all measured antigens (columns). Cells are shaded based on GMT, and serum-antigen pairs with larger titers have darker shades of green. (L) Fold reduction in titer for each serum-antigen pair relative to the titer of the infecting variant (boxed in black). Each cell value represents the average fold change across all serum samples with the same exposure history, and darker red cells denote larger relative reductions in titer. For all neutralization assays, serum was diluted 1:40 followed by 3-fold serial dilutions. Neutralization assays were performed twice, each with an intra-assay duplicate. Neutralization curves were fitted using nonlinear dose-response regression. Titers measuring below the lowest serum dilution of 1:40 were treated as 20 for statistical analysis. Statistical analysis was performed on the paired samples using the Friedman test, followed by post hoc Dunn’s multiple comparison tests. p values for comparisons between the groups are shown, where p ≤ 0.05, ∗∗p ≤ 0.01, ∗∗∗p ≤ 0.001, and ∗∗∗∗p ≤ 0.0001.
Figure 2
Figure 2
Antigenic maps made with neutralization titers from single-antigen exposure sera demonstrate that BA.1, BA.2, BA.2.12.1, and BA.4/BA.5 are most antigenically distinct from other major variants (A–D) Antigenic maps were made using antigenic cartography with titers for (A) sera collected after convalescent primary infection with distinct variants and sera from uninfected individuals who received (C) two doses or (D) three doses of mRNA COVID-19 vaccines. Each grid-square side corresponds to a 2-fold dilution in the pseudovirus neutralization assay. Antigenic distance is measured in any direction on the grid. Antigens are shown as circles and labeled. Sera are shown as squares and are colored by infecting variant. (B) Substitutions in the spike and receptor binding domains for all variants used in this study. (E) Fold difference in neutralization with 95% confidence intervals from the ancestral strain to each other variant on each map. For example, a fold difference of four corresponds to two grid squares on the antigenic map.
Figure 3
Figure 3
Neutralization titers (ID50 values) against variant pseudoviruses from post-vaccination sera with and without post-vaccination infection (PVI) (A–G) Sera are from individuals who received (A) two doses of an mRNA COVID-19 vaccine or (B) three doses of an mRNA COVID-19 vaccine. Serum samples were obtained about 5–6 weeks following the last vaccine dose. PVI neutralization titers after 2 doses of wild-type mRNA COVID-19 vaccine in individuals infected with the (C) pre-Delta wave (Alpha or Gamma or others), (D and E) Delta, or (F and G) Omicron (BA.1 or BA.1.1) variants. Each gray line corresponds to one serum sample. GMT is listed for each variant. Significance values for each antigen are shown relative to the titer against D614G. Two of the Delta wave PVI serum samples in (D) were measured at multiple time points, shown in (E), from 1 month after the second vaccine dose and 1 month before and after PVI. (F) Shows titers from individuals with an Omicron (BA.1 or BA.1.1) PVI 2–10 months after the second vaccine, whereas (G) shows titers from individuals with an Omicron (BA.1 or BA.1.1) PVI 1–5 months after the third vaccine. (H) The GMT of individual variants after vaccination with or without PVI by timeline. For all neutralization assays, the serum was diluted 1:40 followed by 3-fold serial dilutions. Neutralization assays were performed twice, each with an intra-assay duplicate. Neutralization curves were fitted using nonlinear dose-response regression. Titers measuring below the lowest serum dilution of 1:40 were treated as 20 for statistical analysis. Statistical analysis was performed on the paired samples using the Friedman test, followed by post hoc Dunn’s multiple comparison tests. p values for comparisons between the groups are shown, where p ≤ 0.05, ∗∗p ≤ 0.01, ∗∗∗p ≤ 0.001, and ∗∗∗∗p ≤ 0.0001. NS, no significance; vx, vaccine. Pie charts indicate the percent of serum samples above the lowest tested (1:40). Numbers in parentheses indicate fold reduction in titer relative to D614G.
Figure 4
Figure 4
Antibody landscapes and breadth gain plots show that individuals with PVIs have a large increase in both recognition and magnitude compared with those with three mRNA COVID-19 vaccine doses alone (A–C) Antibody landscapes are shown for individuals with (A) three doses of an mRNA COVID-19 vaccine, (B) two doses of an mRNA COVID-19 vaccine followed by Omicron PVI, and (C) three doses of an mRNA COVID-19 vaccine followed by Omicron PVI. The x and y axis on each landscape correspond to the 2D antigenic map constructed from convalescent sera in Figure 2A, with colored points representing the locations of each measured antigen. The z axis in each landscape represents the interpolated log titer for all individuals with that exposure history against each antigen. The average landscape for each serum group was constructed by fitting landscapes for each individual serum sample assuming that all landscapes with the same infection history have the same slope, with the peak equal to the maximum observed titer value against any one of the measured antigens. The location of the peak titer value was fitted separately for each individual and then subsequently averaged. The colored lines represent the expected average log GMT for individuals with a particular infection history against each measured antigen. The color of the landscape, like the z axis, corresponds to the estimated log GMT across antigenic space. (D) Breadth gain plots of the antibody landscapes in (A)–(C) for vaccinated individuals who received either a third mRNA COVID-19 vaccine dose, an Omicron PVI, or both. The x axis represents the antigenic distance from the primary convalescent sera antigenic map (Figure 2A) between the primary exposure variant and each measured antigen. Each unit on the y axis represents the gain in neutralization against a particular antigen beyond a primary infection response and is used to compare the relative gain in neutralization under different secondary exposure histories. (E) Same as (D), but showing neutralization gain for each set of sera with the same infection history estimated directly from the titer data, with an interpolated loess fit to convey trends. Error bars represent the mean and 95% confidence intervals for each measured antigen. Shading colors denote the type of infecting variant and the number of vaccine doses received.

References

    1. World Health Organization WHO coronavirus (COVID-19) dashboard. 2020. https://covid19.who.int/
    1. Bergeri I., Whelan M., Ware H., Subissi L., Nardone A., Lewis H.C., Li Z., Ma X., Valenciano M., Cheng B., et al. Global epidemiology of SARS-CoV-2 infection: a systematic review and meta-analysis of standardized population-based seroprevalence studies, Jan 2020–Dec 2021. Preprint at medRxiv. 2022 doi: 10.1101/2021.12.14.21267791. - DOI - PMC - PubMed
    1. Pulliam J.R.C., van Schalkwyk C., Govender N., von Gottberg A., Cohen C., Groome M.J., Dushoff J., Mlisana K., Moultrie H. Increased risk of SARS-CoV-2 reinfection associated with emergence of Omicron in South Africa. Science. 2022;376:eabn4947. doi: 10.1126/science.abn4947. - DOI - PMC - PubMed
    1. Wang Q., Guo Y., Iketani S., Nair M.S., Li Z., Mohri H., Wang M., Yu J., Bowen A.D., Chang J.Y., et al. Antibody evasion by SARS-CoV-2 Omicron subvariants BA.2.12.1, BA.4 and BA.5. Nature. 2022;608:603–608. doi: 10.1038/s41586-022-05053-w. - DOI - PMC - PubMed
    1. UK Health Security Agency COVID-19 vaccine surveillance report week 24. 2022. https://assets.publishing.service.gov.uk/government/uploads/system/uploa...

Supplementary concepts