Clinical Trial
. 2023 Mar;615(7953):687-696.
doi: 10.1038/s41586-022-05531-1. Epub 2022 Nov 10.

Non-viral precision T cell receptor replacement for personalized cell therapy

Affiliations
Clinical Trial

Non-viral precision T cell receptor replacement for personalized cell therapy

Susan P Foy et al. Nature. 2023 Mar.

Abstract

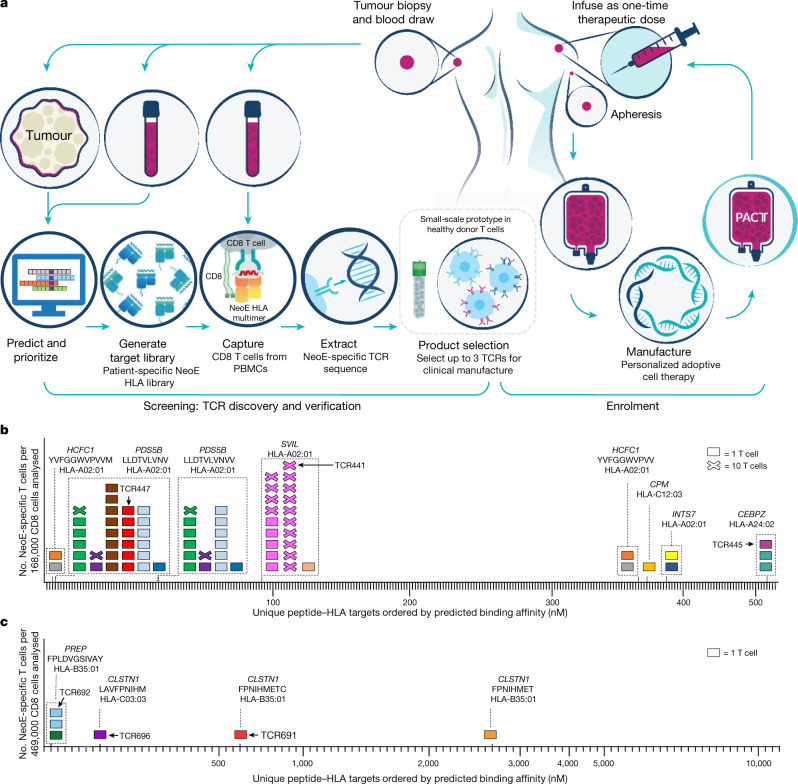
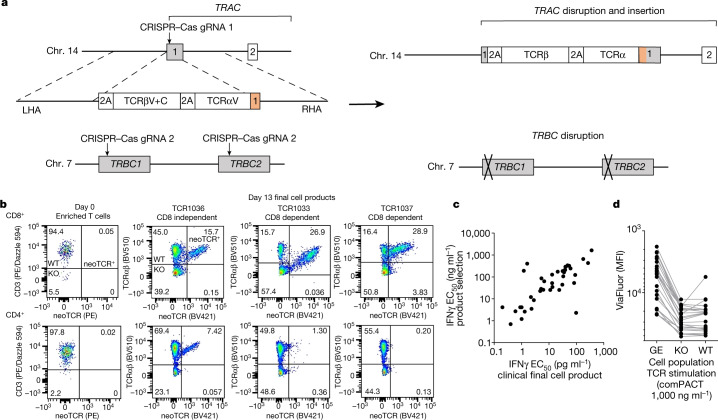
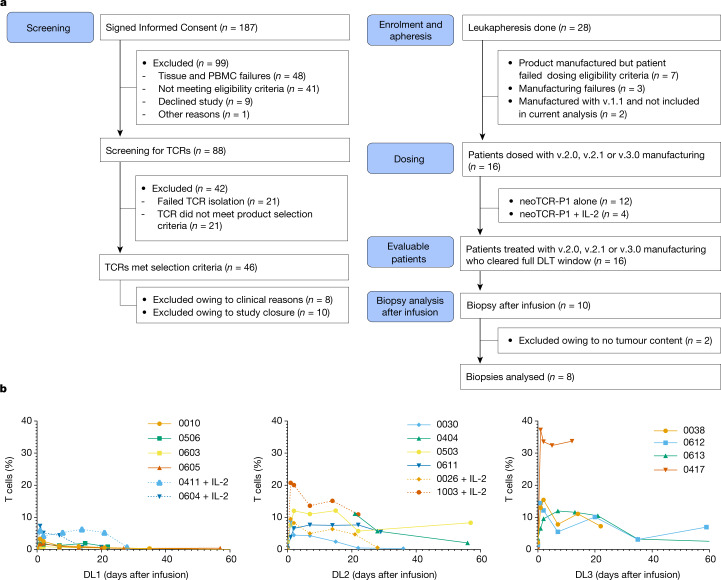
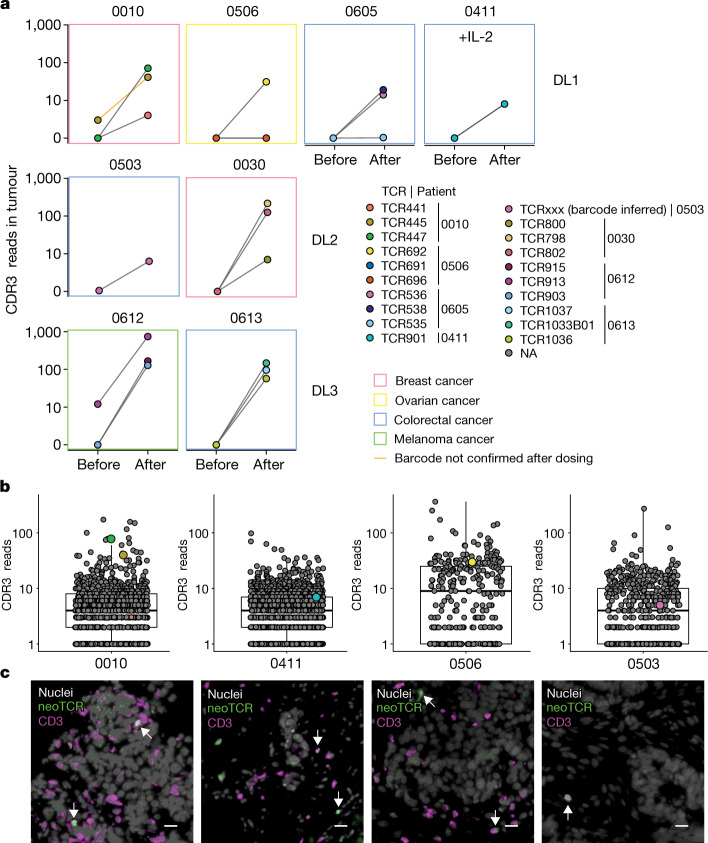
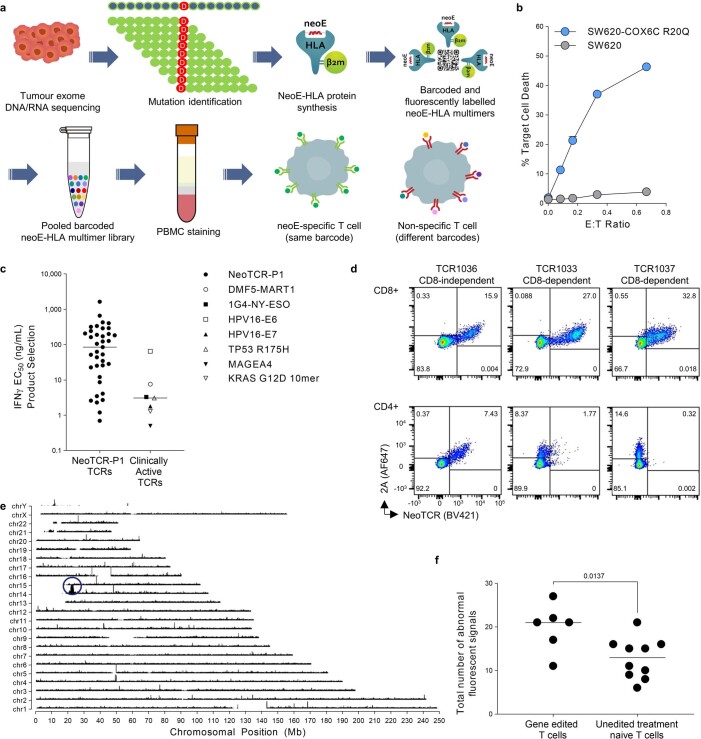
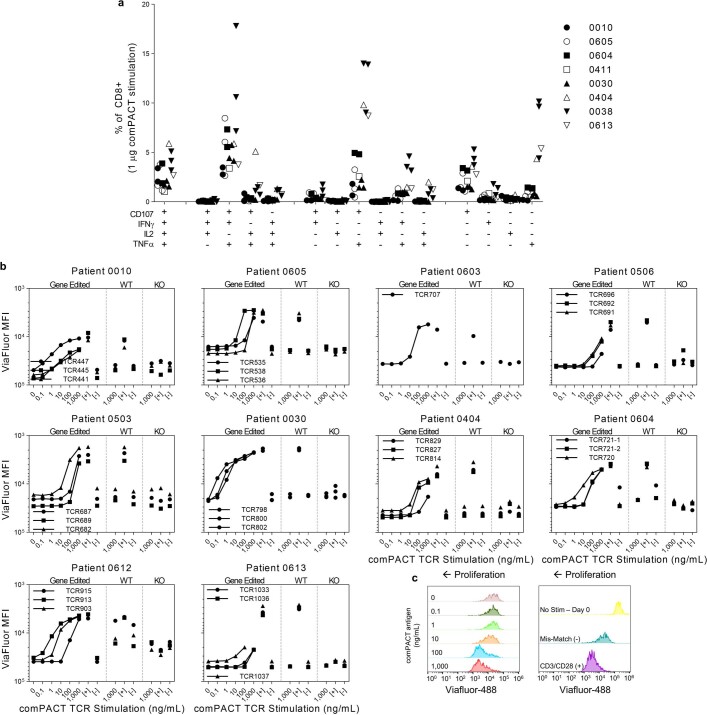
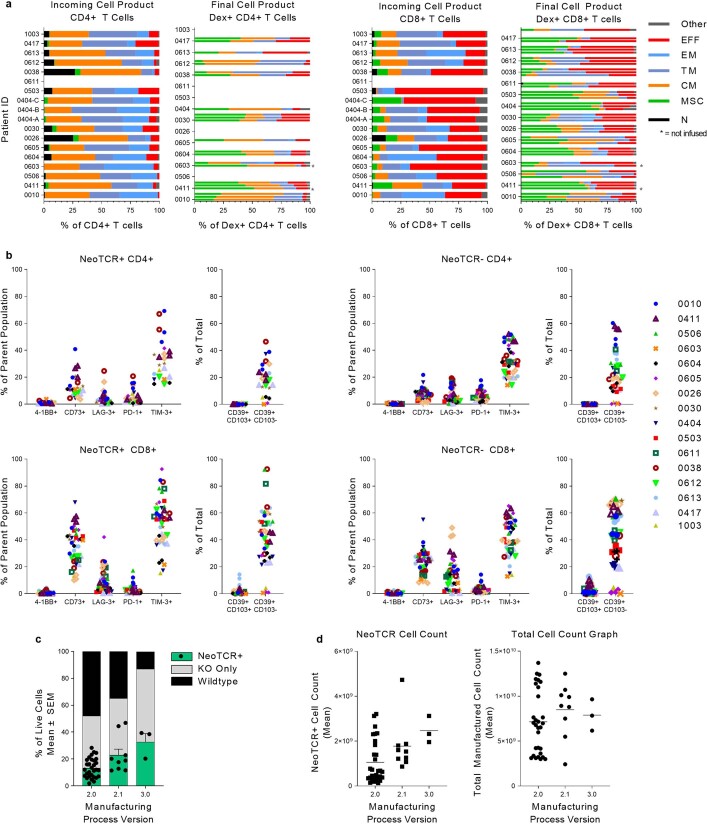
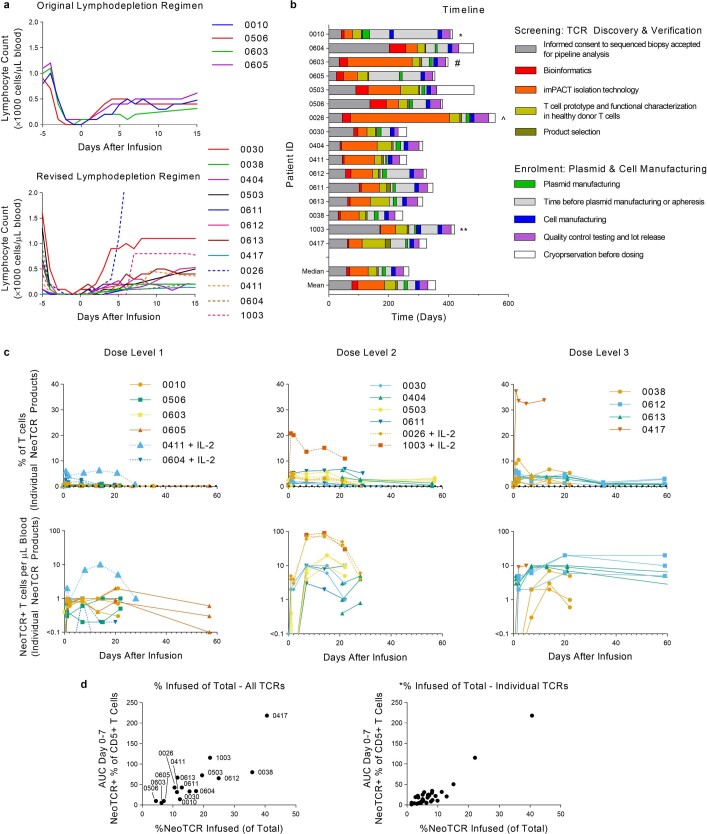
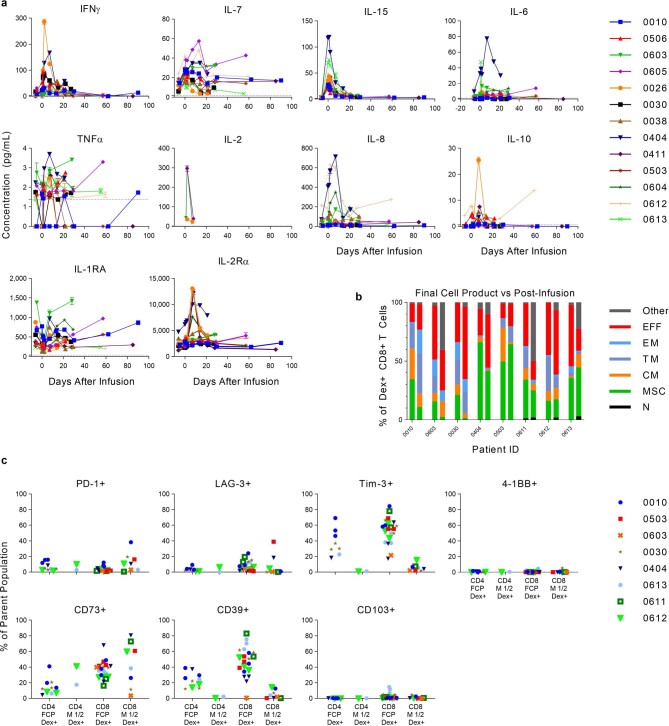
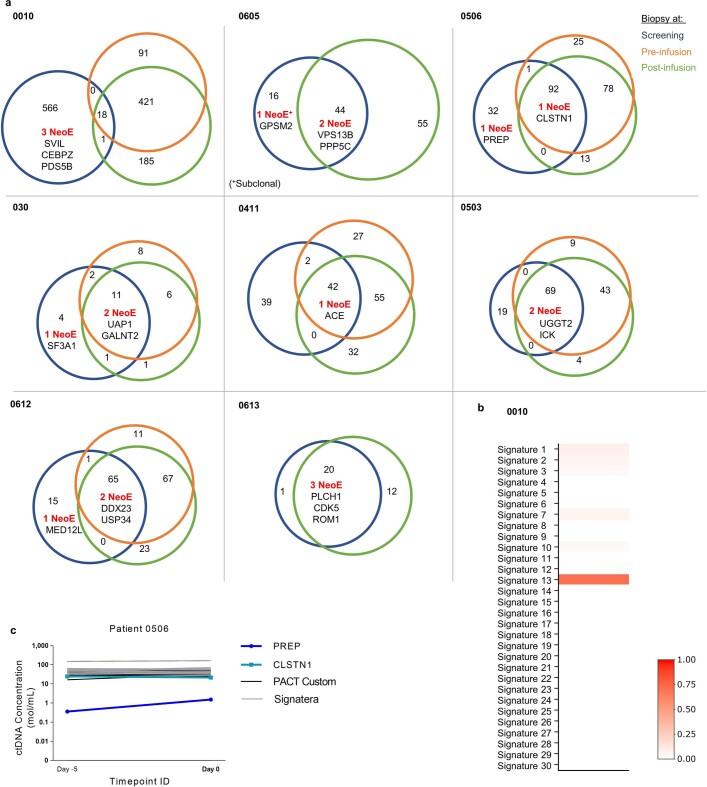
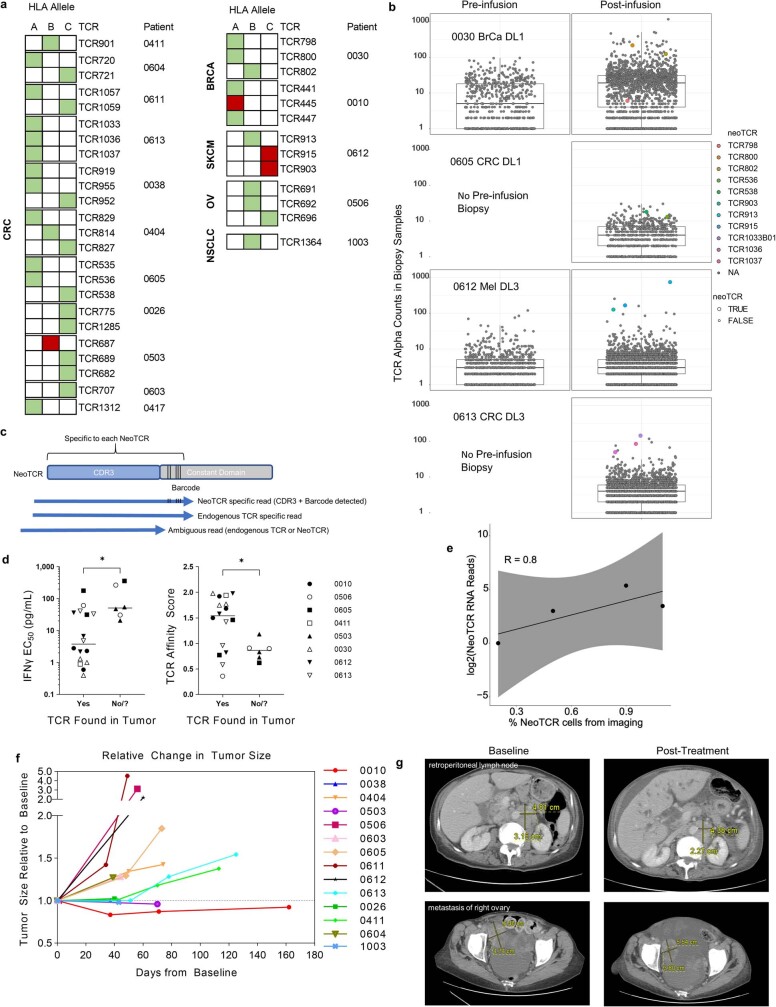
T cell receptors (TCRs) enable T cells to specifically recognize mutations in cancer cells1-3. Here we developed a clinical-grade approach based on CRISPR-Cas9 non-viral precision genome-editing to simultaneously knockout the two endogenous TCR genes TRAC (which encodes TCRα) and TRBC (which encodes TCRβ). We also inserted into the TRAC locus two chains of a neoantigen-specific TCR (neoTCR) isolated from circulating T cells of patients. The neoTCRs were isolated using a personalized library of soluble predicted neoantigen-HLA capture reagents. Sixteen patients with different refractory solid cancers received up to three distinct neoTCR transgenic cell products. Each product expressed a patient-specific neoTCR and was administered in a cell-dose-escalation, first-in-human phase I clinical trial ( NCT03970382 ). One patient had grade 1 cytokine release syndrome and one patient had grade 3 encephalitis. All participants had the expected side effects from the lymphodepleting chemotherapy. Five patients had stable disease and the other eleven had disease progression as the best response on the therapy. neoTCR transgenic T cells were detected in tumour biopsy samples after infusion at frequencies higher than the native TCRs before infusion. This study demonstrates the feasibility of isolating and cloning multiple TCRs that recognize mutational neoantigens. Moreover, simultaneous knockout of the endogenous TCR and knock-in of neoTCRs using single-step, non-viral precision genome-editing are achieved. The manufacture of neoTCR engineered T cells at clinical grade, the safety of infusing up to three gene-edited neoTCR T cell products and the ability of the transgenic T cells to traffic to the tumours of patients are also demonstrated.


Conflict of interest statement

S.P.F., K.J., T.H., Z.P., E.S., Y.M., W.L., S.P., C.L.W., B.Y., O.D., K.H., B.S., A.C., M.T.B., I.M., W.W., M.K., S.G., E.H., A.H., D. An, A.J.L., B.B.Q., C.S., D. Anaya, L.S., E.Y.-H.H., V.M., J.M., L.D., B.P., R.M., M.C.Y., R.F., A.S., T.S.-S., A.F., A.V.R. and S.J.M. were employees of PACT Pharma during the conduct of this work. S.P., M.T.B., D.B., J.R.H. and A.R. are scientific co-founders of PACT Pharma. K.M.C. has received consulting fees from PACT Pharma and Tango Therapeutics and is a shareholder in Geneoscopy. D.Y.O. has received research support from Merck, PACT Pharma, the Parker Institute for Cancer Immunotherapy, Poseida Therapeutics, TCR2 Therapeutics, Roche/Genentech and Nutcracker Therapeutics. B.C. has advisory roles with the following companies: Iovance Biotherapeutics, IDEAYA Biosciences, Sanofi, OncoSec, Nektar, Genentech, Novartis and Instil Bio. D.Y.O. has also received research funding from the following companies: Iovance Biotherapeutics, Bristol-Myers Squibb, Macrogenics, Daiichi Sankyo, Merck, Karyopharm Therapeutics, Infinity Pharmaceuticals, Advenchen Laboratories, Idera, Neon Therapeutics, Xencor, Compugen, PACT Pharma, RAPT Therapeutics, Immunocore, Lilly, IDEAYA Biosciences, Tolero Pharmaceuticals, Ascentage Pharma, Novartis, Atreca, Replimune, Instil Bio, Trisalus and Kinnate. J.A.S. reports honorarium from Iovance, Apixogen, Jazz Pharm, and research with BMS, PACT Pharma and Corvus. A.J.S. reports consulting or advising roles to J&J, KSQ Therapeutics, BMS, Enara Bio, Perceptive Advisors, Heat Biologics and Iovance Biotherapeutics. Research funding: GSK (Inst), PACT pharma (Inst), Iovance Biotherapeutics (Inst), Achilles therapeutics (Inst), Merck (Inst), BMS (Inst), Harpoon Therapeutics (Inst). A.R. has received honoraria from consulting with Amgen, CStone, Merck, and Vedanta, is or has been a member of the scientific advisory board and holds stock in Advaxis, Appia, Apricity, Arcus, Compugen, CytomX, Highlight, ImaginAb, ImmPact, ImmuneSensor, Inspirna, Isoplexis, Kite-Gilead, Lutris, MapKure, Merus, PACT Pharma, Pluto, RAPT, Synthekine and Tango, has received research funding from Agilent and from Bristol-Myers Squibb through Stand Up to Cancer (SU2C), and patent royalties from Arsenal Bio. D.A.B., A.H.C.N., Y.L., M.A., Y.Y. and S.M.L. report no conflicts of interest for this work.

Figures

Fig. 1
Fig. 1. Schematic for TCR discovery to cell manufacture.
a, Generation of the neoTCR product for each patient is separated into two steps: screening and enrolment. Screening begins with the identification of patient tumour-specific mutations based on sequencing data and bioinformatics prediction of mutated neoantigen peptides. Native CD8 T cells that bind neoantigen targets are captured from blood using barcoded and fluorescently labelled peptide–HLA multimers. neoTCR sequences are cloned from captured T cells and functionally characterized in healthy donor T cells before product selection. HR DNA plasmid (or plasmids) encoding the selected neoTCR sequence (or sequences) are then manufactured for subsequent clinical GMP T cell manufacture. Patients are enrolled into the study after product selection. Manufacturing begins with apheresis of the patient’s blood followed by enrichment of CD8 and CD4 T cells. T cells are precision genome-engineered ex vivo to express one neoTCR. Cells are expanded and cryopreserved until the patient is ready for infusion. b,c, Two examples of neoTCR T cells isolated from patient PBMCs. Each box represents one T cell (x = 10 T cells), and each colour represents a TCR clone. T cells within dashed boxes target the same peptide–HLA target. Neoepitope (neoE) amino acid sequences and restricting HLA alleles are indicated on top of the boxes. Peptide–HLA targets are indicated by tick marks. An upward x axis tick indicates peptide–HLA that bound to a patient’s TCR. All T cells shown on the graphs were a non-naive phenotype based on CD95 expression. TCRs indicated with numbers and arrows were selected for clinical-scale manufacture. b, Patient 0010. A total of 262 peptide–HLAs were made, and 236 neoantigen-specific T cells were isolated, representing 15 unique neoTCRs. The neoTCRs targeted six neoantigens across three HLAs. c, Patient 0506. A total of 105 bar-coded peptide–HLAs were made, and 6 neoantigen-specific T cells were captured, representing 5 unique neoTCRs. The neoTCRs targeted three neoantigens across two HLAs.
Fig. 2
Fig. 2. Non-viral precision genome-engineering for clinical-grade cell manufacture.
a, Schematic of the construct design and resulting editing. b, Examples of endogenous TCR knockout and knock-in of up to three neoTCRs in a final clinical-grade cell product. Day 0 (left column) shows an example of the same patient’s enriched T cell product but was not stained with the peptide–HLA multimer. Day 13 flow plots (right 3 columns) show the results of each of the 3 neoTCR product lots for that patient. c, TCR functionality (potency) as evaluated by IFNγ production correlates between small-scale products generated from healthy donor T cells and the final large-scale clinical-grade cell product. The functionality of the neoTCR clinical-grade product made for patient autologous cells (IFNγ EC50 values measured by ELISA or ELLA Simple Plex) was correlated with the functionality of the neoTCR product made in healthy donor cells at product selection (IFNγ EC50 values measured by CBA; Pearson’s r = 0.8412, P < 0.0001). d, Proliferation analysis of the final neoTCR clinical-grade cell product following exposure to peptide–HLA stimulation at 1,000 ng ml–1. Each dot represents a unique neoTCR product. KO, knockout of the endogenous TCR only, these cells do not have a TCR on their surface; MFI, mean fluorescence intensity; neoTCR+ or GE, gene-edited knockout of wild-type TCR and knock-in of neoTCR; WT, wild-type, unedited cells expressing the endogenous TCR.
Fig. 3
Fig. 3. Clinical trial patients and samples, and analysis of neoTCR transgenic T cells in blood after infusion.
a, Consolidated standards of reporting trials diagram, with the number of patients who provided consent, continued onto TCR isolation and leukapheresis, had clinical products manufactured for them, were infused with neoTCR transgenic T cells and provided blood and biopsy samples for analyses. DLT, dose-limiting toxicity. b, Expansion and persistence of neoTCR transgenic T cells in peripheral blood of patients, as measured by flow cytometry of stained peptide–HLA multimer cells. Percentages of total T cells from patients in the dose level 1 (DL1), DL2 and DL3 groups are shown. Patients who also received IL-2 therapy are indicated by dotted lines. All available time points were analysed. For patient 0613, 1.3% neoTCR+ cells was measured at day 106 after infusion. The limit of detection is approximately 0.16%.
Fig. 4
Fig. 4. Trafficking of neoTCR transgenic T cells as detected in tumour biopsies.
a, Analysis of all available biopsy samples at baseline (Before) and after infusion (After) for the presence of infused neoTCRs from detected CDR3α and barcoded reads for DL1, DL2 and DL3 with or without IL-2. Colours of the boxes indicate cancer type. One TCR for which the sequencing reads supporting the codon-optimized constant region was not detected is marked with an orange line (patient 0010). NA, not applicable. b, Quantitation of TCR CDR3α reads in biopsy samples from patients after infusion. Dots are labelled both by size (larger if the neoTCR barcode was confirmed) and colour. Coloured dots are CDR3 sequences matching neoTCRs, and grey dots are neoTCR-unrelated CDR3α reads and their relative quantification. Boxes indicate the interquartile range (IQR), the centre line the median, and the whiskers the lowest and highest values within 1.5× the IQR from the first and third quartiles, respectively. c, Spatial profiling of four patients to image neoTCR transgenic T cells in tumours after treatment. Grey, nuclei; green, neoTCR; magenta, CD3. White arrows denote neoTCR T cells. Scale bar, 20 µm.
Extended Data Fig. 1
Extended Data Fig. 1. NeoTCR isolation, cytotoxicity, potency, gene editing and gene insertion.
a) Neoantigen-specific T cell capture. b) NeoTCR specific killing of an SW620 COX6C-R20Q mutant colorectal cancer cell line. Healthy donor T cells engineered to express a neoTCR from the blood of a patient with colorectal cancer targeting the COX6C-R20Q mutation, cocultured with either the parental SW620 cell line (without R20Q mutation), or with SW620-COX6C R20Q. c) Potency (IFNγ EC50) of neoTCRs isolated from the 16 patients compared with seven clinically active TCRs. d) Example gene editing (as measured by staining for 2A peptide) and neoTCR binding on CD4 and CD8 T cells for the three TCRs in a manufactured cell product. TCR1036 showed 2A expression and neoTCR binding of dextramer in CD4 and CD8 T cells, considered CD8-independent. TCR1033 and TCR1037 showed only 2A expression but no neoTCR binding by dextramer when transfected into CD4 T cells, considered CD8-dependent. e) Targeted locus amplification (TLA) was performed on 0010 TCR445 drug product. Primers specific for transgene and integrated transgene were used to amplify TLA processed genomic DNA. High coverage at the chromosome 14 integration site was observed (blue circle), indicating on-target TRAC transgene integration. A similar peak was not observed at chromosome 7, the site of TRBC knockout. f) Six clinical drug products from three patients were analysed using fluorescent in-situ hybridization (FISH) for chromosomal anomalies involving chromosome 7 and chromosome 14. All abnormal signals from each drug product tested were summed and compared to the total number of abnormal signals found in unedited cells from 10 separate donors. A p value was generated using an unpaired two-tailed t-test.
Extended Data Fig. 2
Extended Data Fig. 2. Functionality of neoTCR engineered T cells.
a) Intracellular cytokine staining upon activation with cognate peptide-HLA. NeoTCR T cells produce a polyfunctional cytokine profile on antigen encounter. Cells from the clinical final cell product were stimulated overnight with plate-bound peptide-HLA. Percent of CD8 cells positive for the given markers is shown. b and c) T cells were stained with Viafluor membrane bound dye, stimulated with plate-bound peptide-HLA overnight, and proliferation measured 4 days later. b) Concentration-dependent proliferation of individual patient products. CD3/CD28 stimulation positive control indicated by [+] and mis-match compact negative control (used at 1000 ng/mL) indicated by [−]. Y-axis inverted; increased proliferation has lower ViaFluor MFI signal due to dilution of the dye after cell division. c) Leftward shift in the Viafluor MFI indicates increasing proliferation (left). Mis-matched peptide-HLA served as a negative control, and CD3/CD28 stimulation as a positive control (right).
Extended Data Fig. 3
Extended Data Fig. 3. Characteristics of the manufactured product.
a) Phenotype of CD4+ T cells (left) and CD8+ T cells (right) in incoming leukapheresis and final cell product from dosed patients. Bars represent individual NeoTCR-T cell products for each patient (up-to-3 neoTCRs per patient). For Dex+ CD4+ T cells, only products where the peptide-HLA multimer binds the inserted TCR in the absence of the CD8 co-receptor have data. T cell subset abbreviations are as follows: EFF (effector), EM (effector memory), TM (transitional memory), CM (central memory), MSC (memory stem cell), N (naïve). b) T cell activation and phenotypic markers in the manufactured FCP. Percentage of CD4+ (top) or CD8+ (bottom) NeoTCR+ (left) or NeoTCR- (right) cells in the manufactured product that express the indicated surface markers. For NeoTCR+ CD4+ T cells, only products where the dextramer binds the inserted TCR in the absence of the CD8 co-receptor have data. c) NeoTCR knock-in efficiency of the endogenous TCR improved with changes in the manufacturing process. NeoTCR+ percentages were significantly different with the different process versions (***p = 0.0006 by ANOVA; v2.1 and v3.0 were significantly better than process v2.0: *p = 0.0218 and **p = 0.0029, respectively, by Tukey’s multiple comparisons test, v2.0: n = 30, v2.1: n = 9, v3.0, n = 3). d) Cell counts of neoTCR+ cells (left) and total cells (right) in manufacturing process v2.0 (n = 30) compared to process v2.1 (n = 9) and v3.0 (n = 3). Differences not significant (ns) by one-way ANOVA.
Extended Data Fig. 4
Extended Data Fig. 4. Engineered neoTCR T cell delivery to patients.
a) Absolute lymphocyte counts according to the original conditioning chemotherapy regimen (top), or the revised conditioning chemotherapy regimen (bottom). Patients treated with IL-2 combination therapy are indicated by dotted lines. b) Time to generate neoTCR T cell product for 16 dosed patients, ordered by consent date. * 0010: Due to COVID-19 shutdown in 2020 and updates to the manufacturing process, the patient underwent two apheresis and two manufactures of cell therapy products. # 0603: NeoTCR isolation was done three times for repeated attempts to find neoTCRs available for product selection. ^ 0026: Went through five separate PBMC samples before suitable neoTCRs were identified for product selection. ** 1003: Went through two manufactures of the cell therapy product. c) NeoTCR percentage (top) and counts (bottom) by dose level, separated by individual neoTCR (up to 3 per patient). Peripheral blood analysis of neoTCR cells in patients treated with dose level 1 (left), dose level 2 (centre), and dose level 3 (right). Total number of neoTCR cells was calculated per μL of blood per patient. Count information was not available for all timepoints. Patients treated with IL-2 are shown with dotted lines. d) Gene editing efficiency of final cell product correlates with neoTCR+ cells detected post-infusion. Percent of neoTCR+ cells infused in each patient (left; correlation Pearson r = 0.8463, ****P < 0.0001). Percent of neoTCR+ cells infused per TCR (right; correlation Spearman r = 0.7475, ****P < 0.0001). Area under the curve (AUC) was calculated from day 0 (pre-infusion) up to day 7. Data not shown for patient 0404; no day 0–7 post-infusion samples available.
Extended Data Fig. 5
Extended Data Fig. 5. Post-infusion analysis of T cells in peripheral blood and serum cytokines.
a) Serum cytokine levels measured using the MSD electrochemiluminescence platform. Thirteen cytokines were measured longitudinally. Horizontal dotted lines represent the lower limit of quantification (LLOQ). IL-12 p70 (0411), IL-13 (0612), and GM-CSF (0038) were below the LLOQ for all but one patient (listed in parenthesis) and are not shown. IL-2 was detected only in patients treated with IL-2 combination therapy (0604, 0411, 0026). Samples measured but below LLOQ are entered as 0. No data for patients 0611, 0417 and 1003. b) Analysis of T cell phenotype of the final product and TCR transgenic cells recovered from blood of patients. Phenotype of dextramer+ CD8+ T cells in final cell product (left bars) compared to post-dose samples at 1-2 months after infusion (right bars). Final cell product phenotype shown here is the average of all the patients’ products. c) T cell activation and phenotypic markers in the manufactured product compared to month 1-2 post-dose for a subset of patients. CD4 (left two columns) and CD8 (right two columns) are shown separately.
Extended Data Fig. 6
Extended Data Fig. 6. Longitudinal retrospective analysis of epitope persistence, somatic signatures and ctDNA data.
a) Venn diagrams of patients with longitudinal screening, pre and post infusion biopsies where available showing protein altering mutation overlap and targeted neoantigen persistence patterns. b) Somatic signature analysis of somatic exome mutations and their correlation with known somatic signatures in the COSMIC database. Signature 13 has previously been associated with APOBEC activity. c) Bespoke ctDNA assay for patient 0506 at day −5 and day 0 timepoints showing truncal mutations in gray and targeted neoantigens in aqua and blue respectively. The PREP neoantigen (blue) is detectable by ctDNA and is at lower ctDNA concentrations than predicted truncal mutations.
Extended Data Fig. 7
Extended Data Fig. 7. Tumour biopsy analyses and clinical responses.
a) Retrospective analysis for HLA loss of heterozygosity (LOH, red fill) or no LOH (green fill). Each row is a neoTCR and columns are the HLA allele presenting its targeted epitope (A, B, C). TCGA study codes for the patients’ tumor type are shown on the left. b) TCR and neoTCR CDR3 quantification in baseline and post-infusion biopsies. Absolute TCRα CDR3 reads from TCR assay were plotted. BrCa: Breast Cancer, CRC: Colorectal Cancer, Mel: melanoma; DL1: Dose-level 1, DL3: Dose-level 3. Boxes indicate the interquartile range (IQR); centre line, median; whiskers, lowest and highest values within 1.5x IQR from the first and third quartiles, respectively. c) Schematic of the neoTCR CDR3 and its flanking barcode sequence that can be used to identify endogenous TCR or neoTCR specific reads. d) TCRs with a lower IFNγ EC50 at lot release (left, *p = 0.0265) or higher TCR affinity score (right, *p = 0.0152) were more frequently found in the post-infusion biopsy. Centre line is the median; p-value by un-paired two-tailed t-test. n = 22; 16 found in the tumour, 6 not identified. For patient 0503, only the specific neoTCR sequence could not be determined. e) Correlation of percent of neoTCR cells from imaging versus corresponding sum of neoTCR CDR3 reads detected in post-infusion biopsies. Shaded grey represents the 95% confidence interval. The Pearson correlation coefficient was 0.8. f) Spider plot of the change in the sum of each patient’s index lesions over time, relative to the baseline scan. No tumour assessment data for patient 0030 (skin lesions) or 0417. g) Computed tomography scans for patient 1003 at baseline (day −12, left panel) and on treatment (day 30, right panel).

Comment in

References

    1. Matsushita, H. et al. Cancer exome analysis reveals a T-cell-dependent mechanism of cancer immunoediting. Nature482, 400–404 (2012). 10.1038/nature10755 - DOI - PMC - PubMed
    1. van Rooij, N. et al. Tumor exome analysis reveals neoantigen-specific T-cell reactivity in an ipilimumab-responsive melanoma. J. Clin. Oncol.31, e439–e442 (2013). 10.1200/JCO.2012.47.7521 - DOI - PMC - PubMed
    1. Schumacher, T. N. & Schreiber, R. D. Neoantigens in cancer immunotherapy. Science348, 69–74 (2015). 10.1126/science.aaa4971 - DOI - PubMed
    1. Gros, A. et al. Prospective identification of neoantigen-specific lymphocytes in the peripheral blood of melanoma patients. Nat. Med.22, 433–438 (2016). 10.1038/nm.4051 - DOI - PMC - PubMed
    1. Tran, E. et al. Cancer immunotherapy based on mutation-specific CD4+ T cells in a patient with epithelial cancer. Science344, 641–645 (2014). 10.1126/science.1251102 - DOI - PMC - PubMed

Publication types

MeSH terms

Associated data