Observational Study
. 2023 Mar;23(3):320-330.
doi: 10.1016/S1473-3099(22)00662-4. Epub 2022 Nov 7.

Immunological signature in human cases of monkeypox infection in 2022 outbreak: an observational study

Affiliations
Observational Study

Immunological signature in human cases of monkeypox infection in 2022 outbreak: an observational study

Chiara Agrati et al. Lancet Infect Dis. 2023 Mar.

Abstract

Background: An unprecedented global monkeypox outbreak started in May, 2022. No data are yet available about the dynamics of the immune response against monkeypox virus. The aim of this study was to describe kinetics of T-cell response, inflammatory profile, and pox-specific T-cell induction in patients with laboratory-confirmed monkeypox.

Methods: 17 patients with laboratory-confirmed monkeypox admitted at the Lazzaro Spallanzani National Institute for Infectious Diseases (Rome, Italy), from May 19, to July 7, 2022, were tested for differentiation and activation profile of CD4 and CD8 T (expression of CD38, PD-1, and CD57 assessed by flow cytometry), frequency of pox-specific T cells (by standard interferon-γ ELISpot), and release of interleukin (IL)-1β, IL-6, IL-8, and tumour necrosis factor (TNF) in plasma (by ELISA). All patients were tested 10-12 days after symptoms onset. In a subgroup of nine patients with a laboratory-confirmed monkeypox, the kinetics of the immune response were analysed longitudinally according to timing from symptoms onset and compared with ten healthy donors (ie, health-care workers recruited from the same institution).

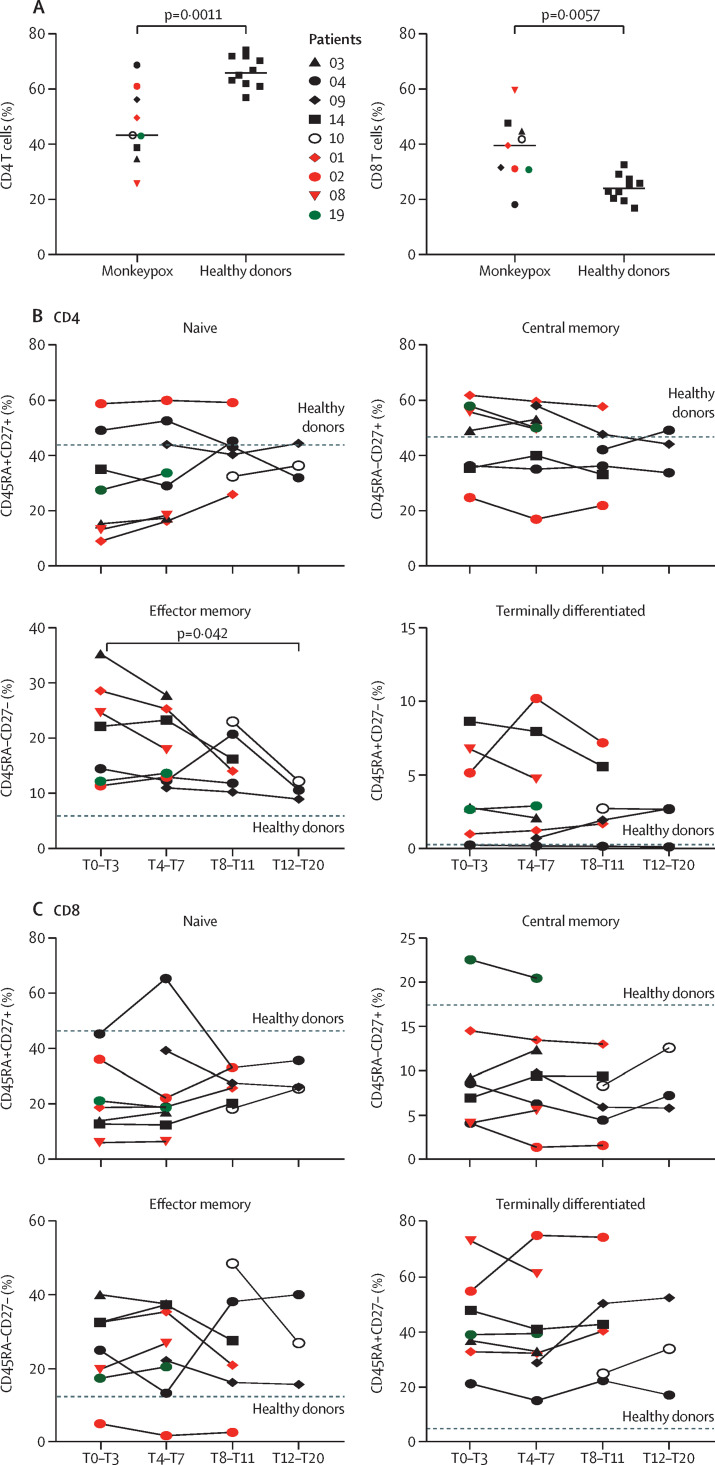
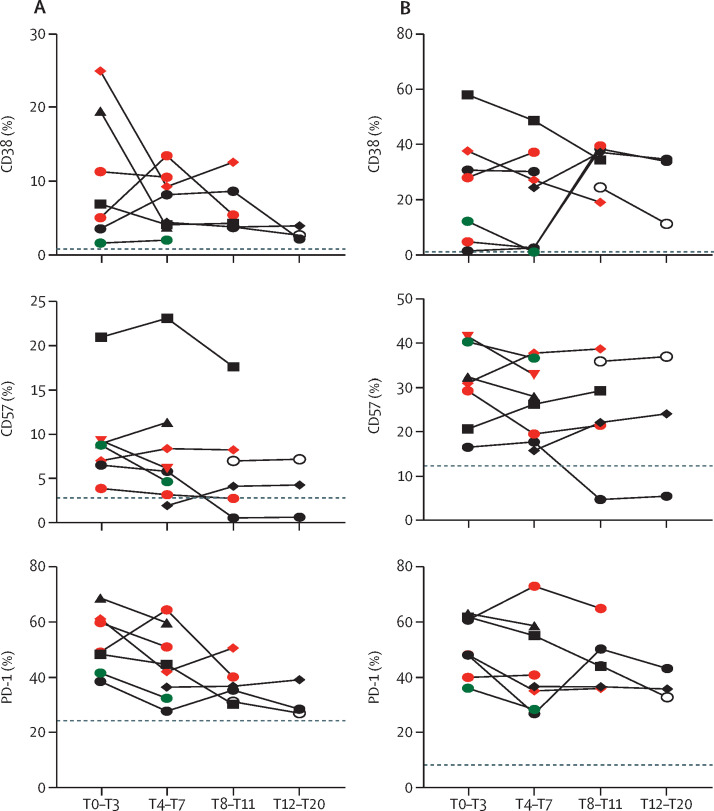
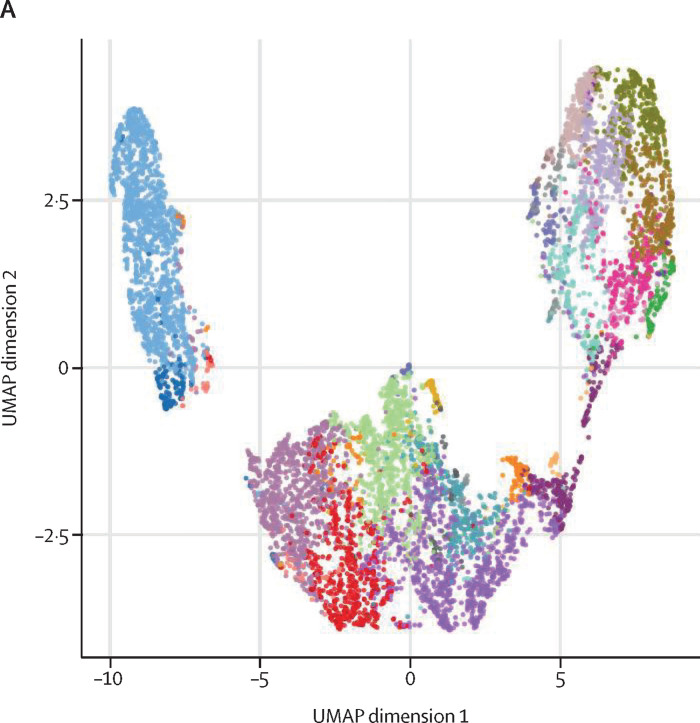
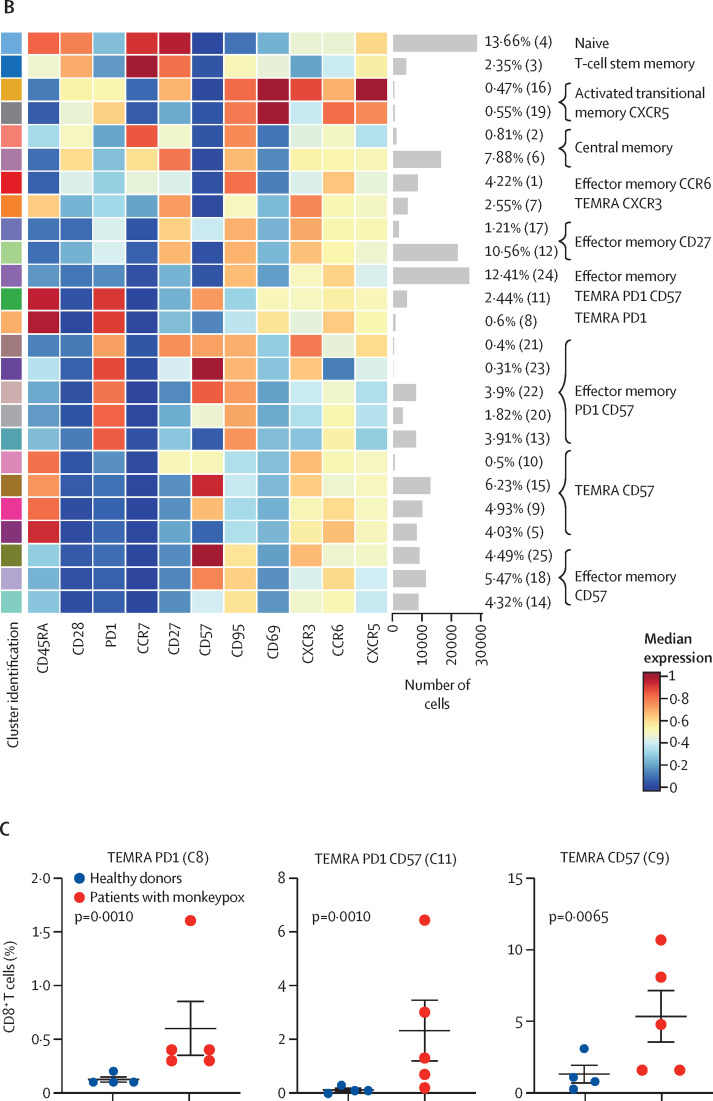
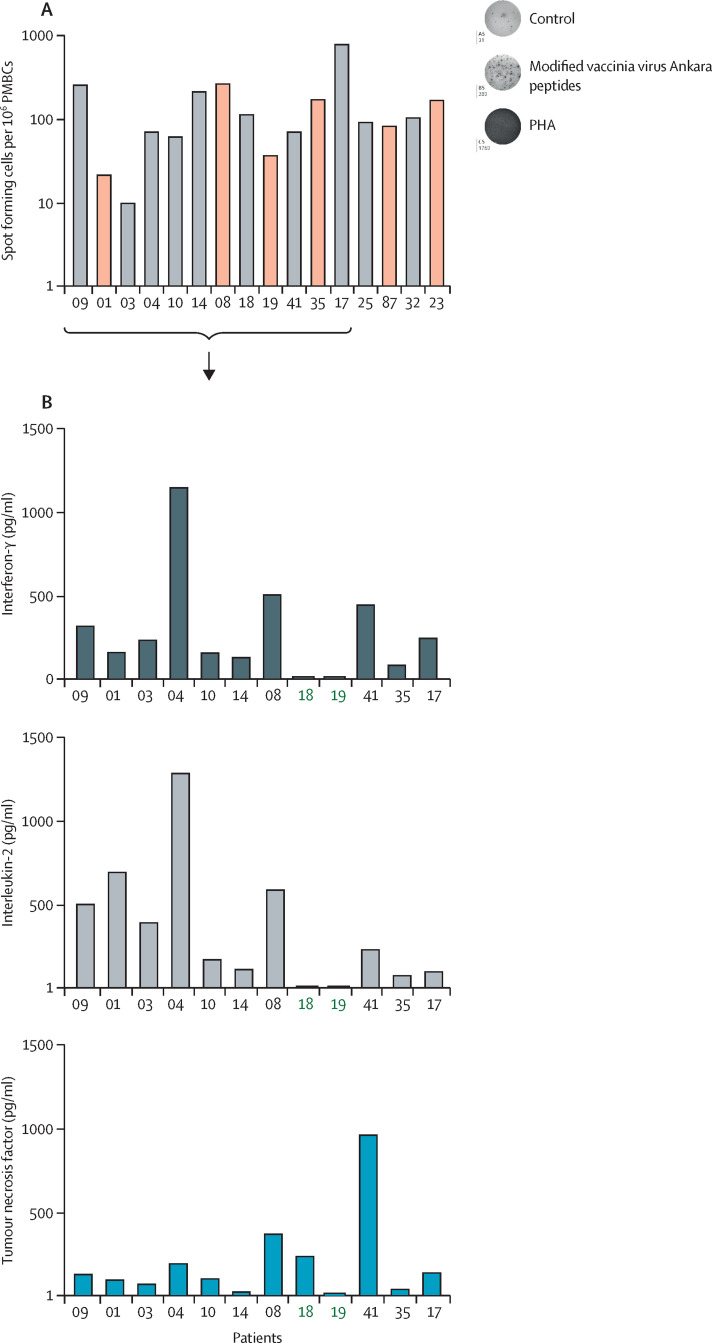
Findings: Among the 17 patients, ten were HIV negative and seven HIV positive, all with good viro-immunological status. On days 0-3 from symptom onset, patients with laboratory-confirmed monkeypox were characterised by a statistically significant reduction in CD4+ T cells (p=0·0011) and a concurrent increase of CD8+ T cells (p=0·0057) compared with healthy donors. A lower proportion of naive (CD45RA+CD27+) CD4+ T cells was observed in six (67%) of nine patients and a concomitant higher proportion of effector memory (CD45RA-CD27-) CD4+ T cells in all patients; this skewed immune profile tended to normalise over time. A similar differentiated profile was also observed in CD8+ T cells with a consistent expansion of terminally differentiated CD8+ T cells. Patients with monkeypox had a higher proportion of CD4+CD38+ and CD38+CD8+ T-cells than healthy donors, which normalised after 12-20 days from symptom onset. The expression of PD-1 and CD57 on CD4+ and CD8+ T-cells showed kinetics similar to that observed for CD38. Furthermore, the inflammatory cytokines (IL-1β, IL-6, IL-8, and TNF) were higher in patients with monkeypox than in healthy donors and, although they decreased over time, they remained elevated after recovery. Almost all patients (15 [94%] of 16) developed a pox-specific Th1 response. No differences in immune cells profile were observed between patients with and without HIV, whereas paucysimptomatic patients (without systemic symptoms, with less than five skin lesions, and no other mucosal localisation of monkeypox) showed a less perturbed immune profile early after symptom onset.

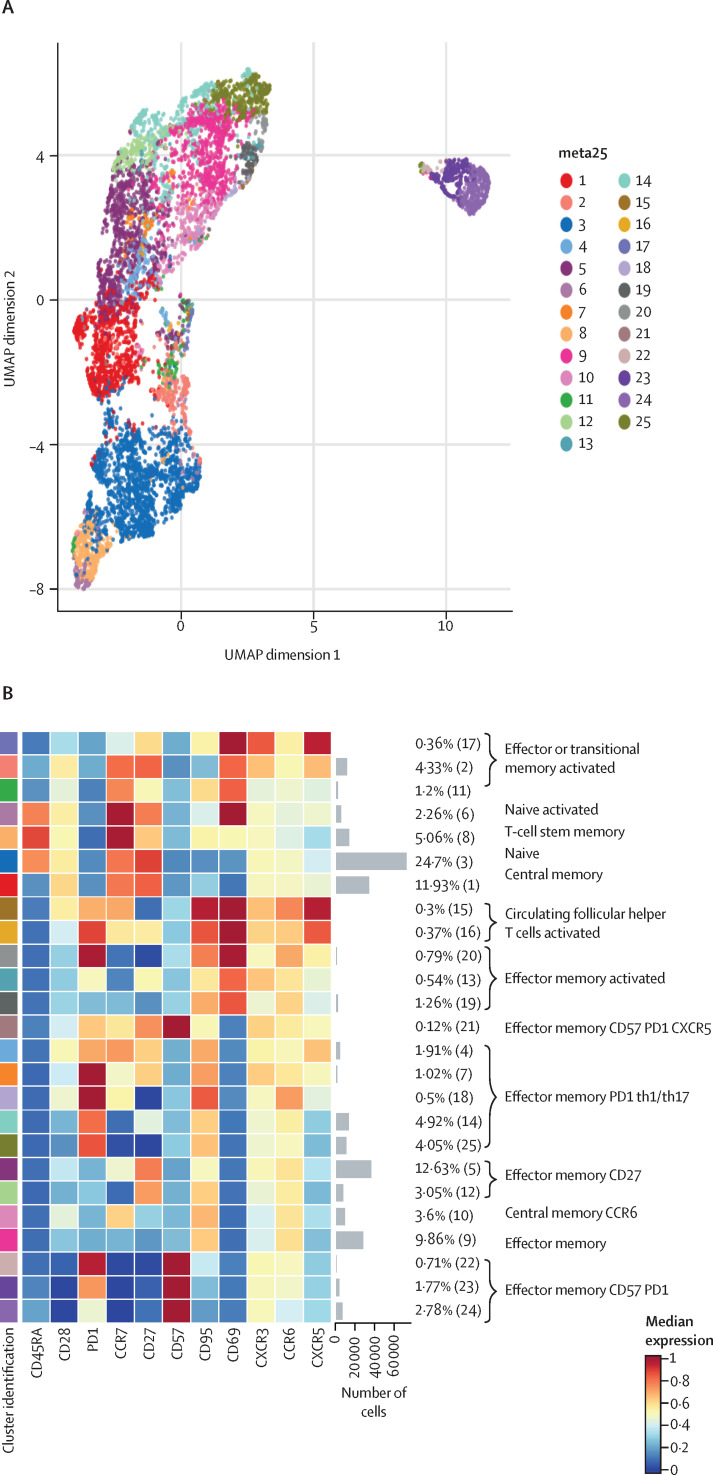
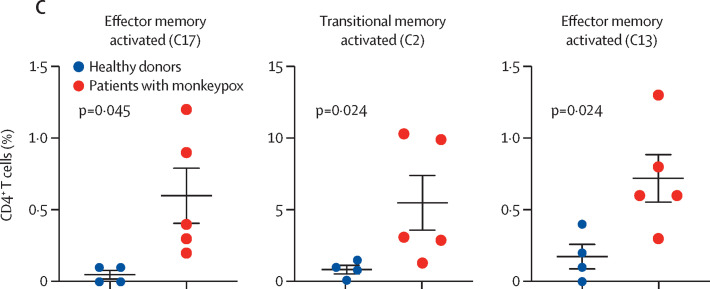
Interpretation: Our data showed the immunological signature of monkeypox virus infection, characterised by an early expansion of activated effector CD4+ and CD8+ T cells that persisted over time. Almost all patients, even regardless of HIV infection, developed a poxvirus-specific Th1 cell response. These results might have implications on the expected immunogenicity of monkeypox vaccination, suggesting that it might not be necessary to vaccinate people who have already been infected.

Funding: Italian Ministry of Health.

Translation: For the Italian translation of the abstract see Supplementary Materials section.


Conflict of interest statement

Declaration of interests We declare no competing interests.

Figures

Figure 1
Figure 1
Kinetic of the differentiation profile of CD4+ and CD8+ T cells during monkeypox virus infection (A) Comparison of CD4+ and CD8+ T-cell frequency between patients with monkeypox (n=9) and healthy donors (n=10); statistical analysis was performed by Mann-Whitney test. (B, C) Analysis of naive (CD45RA+CD27+), central memory (CD45RA–CD27+), effector memory (CD45RA–CD27–), and terminally differentiated (CD45RA+CD27–) CD4+ and CD8+ T cells was performed by flow cytometry. The dashed line identified the median proportion of cells of healthy donors sampled at a single timepoint (n=10). Green dots identify paucisymptomatic patients; the red dots identify HIV-positive patients. Statistical analysis was done with Wilcoxon test. The number next to the dots represent the participant identification number as shown in the table.
Figure 2
Figure 2
Kinetic profile of the activation or senescence profile of CD4+ and CD8+ T cells during monkeypox virus infection Expression of activation or senescence markers on CD4+ (A) and CD8+ T cells (B; CD38, PD-1, CD57) was performed by flow cytometry in patients with monkeypox. The dashed line identified the median frequency of CD38, PD-1, and CD57 in healthy controls (n=10). Green dots identify paucisymptomatic patients, whereas the red dots identify patients with HIV.
Figure 3
Figure 3
Deep immune profiling of CD4+ T cells (A) Uniform Manifold Approximation and Projection (UMAP) plot shows the 2D spatial distribution of CD4+ T cells from healthy donors (n=4) and patients with monkeypox (n=5) embedded with FlowSOM clusters. The colour of each cluster corresponds to the colour of the heatmap in figure 3B. (B) Heatmap of the median marker intensities of the lineage markers across the 25 cell populations obtained with FlowSOM algorithm. The colours of the cluster identification column correspond to the colours used to label the UMAP plot clusters. The colour in the heatmap is referred to the median of the arcsinh marker expression (0 to 1 scale) calculated over cells from all the samples. Light grey bar along the rows (clusters) and values in brackets indicate the relative sizes of clusters. Each column identifies the expression of a single marker. (C) Relative cell proportion of different clusters between healthy donors (n=4), and Monkeypox patients (n=5). The central bar represents the mean (SD). CD=cluster differentiation. CXCR=chemokine receptors.
Figure 3
Figure 3
Deep immune profiling of CD4+ T cells (A) Uniform Manifold Approximation and Projection (UMAP) plot shows the 2D spatial distribution of CD4+ T cells from healthy donors (n=4) and patients with monkeypox (n=5) embedded with FlowSOM clusters. The colour of each cluster corresponds to the colour of the heatmap in figure 3B. (B) Heatmap of the median marker intensities of the lineage markers across the 25 cell populations obtained with FlowSOM algorithm. The colours of the cluster identification column correspond to the colours used to label the UMAP plot clusters. The colour in the heatmap is referred to the median of the arcsinh marker expression (0 to 1 scale) calculated over cells from all the samples. Light grey bar along the rows (clusters) and values in brackets indicate the relative sizes of clusters. Each column identifies the expression of a single marker. (C) Relative cell proportion of different clusters between healthy donors (n=4), and Monkeypox patients (n=5). The central bar represents the mean (SD). CD=cluster differentiation. CXCR=chemokine receptors.
Figure 4
Figure 4
Deep immune profiling of CD8+ T cells (A) Uniform Manifold Approximation and Projection (UMAP) plot shows the 2D spatial distribution of CD8+ T cells from healthy donors (n=4) and patients with monkeypox (n=5) embedded with FlowSOM clusters. The colour of each cluster corresponds to the colour of the heatmap in figure 4B. (B) Heatmap of the median marker intensities of the lineage markers across the 25 cell populations obtained with FlowSOM algorithm. The colours of cluster identification column correspond to the colours used to label the UMAP plot clusters. The colour in the heatmap is referred to the median of the arcsinh marker expression (0 to 1 scale) calculated over cells from all the samples. Light grey bar along the rows (clusters) and values in brackets indicate the relative sizes of clusters. (C) Relative cell proportion of different clusters between healthy donors (n=4), and Monkeypox patients (n=5). The central bar represents the mean (SD). CD=cluster differentiation. CXCR=chemokine receptors. TEMRA=T effector memory re-expressing CD45RA.
Figure 4
Figure 4
Deep immune profiling of CD8+ T cells (A) Uniform Manifold Approximation and Projection (UMAP) plot shows the 2D spatial distribution of CD8+ T cells from healthy donors (n=4) and patients with monkeypox (n=5) embedded with FlowSOM clusters. The colour of each cluster corresponds to the colour of the heatmap in figure 4B. (B) Heatmap of the median marker intensities of the lineage markers across the 25 cell populations obtained with FlowSOM algorithm. The colours of cluster identification column correspond to the colours used to label the UMAP plot clusters. The colour in the heatmap is referred to the median of the arcsinh marker expression (0 to 1 scale) calculated over cells from all the samples. Light grey bar along the rows (clusters) and values in brackets indicate the relative sizes of clusters. (C) Relative cell proportion of different clusters between healthy donors (n=4), and Monkeypox patients (n=5). The central bar represents the mean (SD). CD=cluster differentiation. CXCR=chemokine receptors. TEMRA=T effector memory re-expressing CD45RA.
Figure 5
Figure 5
Poxvirus-specific T-cell response (A) Poxvirus-specific T-cell analysis in patients with monkeypox 8–10 days after symptoms onset (n=16). (B) Th1 cytokine profile in selected patients with monkeypox (n=12). Green numbers identify paucisymptomatic patients. PMBC=peripheral blood mononuclear cells. PHA=phytohaemagglutinin.

References

    1. Centers for Disease Control. 2022 monkeypox outbreak global map. Sept 20, 2022 (accessed Sept 21, 2022).
    1. Antinori A, Mazzotta C, Vita S, et al. Epidemiological, clinical and virological characteristics of four cases of monkeypox support transmission through sexual contact, Italy, May 2022. Euro Surveill. 2022;27 - PMC - PubMed
    1. Thornhill JP, Barkati S, Walmsley S, et al. Monkeypox virus infection in humans across 16 countries-April–June 2022. N Engl J Med. 2022;387:679–691. - PubMed
    1. Petersen E, Zumla A, Hui DS, et al. Vaccination for monkeypox prevention in persons with high-risk sexual behaviours to control on-going outbreak of monkeypox virus clade 3. Int J Infect Dis. 2022;122:569–571. - PMC - PubMed
    1. Tarín-Vicente EJ, Alemany A, Agud-Dios M, et al. Clinical presentation and virological assessment of confirmed human monkeypox virus cases in Spain: a prospective observational cohort study. Lancet. 2022;400:661–669. - PMC - PubMed

Publication types