. 2022 Aug 1;57(8):780-787.
doi: 10.4085/1062-6050-0026.21.

Preoperative and Postoperative Walking Gait in Women With Acetabular Labral Tears and Femoroacetabular Impingement Syndrome

Affiliations

Preoperative and Postoperative Walking Gait in Women With Acetabular Labral Tears and Femoroacetabular Impingement Syndrome

Bret Freemyer et al. J Athl Train. .

Abstract

Context: Symptomatic femoroacetabular impingement syndrome (FAIS) is a painful condition that leads to decreased function. How walking gait changes over time within the first year after surgery for FAIS and how these changes present in women are currently unknown.

Objective: To determine biomechanical gait differences between women with FAIS or labral tears and control individuals preoperatively and at 3 and 6 months postoperatively.

Design: Case-control study.

Setting: Laboratory.

Patients or other participants: A total of 18 female participants comprising 9 women in the FAIS group (age = 31.44 ± 7.47 years, height = 1.73 ± 0.08 m, mass = 73.61 ± 14.44 kg) and 9 women in the control group (age = 31.44 ± 6.65 years, height = 1.69 ± 0.06 m, mass = 60.93 ± 5.58 kg).

Main outcome measure(s): Between-groups comparisons of the Hip Outcome Score Activities of Daily Living subscale (HOSADL) and gait biomechanics were conducted preoperatively and at the 3- and 6-month postoperative sessions. Statistical parametric mapping was performed on normalized time-series data.

Results: Preoperatively, the FAIS group had poor HOSADL scores (FAIS group = 64.1 ± 15.4 versus control group = 100.0 ± 0, P < .001), walked 15% slower, and exhibited several gait differences compared with the control group. Three months postoperatively, the FAIS group displayed greater vertical ground reaction force (P = .01), ankle-dorsiflexion angle (P = .02), and external dorsiflexion moment (P = .01) in midstance, as well as a greater knee-flexion angle through the second half of stance (P < .001). The FAIS group also demonstrated less hip-extension angle (P = .02) and hip-abduction angle (P = .01) through the second half of stance, which transitioned into less hip extension (P = .040) and hip abduction (P = .03) during the subsequent swing phase. The FAIS group improved their HOSADL to 87.6 ± 7.6 by 6 months postoperatively and had a greater dorsiflexion moment (P = .003) and ankle external rotation during stance (P = .03). In addition, the FAIS group showed a greater external hip external-rotation moment in late stance (P < .001).

Conclusions: The biomechanical differences between groups were most evident at 3 months postoperatively, suggesting that women with FAIS had more postoperative gait compensations in the short term after surgery. By 6 months postoperatively, patient-reported outcomes had markedly improved, and the FAIS group displayed few gait differences compared with the control group.

Keywords: females; hip arthroscopy.


Figures

Figure 1
Figure 1
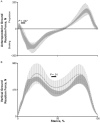
Differences between control and femoroacetabular impingement syndrome (FAIS) groups for A, anteroposterior ground reaction force preoperatively and B, vertical ground reaction force 3 months postoperatively. Black bars with P values indicate regions of significant statistical parametric mapping analyses. Normalized mean (line) and SDs (shading) represent control (solid line indicates mean; diagonal shading indicates SD) and FAIS (dashed line indicates mean; vertical shading indicates SD) groups.
Figure 2
Figure 2
Differences in ankle biomechanics between control and femoroacetabular impingement syndrome (FAIS) groups for, A, sagittal-plane external ankle moment at 3 months postoperatively, B, sagittal-plane ankle angle at 3 months postoperatively, C, sagittal-plane external ankle moment at 6 months postoperatively, and, D, transverse-plane ankle angle at 6 months postoperatively. Black bars with P values indicate regions of significant statistical parametric mapping (SPM){t} analyses. Normalized mean (line) and SDs (shading) represent control (solid line indicates mean; diagonal shading indicates SD) and FAIS (dashed line indicates mean; vertical shading indicates SD) groups.
Figure 3
Figure 3
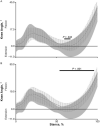
Differences between control and femoroacetabular impingement syndrome (FAIS) groups for sagittal-plane knee angle, A, preoperatively, and B, 3 months postoperatively. Black bars with P values indicate regions of significant statistical parametric mapping analyses. Normalized mean (line) and SDs (shading) represent control (solid line indicates mean; diagonal shading indicates SD) and FAIS (dashed line indicates mean; vertical shading indicates SD) groups.
Figure 4
Figure 4
Differences in hip biomechanics during stance between control and femoroacetabular impingement syndrome (FAIS) groups for A, sagittal-plane hip angle at 3 months; B, frontal-plane hip angle at 3 months; C, transverse-plane hip external moment at 3 months; and D, external transverse-plane hip moment at 6 months. Black bars with P values indicate regions of significant statistical parametric mapping analyses. Normalized mean (line) and SDs (shading) represent control (solid line indicates mean; diagonal shading indicates SD) and FAIS (dashed line indicates mean; vertical shading indicates SD) groups.
Figure 5
Figure 5
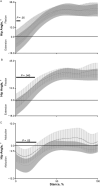
Differences in hip kinematics during swing between control and femoroacetabular impingement syndrome (FAIS) groups for A, sagittal-plane hip angle preoperatively; B, sagittal-plane hip angle 3 months postoperatively; and C, frontal-plane hip angle 3 months postoperatively. Black bars with P values indicate regions of significant statistical parametric mapping analyses. Normalized mean (line) and SDs (shading) represent control (solid line indicates mean; diagonal shading indicates SD) and FAIS (dashed line indicates mean; vertical shading indicates SD) groups.

References

    1. Ganz R, Parvizi J, Beck M, Leunig M, Nötzli H, Siebenrock KA. Femoroacetabular impingement: a cause for osteoarthritis of the hip. Clin Orthop Relat Res . 2003;(417):112–120. doi: 10.1097/01.blo.0000096804.78689.c2. - DOI - PubMed
    1. Beck M, Kalhor M, Leunig M, Ganz R. Hip morphology influences the pattern of damage to the acetabular cartilage: femoroacetabular impingement as a cause of early osteoarthritis of the hip. J Bone Joint Surg Br . 2005;87(7):1012–1018. doi: 10.1302/0301-620X.87B7.15203. - DOI - PubMed
    1. Leunig M, Casillas MM, Hamlet M, et al. Slipped capital femoral epiphysis: early mechanical damage to the acetabular cartilage by a prominent femoral metaphysis. Acta Orthop Scand . 2000;71(4):370–375. doi: 10.1080/000164700317393367. - DOI - PubMed
    1. Bedi A, Dolan M, Magennis E, Lipman J, Buly R, Kelly BT. Computer-assisted modeling of osseous impingement and resection in femoroacetabular impingement. Arthroscopy . 2012;28(2):204–210. doi: 10.1016/j.arthro.2011.11.005. - DOI - PubMed
    1. Bedi A, Thompson M, Uliana C, Magennis E, Kelly BT. Assessment of range of motion and contact zones with commonly performed physical exam manoeuvers for femoroacetabular impingement (FAI): what do these tests mean. Hip Int . 2013;23(suppl 9):S27–S34. doi: 10.5301/hipint.5000060. - DOI - PubMed

LinkOut - more resources