Fertilization mode differentially impacts the evolution of vertebrate sperm components
- PMID: 36357384
- PMCID: PMC9649735
- DOI: 10.1038/s41467-022-34609-7
Fertilization mode differentially impacts the evolution of vertebrate sperm components
Abstract
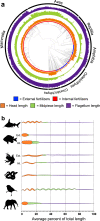
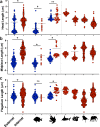
Environmental change frequently drives morphological diversification, including at the cellular level. Transitions in the environment where fertilization occurs (i.e., fertilization mode) are hypothesized to be a driver of the extreme diversity in sperm morphology observed in animals. Yet how fertilization mode impacts the evolution of sperm components-head, midpiece, and flagellum-each with different functional roles that must act as an integrated unit remains unclear. Here, we test this hypothesis by examining the evolution of sperm component lengths across 1103 species of vertebrates varying in fertilization mode (external vs. internal fertilization). Sperm component length is explained in part by fertilization mode across vertebrates, but how fertilization mode influences sperm evolution varies among sperm components and vertebrate clades. We also identify evolutionary responses not influenced by fertilization mode: midpieces evolve rapidly in both external and internal fertilizers. Fertilization mode thus influences vertebrate sperm evolution through complex component- and clade-specific evolutionary responses.
© 2022. The Author(s).
Conflict of interest statement
The authors declare no competing interests.
Figures


Similar articles
-
Fertilization mode drives sperm length evolution across the animal tree of life.Nat Ecol Evol. 2021 Aug;5(8):1153-1164. doi: 10.1038/s41559-021-01488-y. Epub 2021 Jun 21. Nat Ecol Evol. 2021. PMID: 34155385
-
Sperm competition and fertilization mode in fishes.Philos Trans R Soc Lond B Biol Sci. 2020 Dec 7;375(1813):20200074. doi: 10.1098/rstb.2020.0074. Epub 2020 Oct 19. Philos Trans R Soc Lond B Biol Sci. 2020. PMID: 33070731 Free PMC article. Review.
-
Repeated evidence that the accelerated evolution of sperm is associated with their fertilization function.Proc Biol Sci. 2020 Aug 12;287(1932):20201286. doi: 10.1098/rspb.2020.1286. Epub 2020 Aug 5. Proc Biol Sci. 2020. PMID: 32752988 Free PMC article.
-
Evolution of genes involved in gamete interaction: evidence for positive selection, duplications and losses in vertebrates.PLoS One. 2012;7(9):e44548. doi: 10.1371/journal.pone.0044548. Epub 2012 Sep 5. PLoS One. 2012. PMID: 22957080 Free PMC article.
-
Atypical Centriolar Composition Correlates with Internal Fertilization in Fish.Cells. 2022 Feb 22;11(5):758. doi: 10.3390/cells11050758. Cells. 2022. PMID: 35269380 Free PMC article. Review.
Cited by
-
Tetrapod sperm length evolution in relation to body mass is shaped by multiple trade-offs.Nat Commun. 2024 Jul 22;15(1):6160. doi: 10.1038/s41467-024-50391-0. Nat Commun. 2024. PMID: 39039080 Free PMC article.
-
Label-free metabolic fingerprinting of motile mammalian spermatozoa with subcellular resolution.BMC Biol. 2025 Mar 24;23(1):85. doi: 10.1186/s12915-025-02167-1. BMC Biol. 2025. PMID: 40128804 Free PMC article.
-
The ancient and helical architecture of Elasmobranchii's spermatozoa enables progressive motility in viscous environments.PLoS One. 2025 Feb 25;20(2):e0319354. doi: 10.1371/journal.pone.0319354. eCollection 2025. PLoS One. 2025. PMID: 39999125 Free PMC article.
-
On the Origin and Evolution of Sperm Cells.Cells. 2022 Dec 30;12(1):159. doi: 10.3390/cells12010159. Cells. 2022. PMID: 36611950 Free PMC article.
-
Characterization of sperm and implications for male fertility in the last of the Rhynchocephalians.Conserv Physiol. 2023 Aug 30;11(1):coad071. doi: 10.1093/conphys/coad071. eCollection 2023. Conserv Physiol. 2023. PMID: 37663926 Free PMC article.
References
-
- Schluter D, Nychka D. Exploring fitness surfaces. Am. Nat. 1994;143:597–616.
-
- Winkelmann K, Genner MJ, Takahashi T, Rüber L. Competition-driven speciation in cichlid fish. Nat. Commun. 2014;5:3. - PubMed
-
- Stroud JT, Losos JB. Ecological opportunity and adaptive radiation. Annu. Rev. Ecol. Evol. Syst. 2016;47:507–532.
-
- Sherratt E, Vidal-García M, Anstis M, Keogh JS. Adult frogs and tadpoles have different macroevolutionary patterns across the Australian continent. Nat. Ecol. Evol. 2017;1:1385–1391. - PubMed
Publication types
MeSH terms
LinkOut - more resources
Full Text Sources

