Clinical Trial
. 2022 Nov 10;13(1):6797.
doi: 10.1038/s41467-022-34419-x.

An alternative splicing modulator decreases mutant HTT and improves the molecular fingerprint in Huntington's disease patient neurons

Affiliations
Clinical Trial

An alternative splicing modulator decreases mutant HTT and improves the molecular fingerprint in Huntington's disease patient neurons

Florian Krach et al. Nat Commun. .

Abstract

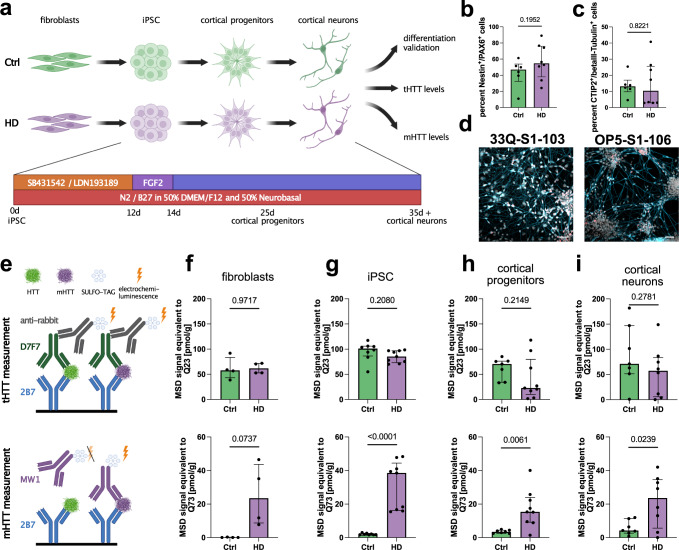
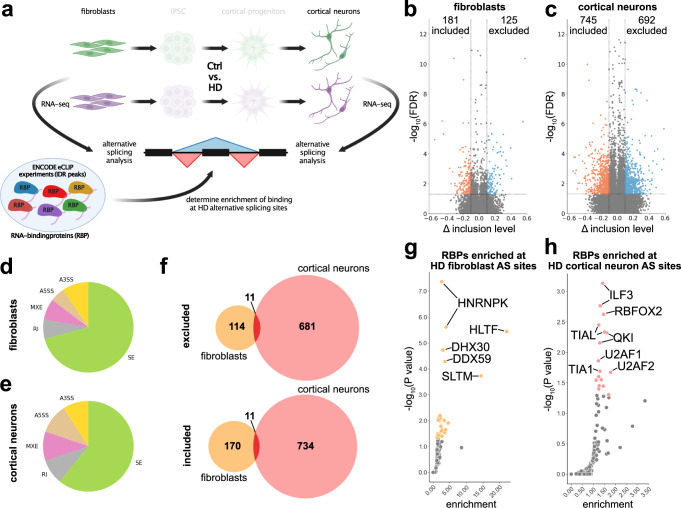
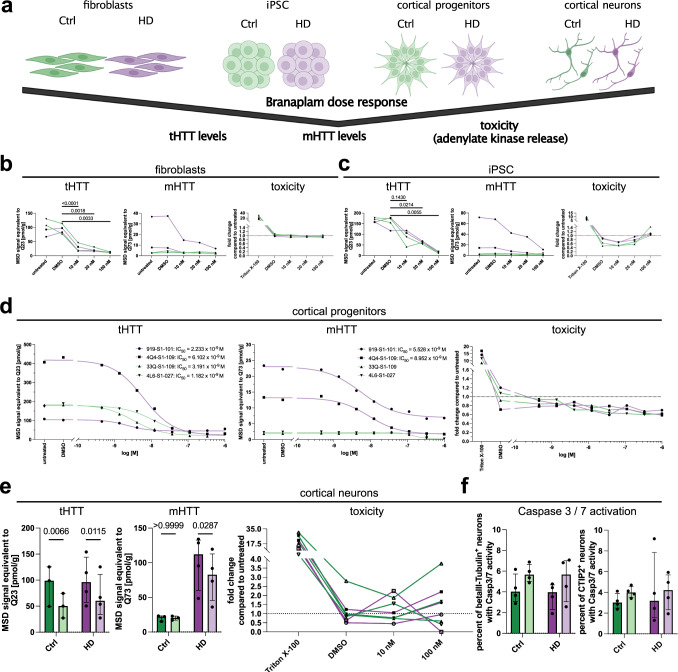
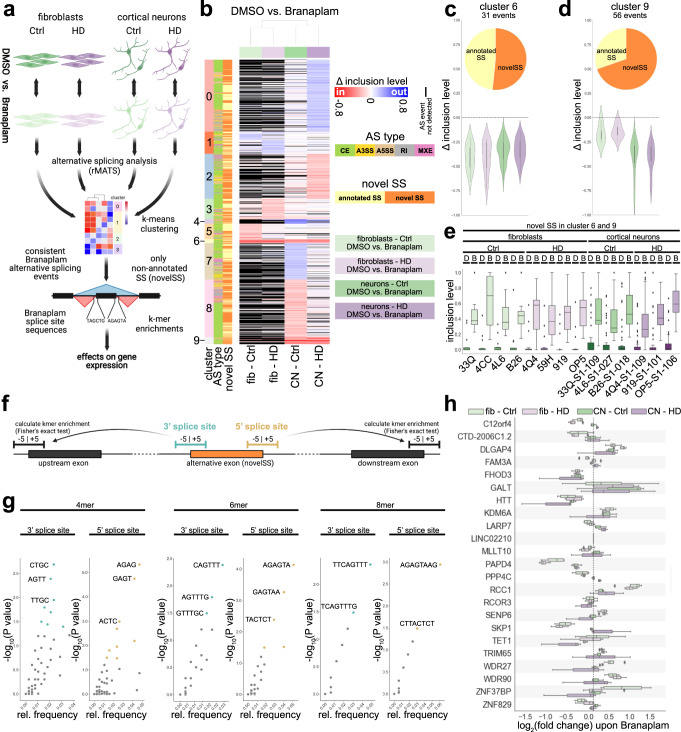
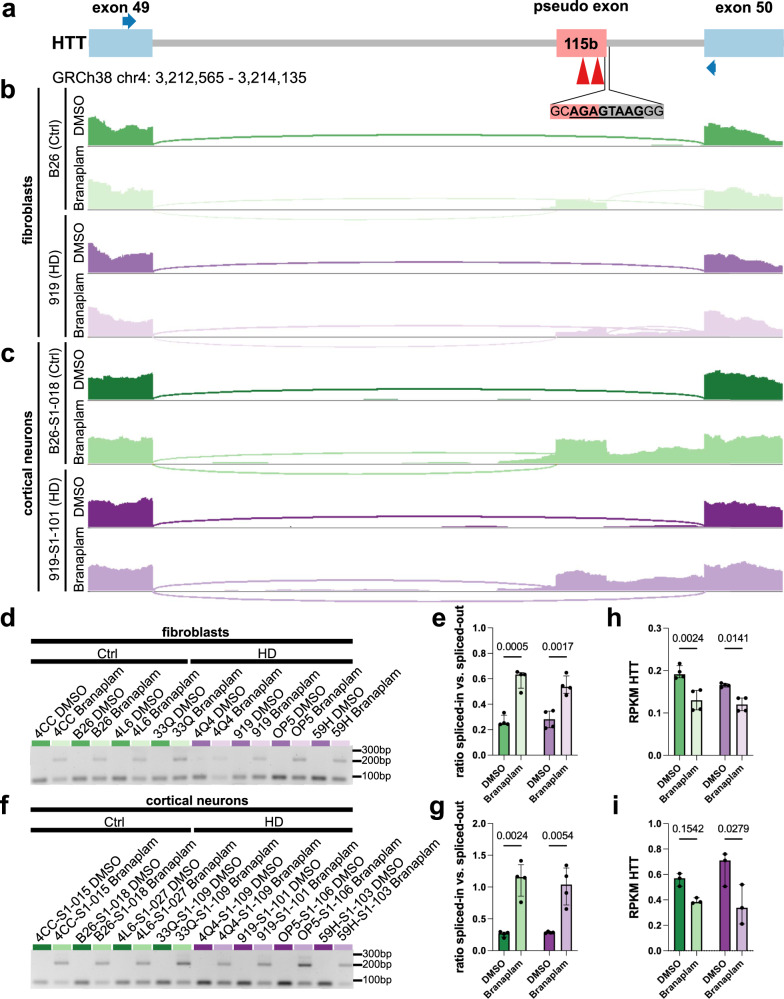
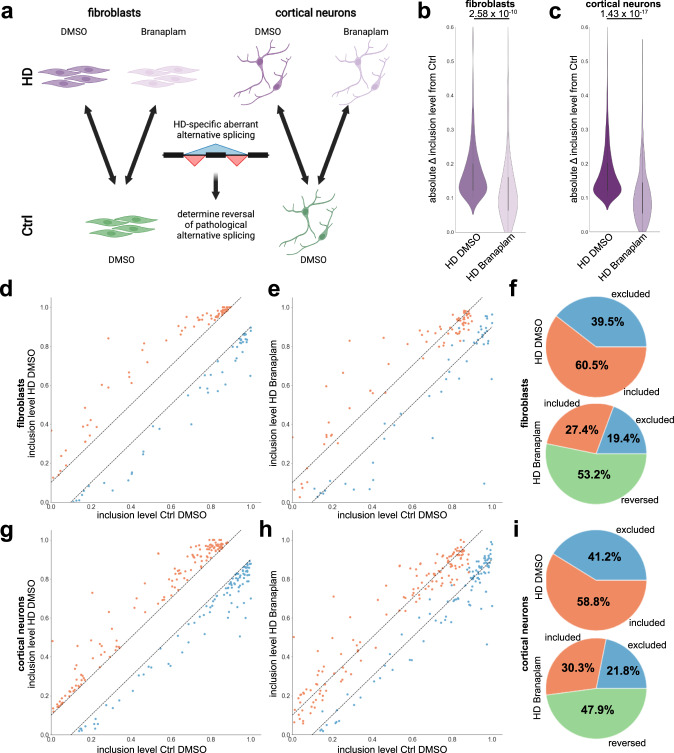
Huntington's disease (HD) is a neurodegenerative disorder caused by poly-Q expansion in the Huntingtin (HTT) protein. Here, we delineate elevated mutant HTT (mHTT) levels in patient-derived cells including fibroblasts and iPSC derived cortical neurons using mesoscale discovery (MSD) HTT assays. HD patients' fibroblasts and cortical neurons recapitulate aberrant alternative splicing as a molecular fingerprint of HD. Branaplam is a splicing modulator currently tested in a phase II study in HD (NCT05111249). The drug lowers total HTT (tHTT) and mHTT levels in fibroblasts, iPSC, cortical progenitors, and neurons in a dose dependent manner at an IC50 consistently below 10 nM without inducing cellular toxicity. Branaplam promotes inclusion of non-annotated novel exons. Among these Branaplam-induced exons, there is a 115 bp frameshift-inducing exon in the HTT transcript. This exon is observed upon Branaplam treatment in Ctrl and HD patients leading to a profound reduction of HTT RNA and protein levels. Importantly, Branaplam ameliorates aberrant alternative splicing in HD patients' fibroblasts and cortical neurons. These findings highlight the applicability of splicing modulators in the treatment of CAG repeat disorders and decipher their molecular effects associated with the pharmacokinetic and -dynamic properties in patient-derived cellular models.


Conflict of interest statement

The authors declare no competing interests.

Figures

Fig. 1
Fig. 1. Mutant HTT is increased in HD patient-derived cells using an MSD assay.
a Paradigm illustrating the HD patient-based disease model (fibroblasts, iPSC, cortical progenitors (25d old), and cortical neurons (35d old)) and readouts. Created with BioRender.com. b Bar plot depicting FACS quantification of NESTIN/PAX6 double-positive cells. Statistics: Welch’s test. Bars: median ± IQR. c Bar plot illustrating FACS quantification of bIII-Tubulin/CTIP2 double-positive cells. Statistics: Welch’s test. Bars: median ± IQR. d Representative pictures of cortical neurons. Scale bar 50 µm. e Illustration depicting the MSD HTT quantification assay, where the added protein samples bind to 2B7 antibody, used for coating the plates. The SULFO-TAG coupled antibodies D7F7 and MW1 are added for quantification of total HTT and mutant HTT, respectively. Note: numeric values from 2B7/D7F7 assay (total HTT) cannot be directly set in relation to numeric values from 2B7/MW1 assay (mutant HTT). Created with BioRender.com. f Bar plots quantifying total (tHTT, top) and mutant (mHTT, bottom) levels in fibroblasts (4 Ctrl lines, 4 HD lines) with 2B7/D7F7 and 2B7/MW1 MSD assays, respectively. Statistics: tHTT: Welch’s test (P value = 0.9717); mHTT Welch’s test (P value = 0.0737). Bars: median ± IQR. g Bar plots quantifying total (tHTT, top) and mutant (mHTT, bottom) levels in iPSC (8 Ctrl lines, 9 HD lines) with 2B7/D7F7 and 2B7/MW1 MSD assays, respectively. Statistics: tHTT: Welch’s test (P value =  0.2080); mHTT Mann–Whitney test (P value < 0.0001). Bars: median ± IQR. h Bar plots quantifying total (tHTT, top) and mutant (mHTT, bottom) levels in cortical progenitors (7 Ctrl lines, 9 HD lines) with 2B7/D7F7 and 2B7/MW1 MSD assays, respectively. Statistics: tHTT: Welch’s test (P value = 0.2149); mHTT Welch’s test (P value = 0.0061). Bars: median ± IQR. i Bar plots quantifying total (tHTT, top) and mutant (mHTT, bottom) levels in cortical neurons (7 Ctrl lines, 8 HD lines) with 2B7/D7F7 and 2B7/MW1 MSD assays, respectively. Statistics: tHTT: Welch’s test (P value = 0.2781); mHTT Welch’s test (P value = 0.0239). Bars: median ± IQR. Source data are provided as a Source Data file.
Fig. 2
Fig. 2. Aberrant alternative splicing is present in HD patients’ fibroblasts and cortical neurons.
a Paradigm illustrating the analysis of fibroblasts and iPSC-derived cortical neurons (50d old) and integration of publicly available RNA-binding profile data (ENCODE eCLIP-seq) to determine degree and origin of alternative splicing in HD. Created with BioRender.com. b Volcano plot showing inclusion levels difference (x) and significance (y) of alternative splicing events in Ctrl-DMSO vs HD-DMSO fibroblasts. Red: significantly included splicing events; blue: significantly excluded splicing events. Horizontal dashed line: FDR = 0.05; vertical dashed lines at −0.1 and 0.1. c Volcano plot showing inclusion levels difference (x) and significance (y) of alternative splicing events in Ctrl-DMSO vs HD-DMSO iPSC-derived cortical neurons. Red: significantly included splicing events; blue: significantly excluded splicing events. Horizontal dashed line: FDR = 0.05; vertical dashed lines at −0.1 and 0.1. d Pie chart of alternative splicing types in significant HD alternative splicing events in fibroblasts. Green: cassette exons (SE); yellow: alternative 3’ splice site (A3SS); brown: alternative 5’ splice site (A5SS); pink: mutually exclusive exons (MXE); gray: retained introns (RI). e Pie chart of alternative splicing types in significant HD alternative splicing events in iPSC-derived cortical neurons. Green: cassette exons (SE); yellow: alternative 3’ splice site (A3SS); brown: alternative 5’ splice site (A5SS); pink: mutually exclusive exons (MXE); gray: retained introns (RI). f Venn diagram showing overlap of significantly differentially spliced events in HD in fibroblasts and in neurons, respectively. Red depicts overlap between both cell types. Top graph: exon excluded in HD; bottom graph: exon included in HD. g Scatter plot illustrating RNA-binding protein (RBP) RNA-binding enrichment (x) and significance (y) at HD alternative splicing events in fibroblasts. Yellow colored dots depict RBPs with P value ≤ 0.05. h Scatter plot illustrating RNA-binding protein (RBP) RNA-binding enrichment (x) and significance (y) at HD alternative splicing events in iPSC cortical neurons. Salmon-colored dots depict RBPs with P value ≤ 0.05. Source data are provided as a Source Data file.
Fig. 3
Fig. 3. Branaplam reduces total and mutant HTT protein levels in a dose-dependent manner without inducing toxicity.
a Paradigm: cell types and parameters analyzed. Created with BioRender.com. bd tHTT levels (2B7/D7F7 assay), mHTT levels (2B7/MW1 assay) and toxicity (adenylate kinase release, Triton: positive control) in fibroblasts (b), iPSC (c) and cortical progenitors (d) with different Branaplam concentrations for 72 h. Green: Ctrl samples (n = 2 33Q/33Q-S1-109, 4L6/4L6-S1-027), purple: HD samples (n = 2 919/919-S1-101, 4Q4/4Q4-S1-109). b Fibroblasts statistics: tHTT: one-way ANOVA with Geisser–Greenhouse correction (P = 0.0012); mHTT: no statistics applied; toxicity (Triton excluded): Friedman test (P = 0.0770). c iPSC statistics: tHTT one-way ANOVA with Geisser–Greenhouse correction (P = 0.0032); mHTT: no statistics applied; toxicity (Triton excluded): one-way ANOVA with Geisser–Greenhouse correction (P = 0.0455), no significant differences in multiple comparisons. d cortical progenitor statistics: tHTT IC50: 919-S1-101 = 2.233 × 10−9 M; 4Q4-S1-109 = 6.102 × 10−9 M; 33Q-S1-109 = 3.191 × 10−9 M; 4L6-S1-027 = 1.182 × 10−9 M; mHTT: 919-S1-101 = 5.528 × 10−9 M; 4Q4-S1-109 = 8.952 × 10−9 M; 33Q-S1-109 and 4L6-S1-027 = not calculated; toxicity (Triton excluded): one-way ANOVA with Geisser–Greenhouse correction (P = 0.06). e tHTT levels (2B7/D7F7 assay), mHTT levels (2B7/MW1 assay) (Ctrl n = 3; HD n = 4) and toxicity (adenylate kinase release, Triton as positive control) in cortical neurons of (Ctrl n = 4; HD n = 4). tHTT and mHTT measured with DMSO (dark shades) or 10 nM Branaplam (light shades) for 72 h. Statistics: tHTT: 2-way ANOVA (DMSO vs. Branaplam: P = 0.0009; Ctrl vs. HD: P = 0.6820; interaction: P = 0.3833); mHTT: two-way ANOVA (DMSO vs. Branaplam: P = 0.0614; Ctrl vs. HD: P = 0.0223; interaction: P = 0.0615); toxicity (Triton excluded): Friedman test (P = 0.5306). Bars: median ± IQR. f Bar plot showing number of Casp3/7 positive beta-III-Tubulin+ and CTIP2+ cortical neurons after DMSO (dark shades) or (light shades) 72 h 10 nM Branaplam treatment (Ctrl n = 4; HD n = 4). Statistics: beta-III-Tubulin+: two-way ANOVA (DMSO vs. Branaplam: P = 0.0782; Ctrl vs. HD: P = 0.4744; interaction: P = 0.9502); CTIP2+: 2-way ANOVA (DMSO vs. Branaplam: P = 0.7230; Ctrl vs. HD: P = 0.5779; interaction: P = 0.6348). Bars: median ± IQR. Source data are provided as a Source Data file.
Fig. 4
Fig. 4. Branaplam promotes non-annotated exon inclusion at preferred sequences.
a Paradigm illustrating analysis pipeline in the four analyzed conditions (light green: fibroblasts Ctrl DMSO vs. 10 nM Branaplam (4 vs. 4); light purple: fibroblasts HD DMSO vs. 10 nM Branaplam (4 vs. 4); green: cortical neurons (50d) Ctrl DMSO vs. 10 nM Branaplam (3 vs. 3); purple: cortical neurons (50d) HD DMSO vs. 10 nM Branaplam (3 vs. 3)). rMATS for AS detection and quantification, k-means clustering to identify consistently changed AS events, kmer enrichment to investigate sequence preferences. Created with BioRender.com. b Heatmap illustrating inclusion level differences of alternative splicing events significant (FDR ≤ 0.05; absolute inclusion level difference ≥0.1) in at least one of the four comparisons from included (red colors) to excluded (blue colors). Events not detected in an analysis are marked black. Y axis colors show AS cluster (0–9, determined by k-means), AS type and novel splice sites. c, d Violin plot and pie chart of AS events in cluster 6 (c) and cluster 9 (d). Violin plot shows inclusion level difference in the four comparisons (Ctrl: greens; HD: purples; fibroblasts: light shades; cortical neurons: dark shades). Pie chart illustrates distribution of annotated (yellow) vs. non-annotated exons (novelSS, orange). e Box plot showing inclusion values of AS events in cluster 6 and 9 that are non-annotated (novelSS) in individual samples. D: DMSO, B: Branaplam. f Paradigm illustrating strategy to determine sequence preferences of Branaplam-induced AS at the 5’ exon (cyan) and 3’ exon end (gold). g Scatter plots of 4mer, 6mer and 8mer relative frequencies (x) and significance (y) at 3’ splice site (respective left graph) and 5’ splice site (respective right graph). Colored dots represent significant enrichments. h Box plot illustrating gene expression changes (log2(RPKM Branaplam/ RPKM DMSO)) of genes with AS events in cluster 6 and 9 that are non-annotated (novelSS) in all four comparisons. fib fibroblasts, CN cortical neurons. Source data are provided as a Source Data file.
Fig. 5
Fig. 5. A frameshift-inducing exon is inserted in HTT upon Branaplam treatment leading to a reduction of HTT mRNA levels.
a Illustration of locus with novel exon integrated in HTT transcript. Red arrowheads: in-frame STOP codons, blue arrows: primer locations for PCR validation. b Sashimi plot illustrating read density and junction-spanning reads in Ctrl and HD fibroblasts with and without Branaplam. c Sashimi plot illustrating read density and junction-spanning reads in Ctrl and HD cortical neurons with and without Branaplam. d Agarose gel of PCR amplifying the HTT location of interest in fibroblasts with and without Branaplam. Lower band (88 bp) represents regular transcript without exon inclusion, upper band (203 bp) indicates integration of novel exon. e Bar plot illustrating quantification of agarose gel. Depicted is the ratio of densitometric quantification of included vs. excluded HTT transcript in fibroblasts of Ctrl (greens) and HD (purples) with (light shades) and without (dark shades) Branaplam treatment. Statistics: 2-way ANOVA (DMSO vs. Branaplam: P < 0.0001; Ctrl vs. HD: P = 0.5954; interaction: P = 0.3139). Bars: median ± IQR. f Agarose gel of PCR amplifying the HTT location of interest in cortical neurons with and without Branaplam. Lower band (88 bp) represents regular transcript without exon inclusion, upper band (203 bp) indicates integration of novel exon. g Bar plot illustrating quantification of agarose gel. Depicted is the ratio of densitometric quantification of included vs. excluded HTT transcript in cortical neurons of Ctrl (greens) and HD (purples) with (light shades) and without (dark shades) Branaplam treatment. Statistics: two-way ANOVA (DMSO vs. Branaplam: P = 0.0003; Ctrl vs. HD: P = 0.7070; interaction: P = 0.5633). Bars: median ± IQR. h, i Bar plot illustrating HTT RPKM values in fibroblasts (h) and cortical neurons (i) of Ctrl (greens) and HD (purples) with (light shades) and without (dark shades) Branaplam treatment. Fibroblasts statistics: two-way ANOVA (DMSO vs. Branaplam: P = 0.0005; Ctrl vs. HD: P = 0.0777; interaction: P = 0.2603). Cortical neuron statistics: two-way ANOVA (DMSO vs. Branaplam: P = 0.0101; Ctrl vs. HD: P = 0.6817; interaction: P = 0.2631). Bars: median ± IQR. Source data are provided as a Source Data file.
Fig. 6
Fig. 6. Branaplam improves alternative splicing pathology in HD fibroblasts and cortical neurons.
a Paradigm illustrating samples used to determine improvements in AS pathology. Created with BioRender.com. b, c Violin plot showing absolute inclusion level differences (Ctrl DMSO – HD DMSO (dark shade) and Ctrl DMSO – HD Branaplam (light shade)) of HD AS events detected in all fibroblast (b) or cortical neuron (c) samples. Significance is calculated with Wilcoxon rank-sum test using scipy.stats. d Scatter plot illustrating inclusion levels of HD alternative splicing events detected in all fibroblast samples in Ctrl DMSO (x) and HD DMSO (y). Dashed lines mark corridor of absolute inclusion level difference <0.1. Red: events included in HD fibroblasts, blue: events excluded in HD fibroblasts. e Scatter plot illustrating inclusion levels of HD alternative splicing events detected in all fibroblast samples in Ctrl DMSO (x) and HD Branaplam (y). Dashed lines mark corridor of absolute inclusion level difference <0.1. Red: events included in HD fibroblasts, blue: events excluded in HD fibroblasts. f Pie charts quantifying the percentage of the number of events changed in HD fibroblasts that are excluded (blue), included (red) or rescued (green) (within absolute inclusion level difference corridor <0.1) in HD DMSO (top chart) and HD Branaplam (bottom chart). g Scatter plot illustrating inclusion levels of HD alternative splicing events detected in all cortical neurons samples in Ctrl DMSO (x) and HD DMSO (y). Dashed lines mark corridor of absolute inclusion level difference <0.1. Red: events included in HD cortical neurons, blue: events excluded in HD cortical neurons. h Scatter plot illustrating inclusion levels of HD AS events detected in all cortical neurons samples in Ctrl DMSO (x) and HD Branaplam (y). Dashed lines mark corridor of absolute inclusion level difference <0.1. Red: events included in HD cortical neurons, blue: events excluded in HD cortical neurons. i Pie charts quantifying percentage of number of events changed in HD cortical neurons that are excluded (blue), included (red) or rescued (green) (within absolute inclusion level difference corridor <0.1) in HD DMSO (top chart) and HD Branaplam (bottom chart).

References

    1. MacDonald, M. E. et al. A novel gene containing a trinucleotide repeat that is expanded and unstable on Huntington’s disease chromosomes. The Huntington’s Disease Collaborative Research Group. Cell72, 971–983 (1993). - PubMed
    1. Ross CA, et al. Huntington disease: natural history, biomarkers and prospects for therapeutics. Nat. Rev. Neurol. 2014;10:204–216. doi: 10.1038/nrneurol.2014.24. - DOI - PubMed
    1. Jimenez-Sanchez, M., Licitra, F., Underwood, B. R. & Rubinsztein, D. C. Huntington’s disease: mechanisms of pathogenesis and therapeutic strategies. Cold Spring Harb. Perspect. Med.7, a024240 (2017). - PMC - PubMed
    1. Rosas HD, et al. Cerebral cortex and the clinical expression of Huntington’s disease: complexity and heterogeneity. Brain. 2008;131:1057–1068. doi: 10.1093/brain/awn025. - DOI - PMC - PubMed
    1. Macdonald V, Halliday G. Pyramidal cell loss in motor cortices in Huntington’s disease. Neurobiol. Dis. 2002;10:378–386. doi: 10.1006/nbdi.2002.0528. - DOI - PubMed

Publication types

MeSH terms