. 2022 Nov 10;13(1):6789.
doi: 10.1038/s41467-022-34420-4.

Lipidomic signatures align with inflammatory patterns and outcomes in critical illness

Collaborators, Affiliations

Lipidomic signatures align with inflammatory patterns and outcomes in critical illness

Junru Wu et al. Nat Commun. .

Abstract

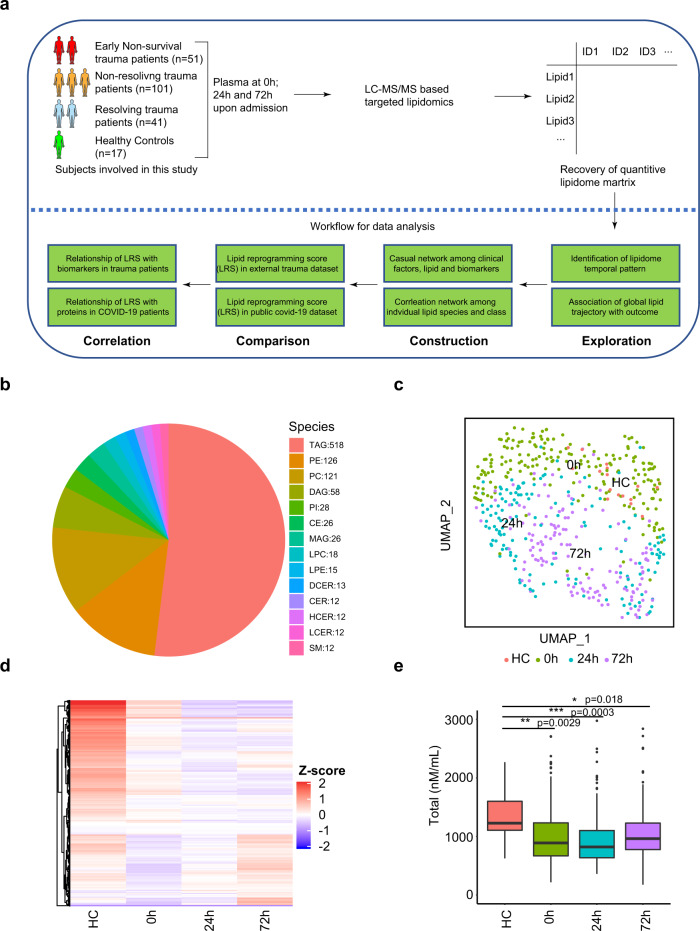
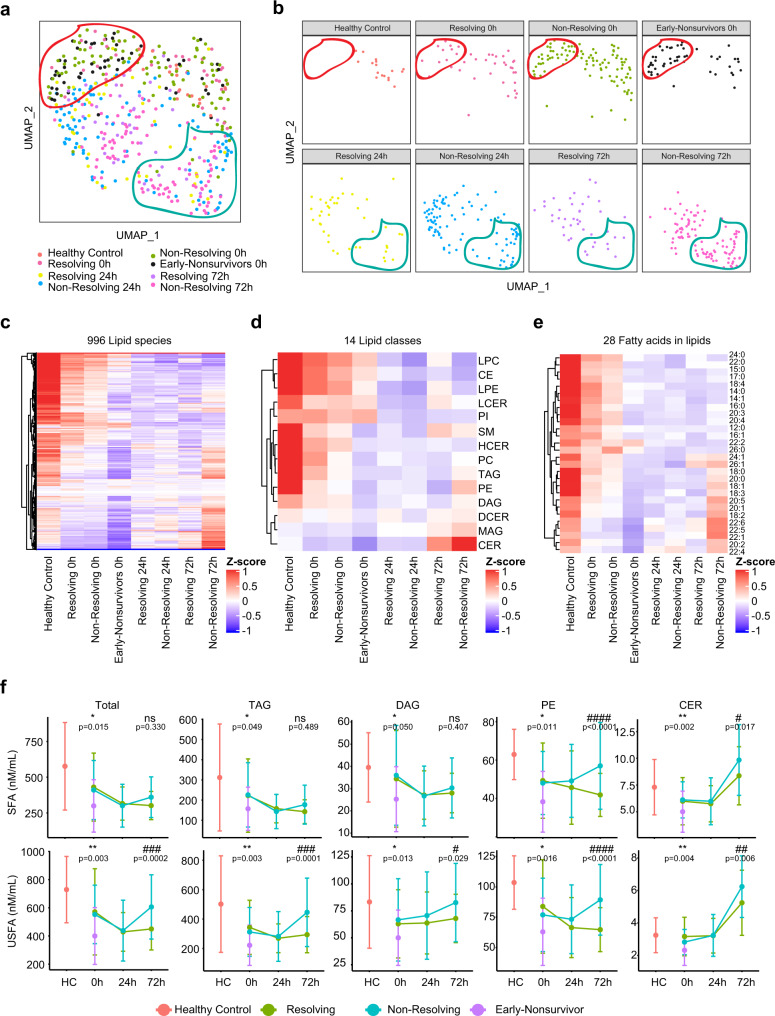
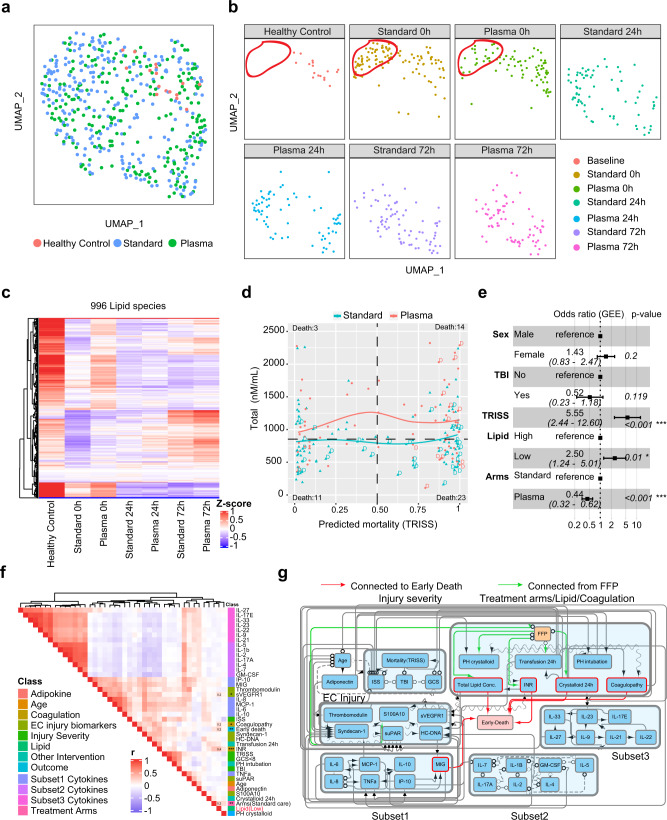
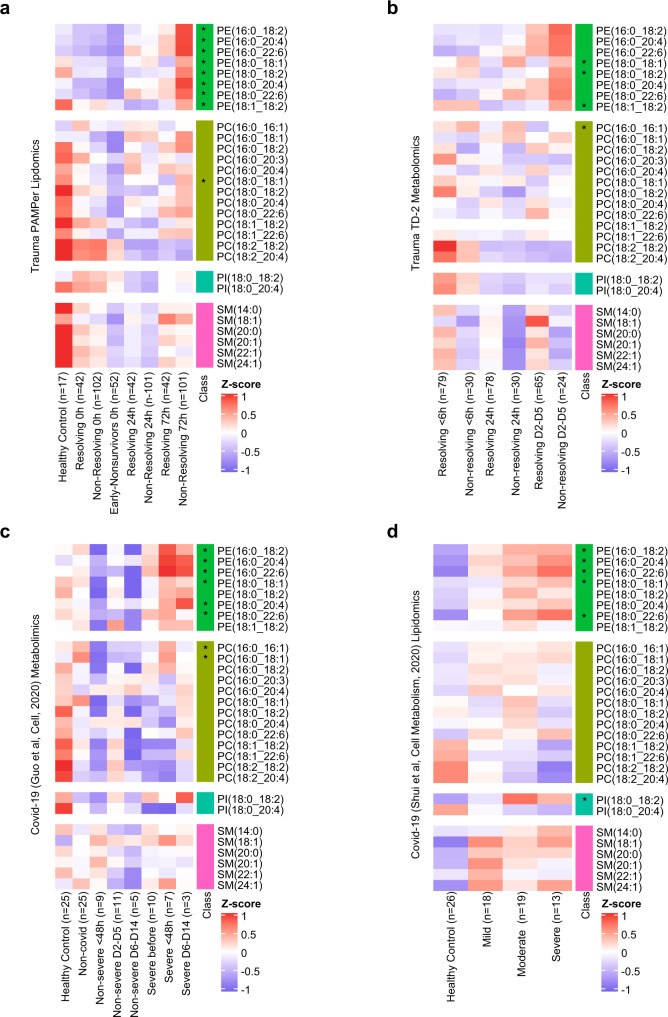
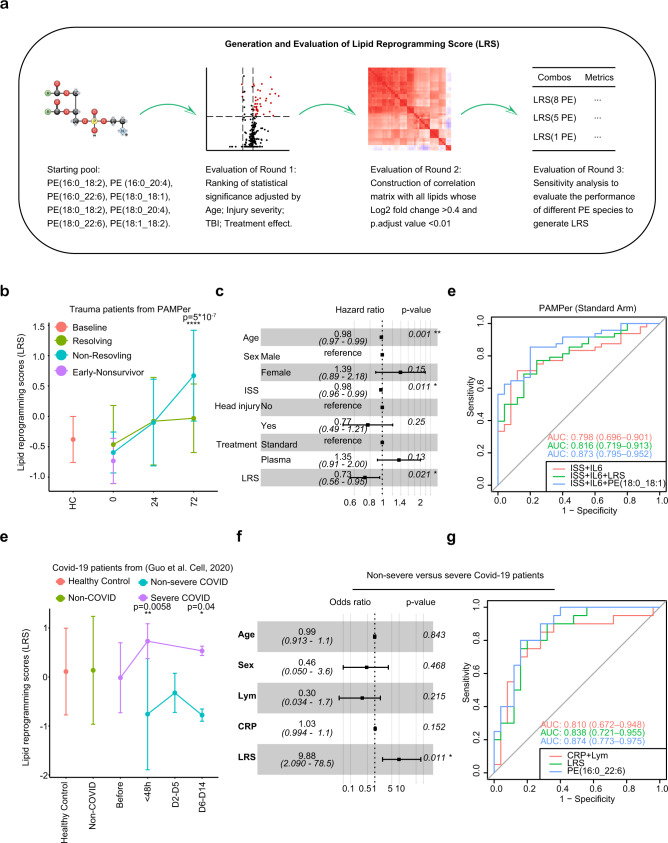
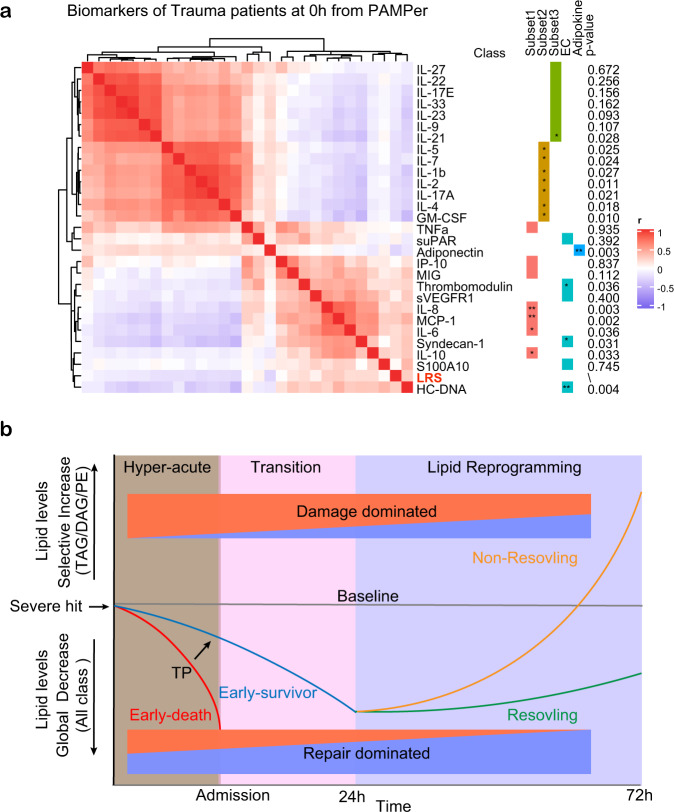
Alterations in lipid metabolism have the potential to be markers as well as drivers of pathobiology of acute critical illness. Here, we took advantage of the temporal precision offered by trauma as a common cause of critical illness to identify the dynamic patterns in the circulating lipidome in critically ill humans. The major findings include an early loss of all classes of circulating lipids followed by a delayed and selective lipogenesis in patients destined to remain critically ill. The previously reported survival benefit of early thawed plasma administration was associated with preserved lipid levels that related to favorable changes in coagulation and inflammation biomarkers in causal modelling. Phosphatidylethanolamines (PE) were elevated in patients with persistent critical illness and PE levels were prognostic for worse outcomes not only in trauma but also severe COVID-19 patients. Here we show selective rise in systemic PE as a common prognostic feature of critical illness.


Conflict of interest statement

The authors declare no competing interests.

Figures

Fig. 1
Fig. 1. Temporal patterns in the circulating lipidome after severe trauma.
a Scheme of overall analysis strategy. b Representation of 996 lipid species detected in the lipidomic platform grouped by lipid classes. c Uniform Manifold Approximation and Projection (UMAP) plot shows the distribution of healthy subjects (n = 17) and patients with trauma (n = 193), grouped by sampling timepoints (0 h, 24 h, 72 h after admission). d Heatmap shows relative levels of 996 lipid species for healthy subjects and trauma patients, grouped by sampling timepoints using z-score normalized concentrations. Lipid species are clustered by Hierarchical clustering. e Quantitative comparison of circulating total lipid concentration among healthy controls (HC, n = 17) and trauma patients (n = 193), grouped by sampling timepoints. Asterisks indicate statistical significance based on the Kruskal–wallis test with post-hoc analysis using the Dunn test. The p value was adjusted by the Benjamini–Hochberg method: *<0.05; **<0.01; ***<0.001. Box and whisker plots represent mean value, standard deviation, maximum and minimum values, and outliers. TAG triacylglycerol, DAG diacylglycerols, MAG monoacylglycerols, PE phosphatidylethanolamine, PC phosphatidylcholine, PI phosphatidylinositol, LPE Lysophosphatidylethanolamine, LPC Lysophosphatidylcholine, CER Ceramides, HCER hexosylceramides, LCER lactosylceramide, DCER dihydroceramides, CE cholesterol ester. Source data are provided as a Source Data file.
Fig. 2
Fig. 2. Association between temporal patterns of the circulating lipidome and outcome.
Uniform Manifold Approximation and Projection (UMAP) plot shows the distribution of healthy control subjects (n = 17) and trauma patients (n = 193), grouped together (a) and separated (b) by outcome and sampling timepoints. Heatmaps show relative levels of 996 lipid species (c); 14 lipid classes (d) and 28 fatty acids labeled by carbon number: double bonds (e) for healthy subjects and trauma patients, grouped by outcome and sampling timepoints. z-score represents normalized concentrations. Rows are clustered by method of hierarchical clustering. f Quantitative comparison of circulating total lipid concentrations among healthy controls (HC) and trauma patients. Lipids are grouped by classes and fatty acids (saturated or unsaturated) identified as the acyl chains in the lipid classes. Patients are grouped by outcome and sampling timepoints. Center dots and error bars represent median value and median absolute deviation, respectively. SFA saturated fatty acid, USFA unsaturated fatty acid. Asterisks indicate statistical significance based on Kruskal–wallis test among 3 groups at 0 h with post-hoc analysis of Dunn test. The P value was adjusted by Benjamini–Hochberg method: *<0.05; **<0.01. Number sign indicates statistical significance based on 2-way AVOVA test of time-series analysis of resolving and non-resolving groups. Pairwise Comparisons were conducted by Estimated Marginal Means test. The P value was adjusted by Benjamini–Hochberg method: #<0.05; ##<0.01; ###<0.001, ####<0.0001. Source data are provided as a Source Data file.
Fig. 3
Fig. 3. Potential causal effect for thawed plasma (TP), Lipid concentration and early mortality.
Uniform Manifold Approximation and Projection (UMAP) plot shows the distribution of healthy subjects (HC, n = 17) and trauma patients (n = 193) (a), separated by treatment arms with sampling timepoints (b). c Heatmap shows relative levels of 996 lipid species for healthy subjects and trauma patients, grouped by treatment arms and sampling timepoints. Exp, z-score normalized concentration. Rows are clustered by hierarchical clustering. d Relationship of predicted mortality and total lipid concentration at 0 h upon admission. Trauma patients are grouped by treatment arms; tendency lines are modeled by loess methods for 2 groups separately, dash line in the x-axis means 0.5 and y-axis means the median concentration. d indicates patients who died less than 72 h after admission. e Forest plot showing odds ratios from logistic regression (generalized estimating equatio) of clinical factors; Lipid concentration; TP effect for early-nonsurvivors (n = 51) versus others (n = 142). Error bars: 95% confidence interval. f Correlation heatmap showing correlation among cytokines, biomarkers, clinical variables, total lipid concentration and outcome. r: Spearman correlation coefficient. g Causal network among factors in e constructed by FCI (see also methods) in patients with complete lipid and biomarker data (n = 170). The presence of “edges” or connections between nodes in the graph correspond to conditional dependencies relationships. Detailed interpretation of the edges can be found in Methods. Abbreviations: TRISS Trauma and injury severity score, TP thawed plasma, TBI traumatic brain injury, ISS injury severity score, GCS Glasgow coma score, PH Prehospital, INR international normalized ratio. Asterisks in e indicate statistical significance in multi-variable logistic regression model: *<0.05; **<0.01. Asterisks in f indicate statistical significance for correlation coefficient. P-values are approximated by using the t distributions: *<0.05; **<0.01; ***<0.001.
Fig. 4
Fig. 4. Comparison of temporal patterns of common lipids for patients with trauma or COVID-19.
a, d Heatmaps show the relative levels of 29 common lipid species from four major classes across patients. Data comes from trauma patients from the PAMPer lipidomics dataset (a) and TD-2 untargeted metabolomics dataset (b); COVID-19 patients from untargeted metabolomics dataset (Guo et al. Cell, 2020) (c) and lipidomics dataset (Shui et al., Cell metabolism, 2020) (d). Patients are grouped by outcome and sampling timepoint (except for d). Asterisks indicate lipids with statistical significance (p value <0.05) and log2 fold change >0.4 by two-sided Wilcoxon Rank Sum test between non-resolving and resolving trauma patients at 72 h (a); non-resolving and resolving trauma patients at D2-D5 (b); severe and non-severe Covid-19 patients (c); severe and mild Covid-19 patients (d). Abbreviations: PE phosphatidylethanolamines, PC phosphatidylcholines, PI phosphatidylinositols, SM sphingomyelins.
Fig. 5
Fig. 5. Lipid Reprogramming Score (LRS) is an independent risk factor for outcome after trauma or COVID-19.
a Graphical scheme of generation and evaluation of LRS. b Comparison of LRS from patients with trauma (n = 142). Patients are grouped by outcome and sampling timepoint. Center dots and error bars represent median value and median absolute deviation, respectively. c Forest plot showing hazard ratio of clinical factors and LRS score for recovery using a Cox regression mixed effect model in patients surviving at 72 h (n = 142). Error bars: 95% confidence interval. d ROC curve for three prognostic models in training cohort from Standard-of-care arm in the PAMPer dataset (trauma patients, n = 73). e Comparison of LRS for patients with COVID-19. Healthy Subjects (n = 25), Non-COVID (n = 25) and COVID-19 patients (n = 45) are grouped with diseases outcome and sampling timepoint. Center dots and error bars represent median value and median absolute deviation, respectively. f Forest plot showing odds ratio of clinical factors from logistic regression and LRS score for Non-severe (n = 25) versus Severe COVID-19 patients (n = 20). Error bars: 95% confidence interval. g Comparison of prognostic value of LRS, PE (16:0_22:6), lymphocyte count, and CRP for Non-severe (n = 25) versus Severe (n = 20) outcome for the COVID-19 cohort (C1) from Guo. et al by ROC curve. ISS injury severity score, Lym lymphocyte count, CRP C-reaction protein. Asterisks in b indicate statistical significance in based on 2-way AVOVA test of time-series analysis of resolving and non-resolving groups. Pairwise Comparisons was conducted by Estimated Marginal Means test. The P value was adjusted by Benjamini–Hochberg method: ****<0.0001. Asterisks in e indicate statistical significance based on Kruskal–wallis test among 6 groups of COVID-19 patients with post-hoc analysis of Dunn test. The P value was adjusted by Benjamini–Hochberg method: *<0.05. Asterisks in d and g indicate statistical significance in multi-variable regression model: *<0.05; **<0.01. Source data are provided as a Source Data file.
Fig. 6
Fig. 6. Association between LRS and circulating biomarkers.
a Heatmap showing correlation of LRS and circulating biomarkers at 0 h in trauma patients (n = 121), measured by Spearman correlation coefficients. Asterisks in a and b indicate statistical significance for correlation coefficient. Unadjusted p-values are approximated by using the two-sided t distributions: *<0.05; **<0.01; ***<0.001. b Schematic of proposed paradigm showing the relationship between circulating lipid levels and outcomes after severe injury. Early loss of circulating lipids correlates with adverse outcomes while failure to resolve critical illness is associated with the selective increase in glycerolipids and PE.

Update of

References

    1. Davidson GH, et al. Long-term survival of adult trauma patients. JAMA. 2011;305:1001–1007. - PubMed
    1. Delano MJ, Ward PA. The immune system’s role in sepsis progression, resolution, and long-term outcome. Immunol. Rev. 2016;274:330–353. - PMC - PubMed
    1. GBD 2016 Causes of Death Collaborators. Global, regional, and national age-sex specific mortality for 264 causes of death, 1980–2016: a systematic analysis for the Global Burden of Disease Study 2016. Lancet. 2017;390:1151–1210. - PMC - PubMed
    1. Cummings MJ, et al. Epidemiology, clinical course, and outcomes of critically ill adults with COVID-19 in New York City: a prospective cohort study. Lancet. 2020;395:1763–1770. - PMC - PubMed
    1. Xiao W, et al. A genomic storm in critically injured humans. J. Exp. Med. 2011;208:2581–2590. - PMC - PubMed

Publication types