. 2022 Nov 10;13(1):6804.
doi: 10.1038/s41467-022-34560-7.

Ferritin triggers neutrophil extracellular trap-mediated cytokine storm through Msr1 contributing to adult-onset Still's disease pathogenesis

Affiliations

Ferritin triggers neutrophil extracellular trap-mediated cytokine storm through Msr1 contributing to adult-onset Still's disease pathogenesis

Jinchao Jia et al. Nat Commun. .

Abstract

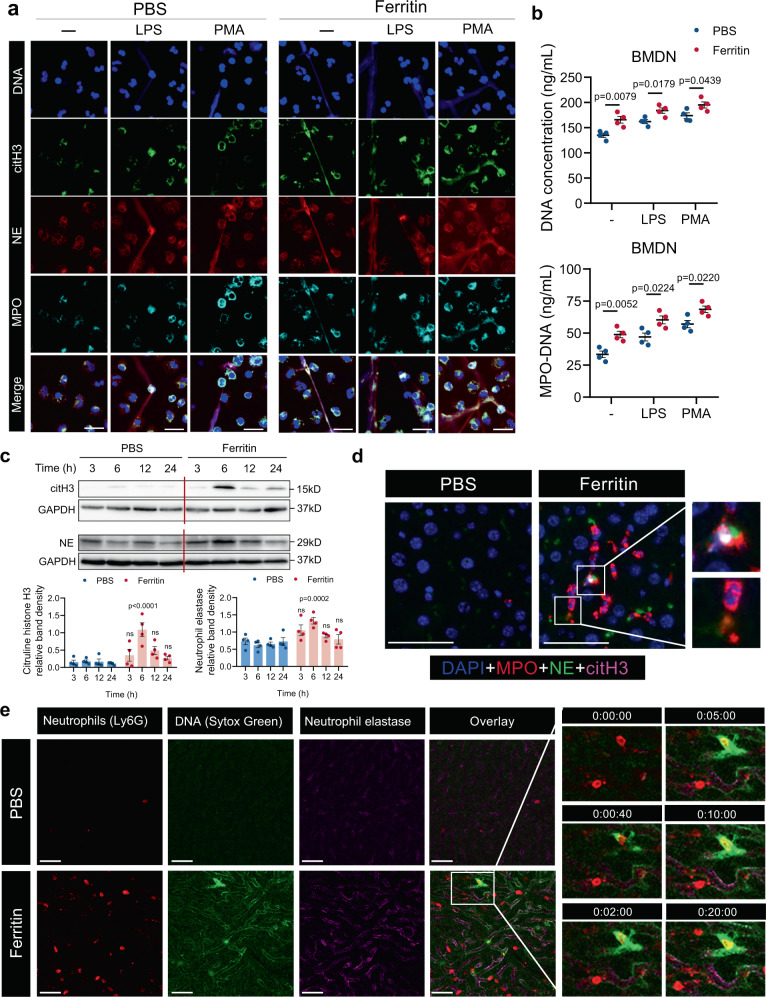
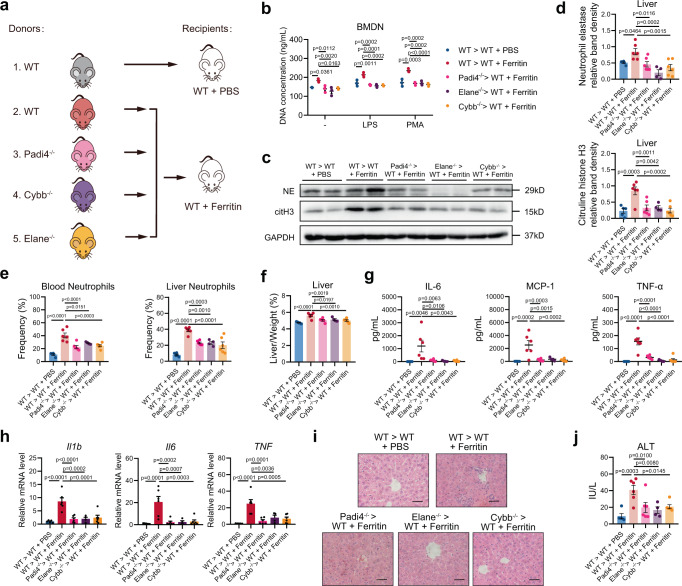
Hyperferritinemic syndrome, an overwhelming inflammatory condition, is characterized by high ferritin levels, systemic inflammation and multi-organ dysfunction, but the pathogenic role of ferritin remains largely unknown. Here we show in an animal model that ferritin administration leads to systemic and hepatic inflammation characterized by excessive neutrophil leukocyte infiltration and neutrophil extracellular trap (NET) formation in the liver tissue. Ferritin-induced NET formation depends on the expression of peptidylarginine deiminase 4 and neutrophil elastase and on reactive oxygen species production. Mechanistically, ferritin exposure increases both overall and cell surface expression of Msr1 on neutrophil leukocytes, and also acts as ligand to Msr1 to trigger the NET formation pathway. Depletion of neutrophil leukocytes or ablation of Msr1 protect mice from tissue damage and the hyperinflammatory response, which further confirms the role of Msr1 as ferritin receptor. The relevance of the animal model is underscored by the observation that enhanced NET formation, increased Msr1 expression and signalling on neutrophil leukocytes are also characteristic to adult-onset Still's disease (AOSD), a typical hyperferritinemic syndrome. Collectively, our findings demonstrate an essential role of ferritin in NET-mediated cytokine storm, and suggest that targeting NETs or Msr1 may benefit AOSD patients.


Conflict of interest statement

The authors declare no competing interests.

Figures

Fig. 1
Fig. 1. Ferritin induces systemic inflammation and liver injury in vivo.
Mice were treated with ferritin for the indicated period of time. a Liver and spleen weight normalized to body weight (n = 4), and representative images of the livers and spleens are shown. b Dynamic changes of the frequencies and numbers of peripheral myeloid cells were assessed by flow cytometry (n = 4 for cell frequencies, n = 3 for cell numbers). c Serum levels of IL-6, TNF-α, IL-10, MCP-1, IFN-γ, and IL-12p70 were measured by CBA analysis (n = 5 in 6 h groups, n = 4 in other groups). d Livers from control and ferritin-treated mice were subjected to H&E staining. Scale bars, 50 μm. Red arrowheads indicate inflammatory infiltrations. One representative image of livers from three mice in each group was shown. e Serum ALT levels at each time point were assessed (n = 3). f Heatmap displaying the expression levels of genes involved in inflammatory response. The mean relative mRNA levels of 4 biological replicates were calculated and the data were represented as z score. g Flow cytometry analysis for myeloid cell infiltration in the liver (n = 4 in 6 h groups for neutrophils, monocytes and Ly6C+ monocytes, n = 3 in other groups). h Neutrophil (Ly6G) and macrophage (F4/80) infiltrations in the livers from ferritin-treated mice for 6 h were stained by immunohistochemistry, and the percentage of positive cells was quantified (5 fields per mouse, n = 3). Representative sections are shown. Scale bars, 50 μm. Red arrowheads indicate neutrophil infiltrations. Data are presented as means ± SEM except for box and whiskers with minima to maxima in graph (h); ns not significant. Unpaired two-sided Student’s t test (h) and two-way ANOVA with Bonferroni’s multiple comparison test (ac, e and g). Source data are provided as a Source Data file.
Fig. 2
Fig. 2. Ferritin promotes neutrophils to generate NETs in vivo.
a Representative immunofluorescence staining of spontaneous, LPS- and PMA-induced NET formation in the BMDNs from ferritin-treated mice at 6 h. Neutrophils stained with antibodies to citH3 (green), NE (red), and MPO (cyan), and with the DNA dye Hoechst (blue). Scale bars, 20 μm. b Quantification of cell-free DNA and MPO-DNA complexes of BMDNs from ferritin-treated mice at 6 h (n = 4). c Western blotting analysis for NET markers citH3 and NE in the liver from ferritin-treated mice (n = 4). d Immunofluorescence detection of NE (green), citH3 (magenta), MPO (red) and DNA (blue) in situ in the liver of ferritin-treated mice at 6 h. One representative image of livers from three mice per group was shown. Scale bars, 20 μm. e Representative images of neutrophil infiltration (red) and NET release (DNA: green; NE: magenta) in the liver of ferritin-treated mice at 6 h by intravital microscopy. One representative image of livers from two mice per group was shown. Scale bars, 50 μm. Data are presented as means ± SEM; unpaired two-sided Student’s t test (b) and two-way ANOVA with Bonferroni’s multiple comparison test (c). Source data are provided as a Source Data file.
Fig. 3
Fig. 3. Neutrophils are required for ferritin-induced inflammation.
Neutrophils were depleted by anti-Ly6G antibody in ferritin-treated mice at 6 h. a, b Peripheral neutrophil numbers (a), and liver myeloid cell infiltration (b) were measured by flow cytometry (n = 4). c Changes of liver to body weight ratio were shown (n = 4). d Serum cytokines IL-6, TNF-α, IL-10, MCP-1 and IFN-γ were evaluated by CBA analysis (n = 5 in PBS group, n = 4 in isotype and anti-Ly6G groups). e Western blotting analysis for NET markers citH3 and NE in the liver (n = 4). f Representative images of neutrophils infiltration (red) and NET release (DNA: green; NE: magenta) in the liver by intravital microscopy. One representative image of livers from two mice per group was shown. Scale bars, 50 μm. g Liver inflammatory infiltration was detected by H&E staining. One representative image of livers from four mice in each group was shown. Scale bars, 50 μm. h, i Liver mRNA expression of Il1b, Il6 and Tnfa was measured by qRT-PCR (h) and serum ALT level was detected (i) (n = 4). Data are presented as means ± SEM; ns not significant. one-way ANOVA with Bonferroni’s multiple comparison test. Source data are provided as a Source Data file.
Fig. 4
Fig. 4. Ferritin-induced NETosis is dependent on PAD4, NE and ROS.
a Quantification of cell-free DNA and MPO-DNA complexes released by neutrophils from healthy donors stimulated with 10, 100 and 1000 nM ferritin. Plots show means ± SD from one representative experiment with n = 3 technical replicates. Results were confirmed in ten independent experiments for cell-free DNA and three independent experiments for MPO-DNA using cells from different donors. b, c Changes of citH3 levels (b) and NE activity (c) in healthy donors’ neutrophils upon ferritin stimulation (n = 3 biologically independent experiments). Representative Western blotting of citH3 was shown. d Detection of ROS by flow cytometry in ferritin-stimulated human neutrophils (representative results from three independent experiments) and BMDNs from ferritin-treated mice (n = 4). e, f The inhibitory effects of PAD4, NE and ROS with corresponding inhibitors Cl-amidine, sivelestat and DPI on ferritin-induced NET formation were detected by cell-free DNA, MPO-DNA complexes (e) and immunofluorescence of MPO (cyan), NE (red), citH3 (green) and DNA (blue) (f) in neutrophils from healthy donors. Scale bars, 20 μm. Plots in (e) show means ± SD from one representative experiment with n = 3 technical replicates. Results in (e, f) were confirmed in three independent experiments using cells from different donors. gi Peripheral blood and liver neutrophil (g, n = 4), changes of liver to body weight ratio (h, n = 4) and serum cytokines, IL-6, MCP-1 and TNF-α (i, n = 5 in PBS and ferritin groups, n = 4 in other groups) were evaluated after treatment with Cl-amidine, sivelestat or DPI in ferritin-treated mice at 6 h. j Western blotting analysis for NET markers citH3 and NE in the liver (n = 4). k Representative images of neutrophils infiltration (red) and NET release (DNA: green; NE: magenta) in the liver by intravital microscopy. One representative image of livers from one mouse per group was shown. Scale bars, 50 μm. ln H&E staining of liver inflammatory infiltration (l), liver mRNA expression of Il1b, Il6 and Tnfa (m) and serum ALT levels (n) in ferritin-injected mice at 6 h (n = 4). Scale bars, 50 μm. Data in (bd, gj, m, n) are presented as means ± SEM, Data in (a and e) are presented as means ± SD of 3 technical replicates. Ns, not significant. Unpaired two-sided Student’s t test (d), one-way ANOVA (a, e, gj, m, n) and two-way ANOVA with Bonferroni’s multiple comparison test (b and c). Source data are provided as a Source Data file.
Fig. 5
Fig. 5. Genetic disruption of PAD4, NE and ROS in BM improves ferritin-induced inflammation.
a Experimental overview: Bone marrow (BM) from WT, Padi4−/−, Elane−/− and Cybb−/− mice in C57BL6 background were transplanted to WT recipients and allowed to reconstitute for 4 weeks following which ferritin was injected. b Quantification of cell-free DNA released by BMDNs (n = 3). c, d Western blotting analysis for NET markers citH3 and NE in the livers (WT > WT + PBS: n = 5, WT > WT + Ferritin: n = 6, Padi4−/− >WT + Ferritin: n = 6, Elane−/− >WT + Ferritin: n = 4, Cybb−/− >WT + Ferritin: n = 6). Representative Western blotting was shown. e–g Peripheral blood and liver neutrophil (e), changes of liver to body weight ratio (f) and serum cytokines, IL-6, MCP-1 and TNF-α (g) were evaluated in mice transplanted with Padi4−/−, Elane−/− and Cybb−/−BM (WT > WT + PBS: n = 5, WT > WT + Ferritin: n = 6, Padi4−/− >WT + Ferritin: n = 6, Elane−/− >WT + Ferritin: n = 4, Cybb−/− >WT + Ferritin: n = 6). hj liver mRNA expression of Il1b, Il6 and Tnfa (h), H&E staining of liver inflammatory infiltration (i), and serum ALT levels (j) (WT > WT + PBS: n = 5, WT > WT + Ferritin: n = 6, Padi4−/− >WT + Ferritin: n = 6, Elane−/− >WT + Ferritin: n = 4, Cybb−/− >WT + Ferritin: n = 6). Scale bars, 50 μm. Data are presented as means ± SEM; ns not significant. One-way ANOVA (b, d, eh, j). Source data are provided as a Source Data file.
Fig. 6
Fig. 6. Msr1 is responsible for ferritin-induced NET formation.
a, b Differentially expressed genes of “innate immune response” and “cytokine production” pathways (a), and gene expression of potential ferritin receptors in the BMDNs from PBS- and ferritin-treated mice (b) (n = 3). c mRNA levels of potential ferritin receptors were confirmed in the FACS-sorted BMDNs (n = 3). d, e Msr1 mRNA levels in the livers (d, n = 6) and protein levels in the BMDNs and livers (e, n = 4) were determined by qRT-PCR and Western blotting analysis. f Flow cytometry for Msr1+ neutrophils in the peripheral blood and liver in ferritin-treated mice (n = 4). g Msr1 mean fluorescence intensity (MFI) and positive cell percentage of human neutrophils after ferritin stimulation. Experiments were repeated three times. h, i The effects of Msr1 blockade on ferritin-induced NET formation were detected by cell-free DNA, MPO-DNA complexes (h) and immunofluorescence of MPO (cyan), NE (red), citH3 (green) and DNA (blue) (i) in neutrophils from healthy donors. Plots in (h) show means ± SD from one representative experiment with n = 3 technical replicates. Results in (h and i) were confirmed in three independent experiments using cells from different donors. Scale bars, 20 μm. j DNA release of BMDNs from WT and Msr1−/− mice with ferritin stimulation. Plots show means ± SD from one representative experiment with n = 3 technical replicates. Results were confirmed in three independent experiments using cells from different mice. k, l Detection of cell-free DNA, MPO-DNA complexes (k) and immunofluorescence of MPO (cyan), NE (red), citH3 (green) and DNA (blue) (l) in the BMDNs from ferritin-treated WT and Msr1−/− mice at 6 h (n = 4). Scale bars, 20 μm. m Western blotting analysis for NET markers citH3 and NE in the liver from ferritin-treated WT and Msr1−/−mice at 6 h (n = 5). n Representative images of neutrophils infiltration (red) and NET release (DNA: green; NE: magenta) in the liver of ferritin-treated WT and Msr1−/− mice by intravital microscopy. One representative image of livers from two mice per group was shown. Scale bars, 50 μm. Data in (bg, k, m) are presented as means ± SEM; Data in (h and j) are presented as means ± SD of 3 technical replicates. N.D. not detected, ns not significant. Unpaired two-sided Student’s t test (bg, k and m), one-way ANOVA (h and j). Source data are provided as a Source Data file.
Fig. 7
Fig. 7. Msr1 ablation ameliorates ferritin-induced inflammation.
a–d Peripheral neutrophil numbers (a), hepatic myeloid infiltration (b), liver to body weight ratio (c) and serum cytokines (d) were assessed in ferritin-treated WT and Msr1−/− mice at 6 h (n = 5). eg Liver inflammatory infiltration (e), mRNA expression of Il1b, Il6 and Tnfa (f) and serum ALT levels (g) were identified in WT and Msr1−/– mice at 6 h post ferritin injection (n = 5). Scale bars, 50 μm. h Western blotting analysis of ERK, JNK, p38, and Akt in the BMDNs from ferritin-treated WT and Msr1−/− mice at 6 h (n = 4). Densitometric analysis of p-ERK/total ERK, p-JNK/total JNK, p-p38/total p38 and p-Akt/total Akt was shown. Data are presented as means ± SEM; ns not significant. Unpaired two-sided Student’s t test (ad, f, and g) and two-way ANOVA with Bonferroni’s multiple comparison test (h). Source data are provided as a Source Data file.
Fig. 8
Fig. 8. Hyperferritinemia contributes to increased NET formation in AOSD patients.
a The correlations between serum ferritin levels and circulating NET-DNA complexes and cell-free DNA levels in AOSD patients (n = 64). b Ferritin (FTH) in sera from 3 patients with active AOSD was either absorbed away (after absorption) or not absorbed (before absorption), and then measured by Western blotting. Quantification of cell-free DNA and MPO-DNA complexes released by neutrophils from healthy donors stimulated with sera above. Plots show means ± SD from one representative experiment with n = 3 technical replicates. Results were confirmed in three independent experiments using cells from different donors. c H&E staining for inflammatory infiltration and immunofluorescence detection of NET markers, including citH3, MPO and DNA, in liver biopsies from healthy donor (n = 1) and AOSD patient (n = 1). Scale bars, 50 μm. df Msr1 expression on neutrophils from healthy donors and AOSD patients measured by qRT-PCR (d), Western blotting (e) and flow cytometry (f). (n = 17 in HC and 13 in AOSD for qRT-PCR; n = 8 per group for Western blotting, n = 6 in HC and 9 in AOSD for flow cytometry) (g) The basal NET formation levels were detected by cell-free DNA and MPO-DNA complexes in neutrophils from healthy controls (n = 5) and AOSD patients (n = 5). h, i The inhibitory effects of PAD4, NE, ROS and Msr1 inhibitors on ferritin-induced NET formation were detected by cell-free DNA, MPO-DNA complexes (h) and immunofluorescence of MPO (cyan), NE (red), citH3 (green) and DNA (blue) (i) in neutrophils from patients with AOSD. Plots in h show means ± SD from one representative experiment with n = 3 technical replicates. Results in (h and i) were confirmed in three independent experiments using cells from different donors. Scale bars, 20 μm. Data in (dg) are presented as means ± SEM; Data in (b and h) are presented as means ± SD of 3 technical replicates. ns not significant. HC healthy control. Spearman’s nonparametric test (a), unpaired two-sided Student’s t test (b, df, and g) and one-way ANOVA with Bonferroni’s multiple comparison test (h). Source data are provided as a Source Data file.

Comment in

References

    1. Ruscitti P, et al. Severe COVID-19 and related hyperferritinaemia: more than an innocent bystander? Ann. Rheum. Dis. 2020 doi: 10.1136/annrheumdis-2020-217618. - DOI - PubMed
    1. Rosário C Z-GG, Meyron-Holtz EG, D’Cruz DP, Shoenfeld Y. The hyperferritinemic syndrome: macrophage activation syndrome, Still’s disease, septic shock and catastrophic antiphospholipid syndrome. BMC Med. 2013;11:185. doi: 10.1186/1741-7015-11-185. - DOI - PMC - PubMed
    1. Colafrancesco S, Alessandri C, Conti F, Priori R. COVID-19 gone bad: A new character in the spectrum of the hyperferritinemic syndrome? Autoimmun. Rev. 2020;19:102573. doi: 10.1016/j.autrev.2020.102573. - DOI - PMC - PubMed
    1. Bai L, et al. Genome-wide comparison of ferritin family from Archaea, Bacteria, Eukarya, and Viruses: its distribution, characteristic motif, and phylogenetic relationship. Naturwissenschaften. 2015;102:64. doi: 10.1007/s00114-015-1314-3. - DOI - PubMed
    1. Kernan KF, Carcillo JA. Hyperferritinemia and inflammation. Int Immunol. 2017;29:401–409. doi: 10.1093/intimm/dxx031. - DOI - PMC - PubMed

Publication types

LinkOut - more resources