

A global dataset of pandemic- and epidemic-prone disease outbreaks
- PMID: 36357405
- PMCID: PMC9648436
- DOI: 10.1038/s41597-022-01797-2
A global dataset of pandemic- and epidemic-prone disease outbreaks
Abstract
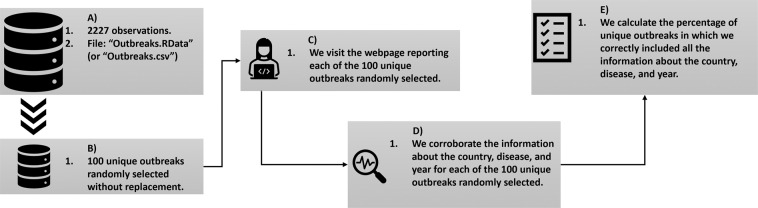
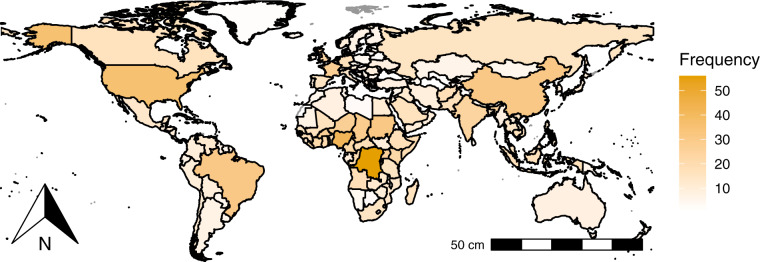
This paper presents a new dataset of infectious disease outbreaks collected from the Disease Outbreak News and the Coronavirus Dashboard produced by the World Health Organization. The dataset contains information on 70 infectious diseases and 2227 public health events that occurred over the period from January 1996 to March 2022 in 233 countries and territories around the world. We illustrate the potential use of this dataset to the research community by analysing the spatial distribution of disease outbreaks. We find evidence of spatial clusters of high incidences ("hot spots") in Africa, America, and Asia. This spatial analysis enables policymakers to identify the regions with the greatest likelihood of suffering from disease outbreaks and, taking into account their degree of preparedness and vulnerability, to develop policies that may help contain the spreading of future outbreaks. Further applications could focus on combining our data with other information sources to study, for instance, the link between environmental, globalization, and/or socioeconomic factors with disease outbreaks.
© 2022. The Author(s).
Conflict of interest statement
The authors declare no competing interests.
Figures


References
-
- WHO. WHO Coronavirus (COVID-19) Dashboard With Vaccination Data. Available at https://covid19.who.int/ (2022).
-
- WHO. Global Health Estimates 2019. Deaths by Cause, Age, Sex, by Country and by Region, 2000–2019, 2020.
Publication types
MeSH terms
LinkOut - more resources
Full Text Sources
Medical
