. 2022 Nov 10;13(1):6812.
doi: 10.1038/s41467-022-34646-2.

Development and validation of self-monitoring auto-updating prognostic models of survival for hospitalized COVID-19 patients

Affiliations

Development and validation of self-monitoring auto-updating prognostic models of survival for hospitalized COVID-19 patients

Todd J Levy et al. Nat Commun. .

Abstract

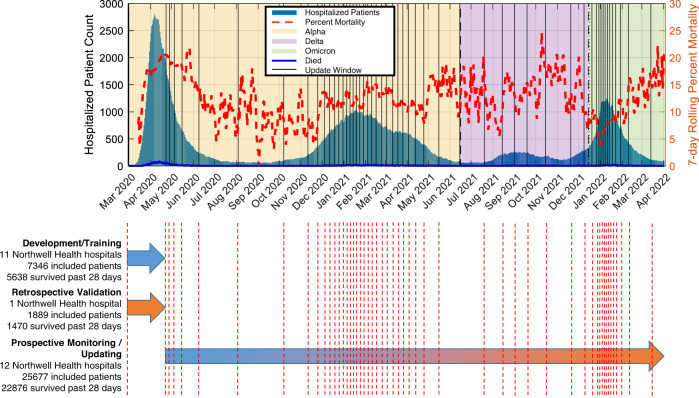
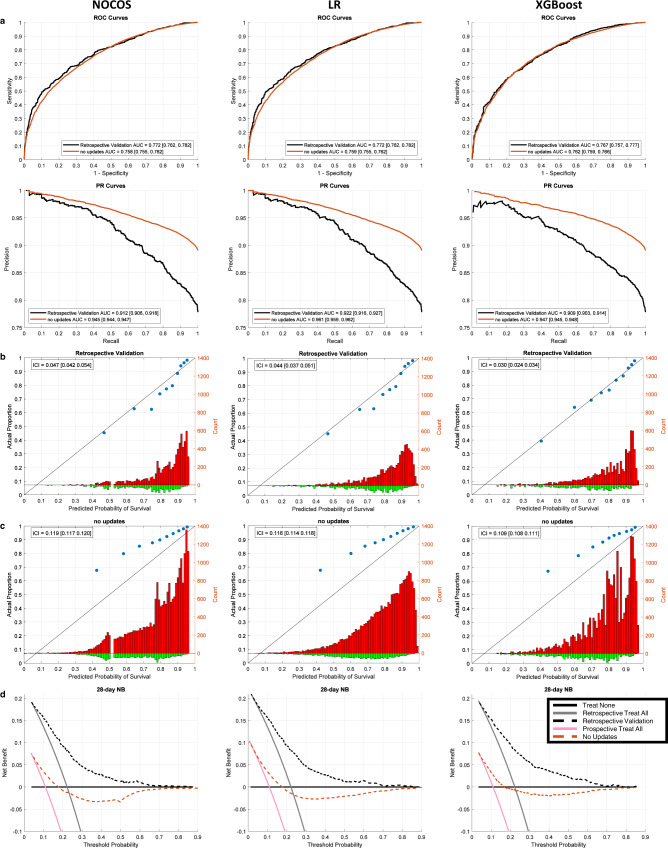
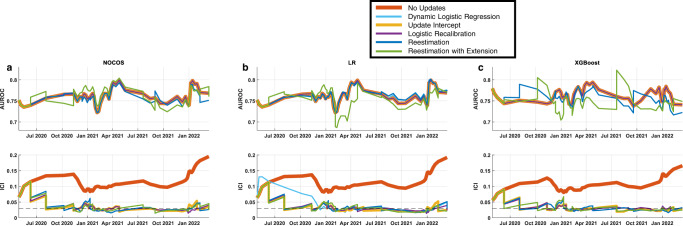
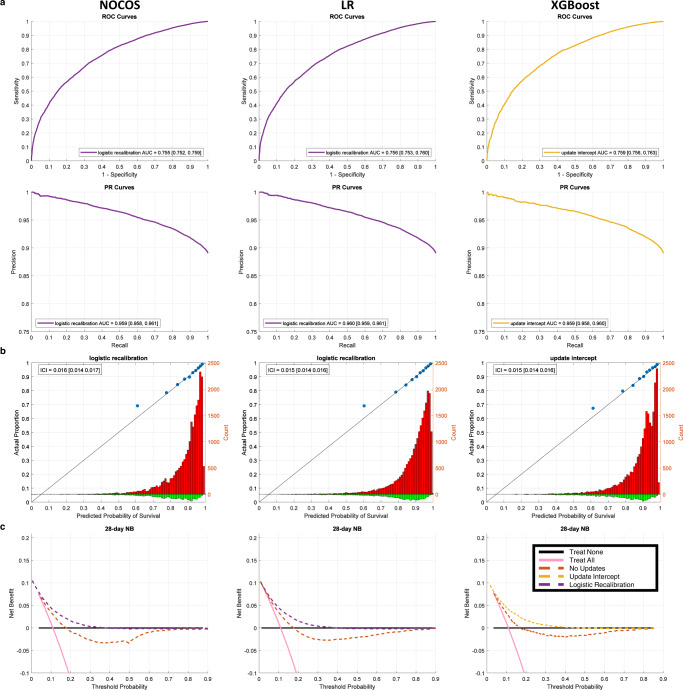
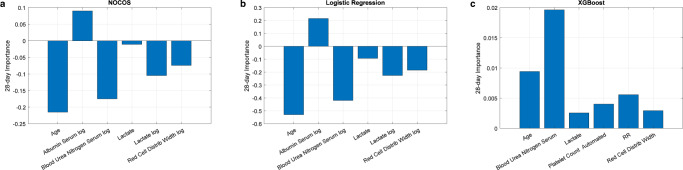
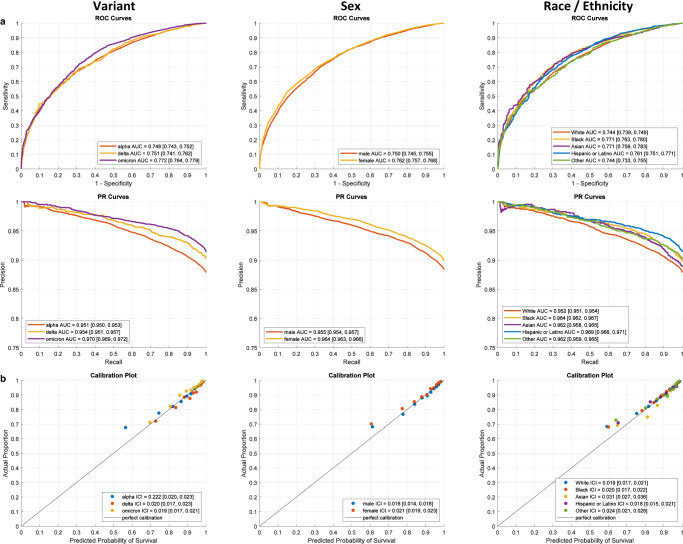
Clinical prognostic models can assist patient care decisions. However, their performance can drift over time and location, necessitating model monitoring and updating. Despite rapid and significant changes during the pandemic, prognostic models for COVID-19 patients do not currently account for these drifts. We develop a framework for continuously monitoring and updating prognostic models and apply it to predict 28-day survival in COVID-19 patients. We use demographic, laboratory, and clinical data from electronic health records of 34912 hospitalized COVID-19 patients from March 2020 until May 2022 and compare three modeling methods. Model calibration performance drift is immediately detected with minor fluctuations in discrimination. The overall calibration on the prospective validation cohort is significantly improved when comparing the dynamically updated models against their static counterparts. Our findings suggest that, using this framework, models remain accurate and well-calibrated across various waves, variants, race and sex and yield positive net-benefits.


Conflict of interest statement

The authors declare no competing interests.

Figures

Fig. 1
Fig. 1. Dataset overview and study design.
The data sets include training, retrospective validation, prospective monitoring/updating comprising 34,912 patients. The number of hospitalized patients across the course of the pandemic is plotted as blue bars, with the 7-day rolling average mortality plotted as a red dashed line. The three different dominant variants (alpha, delta and omicron) are represented as background colors). The vertical dashed red lines indicate the left edges of the 2000 patient sliding window that increments by 500 patients at a time. NOCOS Northwell COVID-19 Survival.
Fig. 2
Fig. 2. Retrospective and prospective validation of static 28-day survival models.
a ROC and PR curves with AUC and 95% CI for the retrospective (n = 1889) and prospective (n = 25,677; no updates) validation cohorts, b calibration plots for the retrospective validation cohort, c calibration plots for the prospective (no updates) validation cohort and d decision curves for the retrospective and prospective (no updates) cohorts based on the original NOCOS, logistic regression, and XGBoost models. The blue dots on the calibration plots show the actual proportion of outcomes averaged over deciles of the predicted probabilities. The red histograms show the counts of patients that survived past 28 days binned by the predicted probabilities. The green histograms show the counts of patients that died before 28 days binned by the predicted probabilities. The diagonal black lines indicate perfect calibration. The ICIs along with their 95% CIs are reported. ROC receiver operating characteristic, PR precision recall, AUC area under the ROC or PR curve, CI confidence interval, ICI integrated calibration index.
Fig. 3
Fig. 3. Temporal progression of performance metrics across all 28-day survival models and updating procedures.
Discrimination (AUROC) and calibration (ICI) performance metrics in a 2000-patient sliding window with a step size of 500 patients for the original and dynamically updated 28-day a NOCOS, b logistic regression, and c XGBoost models. The updating methods are listed in the legend, and dynamic logistic regression is only applicable to the logistic regression model. Updates are performed when the ICI is greater than the threshold of 0.03. AUROC area under the receiver operating characteristic curve, ICI integrated calibration index, LR logistic regression.
Fig. 4
Fig. 4. Prospective validation of all 28-day self-monitoring, auto-updating models.
a ROC and PR curves with AUC and 95% CI for the prospective (n = 25,677) validation cohort, b calibration plots for the prospective validation cohort, and c decision curves for the prospective cohort based on NOCOS updated using logistic recalibration, logistic regression updated using logistic recalibration, and XGBoost updated using intercept only recalibration. The blue dots on the calibration plots show the actual proportion of outcomes averaged over deciles of the predicted probabilities. The red histograms show the counts of patients that survived past 28 days binned by the predicted probabilities. The green histograms show the counts of patients that died before 28 days binned by the predicted probabilities. The diagonal black lines indicate perfect calibration. The ICIs along with their 95% CIs are reported. ROC receiver operating characteristic, PR precision recall, AUC area under the ROC or PR curve, CI confidence interval, ICI integrated calibration index.
Fig. 5
Fig. 5. 28-day model coefficient importance.
a NOCOS, b logistic regression, and c XGBoost model predictor importances are plotted. The importance of the NOCOS and logistic regression model predictors are the coefficients of the linear predictor scaled by the standard deviations of the predictors from the development cohort. The importance of the XGBoost model coefficients is the weighted average over the ensemble of trees of the difference in node risk between the parent and children nodes due to splitting at each predictor.
Fig. 6
Fig. 6. Sensitivity analysis of the 28-day updating NOCOS model across variants, sex and race/ethnicity.
a ROC and PR curves with AUC and 95% CI for the prospective (n = 25677) validation cohort and b their corresponding calibration plots based on the 28-day NOCOS updated with logistic recalibration. The model was filtered by variant, sex, and race/ethnicity. The points on the calibration plot show the actual proportion of outcomes averaged over deciles of the predicted probabilities. The diagonal black lines indicate perfect calibration. The ICIs along with their 95% CIs are reported. ROC receiver operating characteristic, PR precision recall, AUC area under the ROC or PR curve, CI confidence interval; ICI integrated calibration index.

Similar articles

Cited by

References

    1. Jones AE, Trzeciak S, Kline JA. The Sequential Organ Failure Assessment score for predicting outcome in patients with severe sepsis and evidence of hypoperfusion at the time of emergency department presentation. Crit. Care Med. 2009;37:1649–1654. - PMC - PubMed
    1. Lim W, et al. Defining community acquired pneumonia severity on presentation to hospital: an international derivation and validation study. Thorax. 2003;58:377–382. - PMC - PubMed
    1. Jarman B, et al. The hospital standardised mortality ratio: a powerful tool for Dutch hospitals to assess their quality of care? Qual. Saf. Health Care. 2010;19:9–13. - PMC - PubMed
    1. Steyerberg, E. W. et al. Prognosis Research Strategy (PROGRESS) 3: Prognostic Model Research. PLoS Med. 10, e1001381 (2013). - PMC - PubMed
    1. Haybittle JL, et al. A prognostic index in primary breast cancer. Br. J. Cancer. 1982;45:361–366. - PMC - PubMed

Publication types