. 2022 Nov 10;13(1):6792.
doi: 10.1038/s41467-022-34571-4.

Intranasal delivery of a rationally attenuated SARS-CoV-2 is immunogenic and protective in Syrian hamsters

Affiliations

Intranasal delivery of a rationally attenuated SARS-CoV-2 is immunogenic and protective in Syrian hamsters

Shufeng Liu et al. Nat Commun. .

Abstract

Few live attenuated severe acute respiratory syndrome coronavirus 2 (SARS-CoV-2) vaccines are in pre-clinical or clinical development. We seek to attenuate SARS-CoV-2 (isolate WA1/2020) by removing the polybasic insert within the spike protein and the open reading frames (ORFs) 6-8, and by introducing mutations that abolish non-structural protein 1 (Nsp1)-mediated toxicity. The derived virus (WA1-ΔPRRA-ΔORF6-8-Nsp1K164A/H165A) replicates to 100- to 1000-fold-lower titers than the ancestral virus and induces little lung pathology in both K18-human ACE2 (hACE2) transgenic mice and Syrian hamsters. Immunofluorescence and transcriptomic analyses of infected hamsters confirm that three-pronged genetic modifications attenuate the proinflammatory pathways more than the removal of the polybasic cleavage site alone. Finally, intranasal administration of just 100 PFU of the WA1-ΔPRRA-ΔORF6-8-Nsp1K164A/H165A elicits robust antibody responses in Syrian hamsters and protects against SARS-CoV-2-induced weight loss and pneumonia. As a proof-of-concept study, we demonstrate that live but sufficiently attenuated SARS-CoV-2 vaccines may be attainable by rational design.


Conflict of interest statement

S.L., C.B.S, P.S., C.Z.L., and T.T.W. are inventors on a patent filed by the U.S. FDA based on the results described in this manuscript. The remaining authors declare no competing interests.

Figures

Fig. 1
Fig. 1. Rational attenuation of SARS-CoV-2 WA1/2020.
a Top, genome organization of SARS-CoV-2. Leader sequence (red), transcriptional regulatory sequence within the leader sequence (TRS-L) and within the body (TRS-B) are highlighted in green. Bottom, either the polybasic insert “PRRA” (red) alone or together with ORF6-8 (green) were removed from the WA1/2020 genome. Locations of K164A/H165A and N128S/K129E are indicated at the bottom left of the figure. b Representative images of plaques formed by individual recombinant virus in Vero E6 cells. c Sanger sequencing result of Nsp1-K164A/H165A virus after passage 5. d A549-hACE2 cells were inoculated with indicated virus (n = 3 biological replicates) at multiplicity of infection (MOI) of 0.01. Output virus in the supernatants were determined on Vero E6 cells by plaque assay. e MatTek EpiAirway cells in 24-well plates were inoculated with indicated virus at MOI of 2. Supernatants collected at 2 (n = 6), 24 (n = 6), 48 (n = 5), 72 (n = 4), 96 (n = 3), and 120 (n = 2) hours post-infection (HPI) were titrated using a focus-forming assays biological replicates. Error bars for d and e indicate standard deviation. Data presented are representatives of two independent experiments with multiple biological replicates. Source data are provided as a Source data file. f MatTek EpiAirway cells from (e) were fixed in 10% formalin followed by immunostaining of nucleocapsid protein (in green) at 1, 2, 3, 5 dpi with one biological replicate per time point. Nuclei were counterstained by DAPI (in blue). Scale bar, 300 μm.
Fig. 2
Fig. 2. Attenuation of Nsp1-K164A/H165A in the respiratory tract of K18-hACE2 mice.
a Overall design of the study. bd Weight loss (b), survival (c), and clinical scores (d) were recorded in infected mice for up to 8 days following infection. Data in bd reflect n = 10 mice/group from one experiment. e, f infectious viral titers of nasal turbinates at 2 dpi (e) or 4 dpi (f) were determined by plaque-forming assays. Each solid circle represents one animal. **p = 0.0229, one-way ANOVA. ns, non-significant. gi infectious viral titers of lung homogenates at 2 dpi (g), 4 dpi (h), and 6 dpi (i). Median log10-transformed infectious titers at 2 dpi are 6.3 (IQR, 5.2 to 6.7), 5.4 (IQR, 2.2 to 5.8), 4.3 (IQR, 3.3 to 4.8), and 4.7 (IQR, 2.4 to 5.8) for WA1/2020, ΔPRRA, Nsp1-K164A/H165A, and Nsp1-N128S/K129E, respectively. Median log10-transformed infectious titers at 6 dpi are 5.4 (IQR, 5.0 to 5.5), 5.4 (IQR, 4.7 to 5.5), 3.9 (IQR, 3.3 to 4.2), and 4.5 (IQR, 2.5 to 5.2) for WA1/2020, ΔPRRA, Nsp1-K164A/H165A, and Nsp1-N128S/K129E, respectively. *p < 0.05, ***p < 0.001. j Log10-transformed sgRNA titers (E gene) were quantified by RT-qPCR. *p < 0.05. km Infectious viral titers of brain homogenates at 2 dpi (k), 4 dpi (i), and 6 dpi (m). *p < 0.05, **p < 0.01. Data in em reflect n = 5 WA1/2020, n = 6 ΔPRRA, n = 6 Nsp1-K164A/H165A, n = 6 Nsp1-N128S/K129E, or n = 2 uninfected mice/group from one experiment. Statistical analyses were done by one-way ANOVA in this figure. Error bars indicate standard deviation. nw H&E stained lungs from uninfected (n, o), WA1/2020 (p, q), ΔPRRA (r, s), Nsp1-K164A/H165A (t, u), Nsp1-N128S/K129E (v, w). Red dotted lines denote areas of impact (consolidated). (o), (q), (s), (u), and (w) are closeup images of (n), (p), (r), (t), and (v), respectively. Experiments were conducted once, with multiple biological replicates. Source data are provided as a Source data file. Scale bar in (n), (p), (r), (t), and (v), 500 μm; in (o), (q), (s), (u), and (w), 90 μm.
Fig. 3
Fig. 3. Attenuation of Nsp1-K164A/H165A in Syrian hamsters.
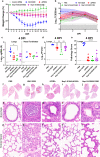
a Weight loss of Syrian hamsters after infection with 104 PFU of WA1/2020 (n = 7), ΔPRRA (n = 7), Nsp1-N128S/K129E (n = 7), Nsp1-K164A/H165A (n = 4), or PBS (n = 11). Error bars indicate standard deviation. b Median Log10 infectious titers in nasal wash samples WA1/2020 (5.9, IQR 4.3 to 6.8, n = 11), ΔPRRA (5.0, IQR 3.7 to 5.9, n = 15), Nsp1-N128S/K129E (4.3, IQR 3.8 to 5.4, n = 17), Nsp1-K164A/H165A (3.9, IQR 3.3 to 4.9, n = 8), or PBS (n = 2). Dotted, colored lines and color-filled areas marked by dotted lines indicate error bands (standard deviations). The limit of quantification is 200 TCID50/ml. Data for WA1/2020, ΔPRRA, Nsp1-N128S/K129E, and Nsp1-K164A/H165A reflect hamsters from two independent experiments. Error bars indicate standard deviation. c Log10-transformed sgRNA (E gene) titers in the lung for WA1/2020 (n = 6), ΔPRRA (n = 7), Nsp1-K164A/H165A (n = 4), Nsp1-N128S/K129E (n = 6), or PBS (n = 2) and nasal turbinates at 4 dpi for WA1/2020 (n = 3), ΔPRRA (n = 4), Nsp1-K164A/H165A (n = 4), Nsp1-N128S/K129E (n = 3), or PBS (n = 2). Each solid circle denotes one animal. *p = 0.0011, one-way ANOVA. d Log10-transformed infectious titers in the lung at 4 dpi for WA1/2020 (n = 4), ΔPRRA (n = 7), Nsp1-K164A/H165A (n = 4), Nsp1-N128S/K129E (n = 8), or PBS (n = 2). *p < 0.05, **p < 0.01, one-way ANOVA. e Cumulative histopathology scores of infected lungs at 4 dpi for WA1/2020 (n = 5), ΔPRRA (n = 8), Nsp1-K164A/H165A (n = 8), Nsp1-N128S/K129E (n = 7), or PBS (n = 2). ****p < 0.0001, one-way ANOVA. Source data are provided as a Source data file. fj Representative images from H&E stained lungs from hamsters infected by PBS (f), WA1-2020 (g), ΔPRRA (h), Nsp1-K164A/H165A (i), Nsp1-N128S/K129E (j). Data are from n = 4 hamsters/group from one experiment. Red dotted lines denote areas of impact (consolidated). scale bar in fj, 5 mm. ko are representative images of bronchioles corresponding to fj, respectively. l Massive luminal immune infiltrates. m Peribronchiolar infiltrates (white circle). o Peribronchiolar infiltrates (white circle). Scale bar in ko, 60 μm. pt are representative images of alveolar space corresponding to (fj), respectively. q Oedema, immune infiltrates, alveolar wall thickening. r Alveolar wall thickening, loss of alveolar space, type II pneumocyte hyperplasia. t Loss of alveolar space and alveolar wall thickening. Scale bar in pt, 60–80 μm.
Fig. 4
Fig. 4. Attenuation of virus propagation, macrophage accumulation, and epithelial damage in Nsp1-K164A/H165A-infected hamster lungs.
a Representative images of serial lung sections immunostained for Iba1 and prosurfactant protein C (ProSPC) or SARS-CoV-2 nucleocapsid protein after infection with PBS (a), WA1/2020 (b), ΔPRRA (c), Nsp1-K164A/H165A (d), Nsp1-N128S/K129E (e). Consolidated regions in WA1/2020-infected lungs with massive Iba1 positive macrophage infiltration around affected bronchioles (b). Alveolar epithelium surrounding consolidated regions in WA1/2020 stains prominently for viral nucleocapsid (b), while nucleocapsid staining is limited to bronchiolar epithelium in Nsp1-K164A/H165A (inset, d). f Digitally magnified images of macrophage-rich consolidation regions in WA1/2020-infected lungs show loss of ProSPC-stained alveolar type 2 cells. Viral antigen staining of infiltrates within and surrounding affected bronchioles with loss of RAGE-expressing type 1 epithelium in the same regions with consolidated macrophages (asterisk, g). Nuclei were counterstained with Hoechst 33342 dye (blue). Scale bars: 500 mm (ae), 100 mm (f, g). Experiments were conducted once, with multiple biological replicates.
Fig. 5
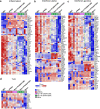
Fig. 5. Heatmap analysis of interferon and inflammation signaling pathways in nasal turbinates.
Genes associated with inflammation (a), interferon-alpha response (b), interferon-gamma response (c), and TLR responses (d) are presented in this figure. Each solid square represents one hamster. Five groups (uninfected, WA1/2020, ΔPRRA, Nsp1-K164A/H165A, and Nsp1-N128S/K129E) were coded in light charcoal, blue, red, green, and purple, respectively. The data represents the Z-scores derived from FPKM values of RNAseq transcriptomic analysis. Red, positive Z-Score denotes upregulation and blue, negative Z-score for downregulation. Genes in the yellow box were those that are specifically upregulated in Nsp1-K164A/H165A-infected hamsters. Genes in the green box were those that were expressed to a lesser degree in Nsp1-K164A/H165A group than in WA1/2020 or ΔPRRA or Nsp1-N128S/K129E groups.
Fig. 6
Fig. 6. Intranasal immunization of Syrian hamsters with Nsp1-K164A/H165A induced potent humoral responses and protected against WA1/2020 challenge.
a Overall study design. b, c Serum IgG antibody titers at 0 (n = 7), 14 (n = 7–11), 28 (n = 4–7) days and IgA antibody titer at 28 (n = 4–9) days post-immunization measured by RBD (spike) binding ELISA (b) or anti-spike neutralizing antibody titers at 28 dpi (c). ****p < 0.0001, one-way ANOVA. d Weight loss profiles of immunized and convalescent hamsters after re-challenge with WA1/2020. Error bars in b and d indicate standard deviation. eh Infectious viral titers detected in nasal wash samples collected at 1, 2, 3, and 4 dpc. Median Log10 infectious titers at 1 dpc are 2.3 (IQR 2.3 to 3.1) for WA1/2020 convalescent hamsters, 3.8 (IQR 3.6 to 4.0) for ΔPRRA convalescent group, 3.8 (IQR 3.1 to 4.8) for Nsp1-N128S/K129E convalescent group, 2.3 (IQR 2.3 to 4.8) for Nsp1-K164A/H165A 104 PFU vaccinated group, 3.2 (IQR 3.0 to 3.7) for 103 PFU vaccinated group, 3.3 (IQR 2.5 to 4.5) for Nsp1-K164A/H165A 100 PFU vaccinated group, and 6.4 (IQR 5.3 to 7.1) for mock vaccinated hamsters. For e through l, **p < 0.01, ***p < 0.001, and ****p < 0.0001 based on one-way ANOVA. Sample sizes for bh: for WA1/2020 (n = 7), ΔPRRA (n = 7), Nsp1-K164A/H165A (n = 4 per dose), Nsp1-N128S/K129E (n = 6), or unvaccinated (n = 9). ij Infectious viral titers and sgRNA titers from tissues at 4 dpc, respectively. k, l infectious viral titers and sgRNA titers from tissues at 7 dpc, respectively. P-values are summarized based on the scheme: *p < 0.05, **p < 0.01, ***p < 0.001, ****p < 0.0001 using one-way ANOVA. Data shown in bh reflect hamsters pooled from two independent experiments. Data shown in il reflect hamsters from one experiment. Each solid circle represents one animal. Source data are provided as a source data file.
Fig. 7
Fig. 7. Syrian hamsters immunized with Nsp1-K164A/H165A displayed minimal lung pathology upon WA1/2020 challenge.
This fugure summarizes the results after histopathological examination of the hamsters from Fig. 6i–l. a Percentages of impacted areas in the lungs at 4 and 7 dpc. b Cumulative histopathology scores in the lungs at 7 dpc. Error bars in a and b indicate standard deviation. P-values are summarized for a and b based on one-way ANOVA (**p < 0.01, ****p < 0.0001). c Heatmap of histopathology scores in the lungs at 7 dpc based on each category (see “Methods” for scoring criteria). Each solid square on top of the heatmap represents one hamster. Seven groups (uninfected, mock vaccinated and then challenged, WA1/2020 infected and then challenged, ΔPRRA infected and then challenged, Nsp1-N128S/K129E infected and challenged, immunized with 1000 PFU Nsp1-K164A/H165A and challenged, immunized with 100 PFU Nsp1-K164A/H165A and challenged) were coded in light gray, orange, blue, red, purple, green, and light green, respectively. Each solid shape represents one animal. Samples collected at 4 dpc for WA1/2020 (n = 4), ΔPRRA (n = 4), Nsp1-K164A/H165A (n = 4), Nsp1-N128S/K129E (n = 3), or mock vaccinated (n = 2) are combined from 2 separate experiments. Samples collected at 7 dpc for WA1/2020 (n = 3), ΔPRRA (n = 3), Nsp1-K164A/H165A (n = 4 for both doses), Nsp1-N128S/K129E (n = 3), mock vaccinated (n = 5), or unchallenged (n = 2) are also pooled from 2 separate experiments.

Similar articles

Cited by

References

    1. Ella R, et al. Efficacy, safety, and lot-to-lot immunogenicity of an inactivated SARS-CoV-2 vaccine (BBV152): interim results of a randomised, double-blind, controlled, phase 3 trial. Lancet. 2021;398:2173–2184. - PMC - PubMed
    1. Mok, C. K. P. et al. Comparison of the immunogenicity of BNT162b2 and CoronaVac COVID-19 vaccines in Hong Kong. Respirology10.1111/resp.14191 (2021). - PMC - PubMed
    1. Khoury DS, et al. Neutralizing antibody levels are highly predictive of immune protection from symptomatic SARS-CoV-2 infection. Nat. Med. 2021;27:1205–1211. - PubMed
    1. Tartof SY, et al. Effectiveness of mRNA BNT162b2 COVID-19 vaccine up to 6 months in a large integrated health system in the USA: a retrospective cohort study. Lancet. 2021;398:1407–1416. - PMC - PubMed
    1. Abu-Raddad, L. J. et al. Effect of mRNA vaccine boosters against SARS-CoV-2 omicron infection in Qatar. N. Engl. J. Med. 10.1056/NEJMoa2200797 (2022). - PMC - PubMed

Publication types

Substances