. 2022 Nov 10;12(1):19198.
doi: 10.1038/s41598-022-23160-6.

Assessment of ground deformation and seismicity in two areas of intense hydrocarbon production in the Argentinian Patagonia

Affiliations

Assessment of ground deformation and seismicity in two areas of intense hydrocarbon production in the Argentinian Patagonia

Guillermo Tamburini-Beliveau et al. Sci Rep. .

Erratum in

Abstract

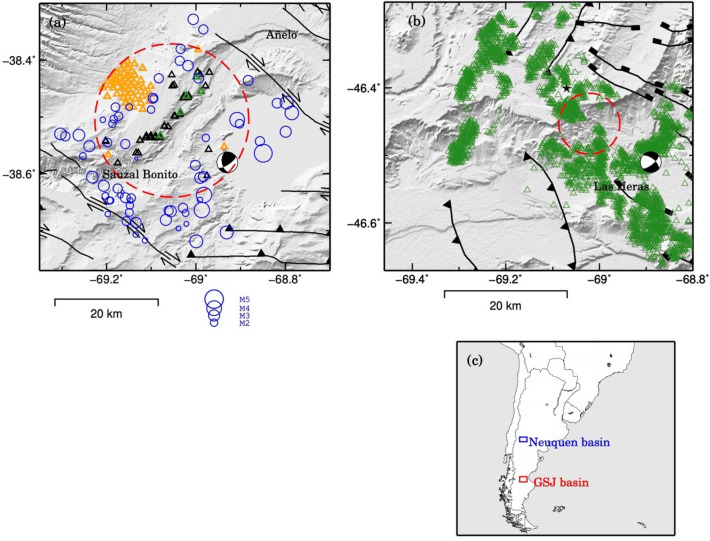
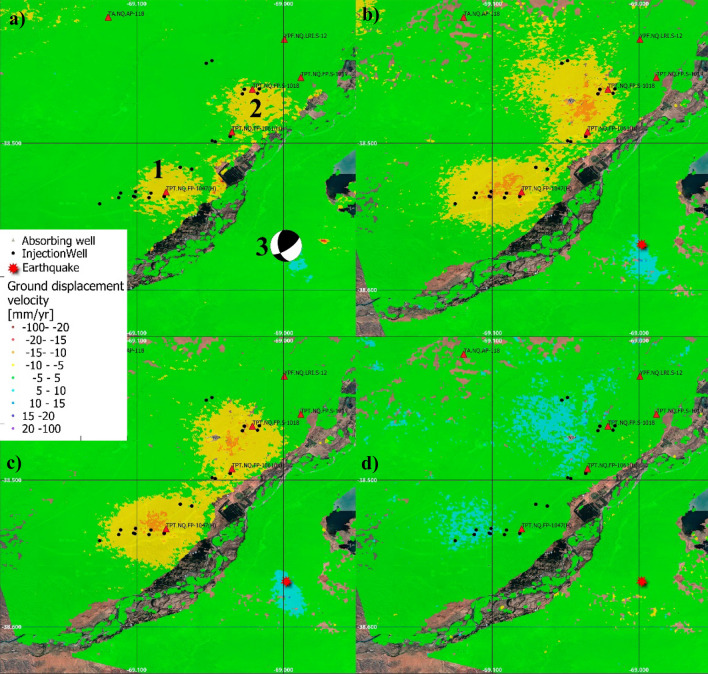
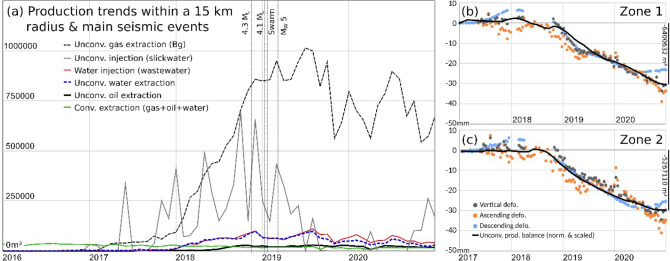
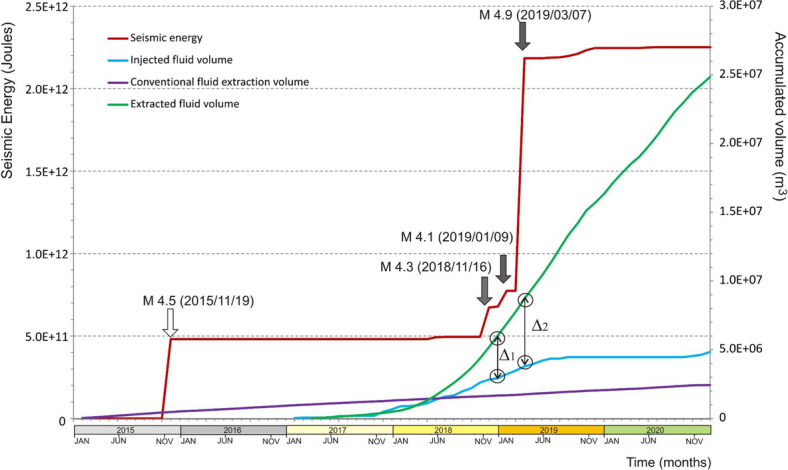
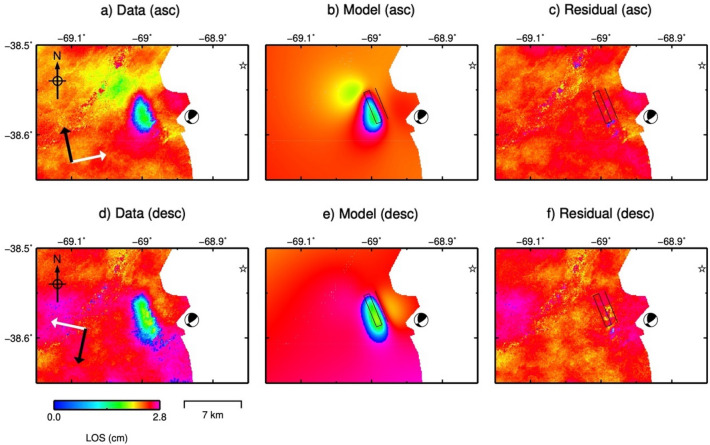
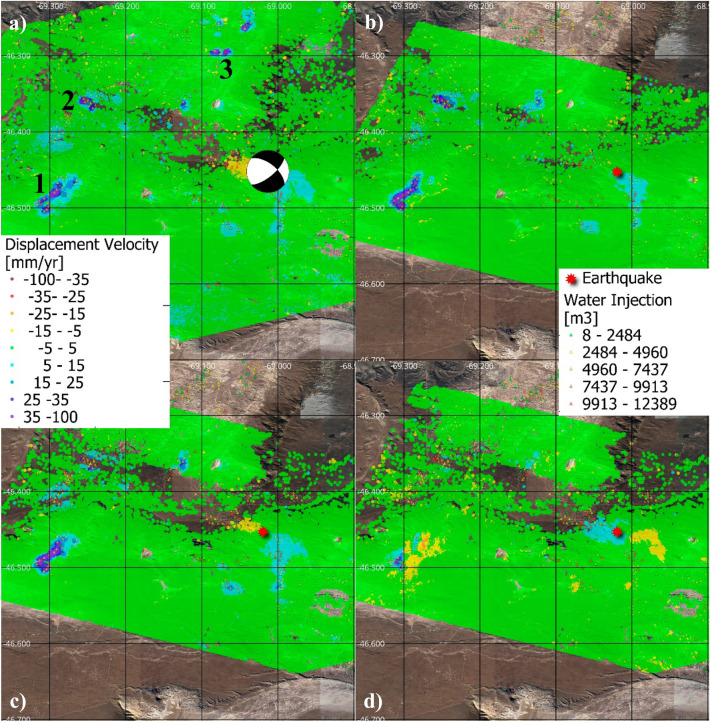
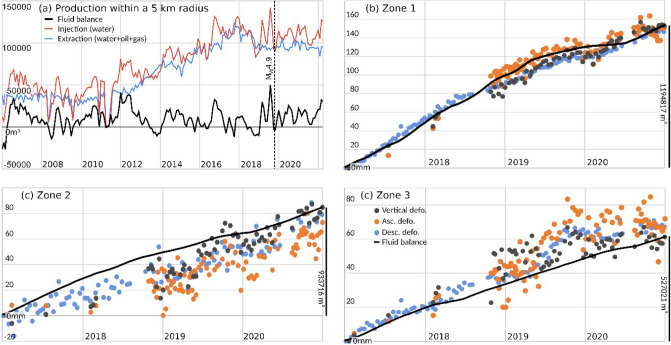
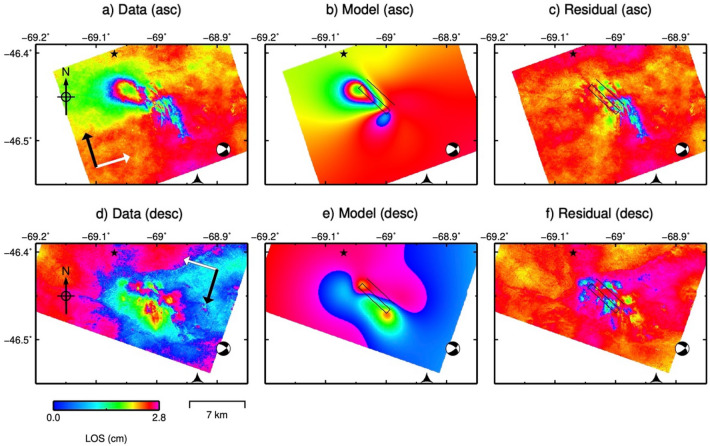
The exploitation of both conventional and unconventional hydrocarbons may lead to still not well-known environmental consequences such as ground deformation and induced/triggered seismicity. Identifying and characterizing these effects is fundamental for prevention or mitigation purposes, especially when they impact populated areas. Two case studies of such effects on hydrocarbon-producing basins in Argentina, the Neuquén and the Golfo de San Jorge, are presented in this work. The intense hydrocarbon production activities in recent years and their potential link with the occurrence of two earthquakes of magnitude 4.9 and 5 near the operating well fields is assessed. A joint analysis of satellite radar interferometry and records of fluid injection and extraction demonstrate that, between 2017 and 2020, vertical ground displacements occurred in both study areas over active well fields that might indicate a correlation to hydrocarbon production activities. Coseismic deformation models of the two earthquakes constrain source depths to less than 2 km. The absence of seismicity before the beginning of the hydrocarbon activities in both areas, and the occurrence of the two largest and shallow earthquakes in the vicinity of the active well fields just after intensive production periods, points towards the potential association between both phenomena.


Conflict of interest statement

The authors declare no competing interests.

Figures

Figure 1
Figure 1
Study areas in the Argentinian Patagonia. Data are plotted on SRTM topography displayed in shaded relief. (a) Neuquén basin area. Blue circles represent epicentres of seismic events scaled by local magnitude (ML) occurred in the period November 2015 to November 2020, from the Instituto Nacional de Prevención Sísmica (INPRES) catalog. The red dashed circle indicates the 15 km radius area analysed in Fig. 3a. Black triangles indicate the location of fracking wells (where unconventional hydrocarbons are extracted after slickwater injection), orange triangles indicate the location of conventional wells and green triangles indicate the location of wastewater injection wells (locations from the Argentine Energy Secretariat). Black lines indicate the main faults from. The Global Centroid Moment Tensor (GCMT, www.globalcmt.org/) focal mechanism of the 07/03/2019 earthquake (ML 4.9, Mw 5) is shown. (b) Golfo de San Jorge area. Green triangles represent production wells. Black lines indicate the main faults. The red dashed circle indicates the 5 km radius area analysed in Fig. 7a. The Global Centroid Moment Tensor (GCMT) focal mechanism of the 17/10/2019 earthquake (ML 5, Mw 4.9) is shown. (c) Inset map showing the region of South America with the two study areas delineated in blue (Neuquén basin) and red (GSJ basin).
Figure 2
Figure 2
Ground displacement velocity maps obtained from ascending (a) and descending trajectory (b) superimposed to a Google satellite image. (c) and (d) Show the ground displacement vertical and West–East component respectively. The analysed period spans from January 2017 to December 2020. Main deformation zones labelled 1 and 2 correspond to areas with high concentration of wells, 33 and 25 respectively. Absorbing Wells (red triangles) indicate the location of wastewater disposal wells. Red star indicates the main area affected by the ML 4.9, 2019 March 7 earthquake and 3 shows its Global Centroid Moment Tensor (GCMT) focal mechanism.
Figure 3
Figure 3
(a) Evolution of hydrocarbon production (in m3) between 2016 and 2020 in the area bounded by the red dashed circle in Fig. 1a. The vertical dashed lines show the main seismic events. Panels (b) and (c) show the time series of ground deformation for zones 1 and 2, respectively, during the period 2017–2020 and the monthly accumulated unconventional production balance (black line) normalised and inversely scaled. The vertical scale bar in the right axis of figures (b) and (c) provide information on the total accumulated volumetric amount (m3) of unconventional fluid balance.
Figure 4
Figure 4
Accumulated seismic energy released (in Joules) recorded by INPRES between 2015 and 2020, versus different underground operations within the Neuquén basin study area (in m3). Blue and green lines show injected and extracted fluid volume, respectively, using unconventional methods. Purple line shows extracted fluid volume using conventional methods. The production data used for this figure are the same used in Fig. 3.
Figure 5
Figure 5
(a) and (d) Show coseismic Line-Of-Sight (LOS) deformation of the Mw 5, 2019 March 7 Neuquén basin earthquake obtained as the average of 11 coseismic ascending interferograms (in a) and as the average of 10 coseismic descending interferograms (in d). The white arrows indicate satellite Line-of-Sight direction (LOS) and the black arrows indicates satellite azimuth (Az). (b) and (e) Show LOS deformation predicted by the forward model using the maximum a posteriori probability solution. (c) and (f) show the residuals. The black rectangle represents the outline of the optimal fault plane. The Global Centroid Moment Tensor (GCMT, www.globalcmt.org/) is represented by the beach ball.
Figure 6
Figure 6
Ground displacement velocity maps obtained exploiting the SBAS technique observed from ascending trajectory (a) and descending trajectory (b) in the GSJ basin superimposed to a Google satellite image (c) and (d) show the ground displacement vertical and West–East component respectively. The analysed period spans from January 2017 to December 2020. Positive LOS values are movements towards the satellite. (1, 2, 3) point the areas with higher rates. The red star indicates the location of the ML 5 2019 October 17 earthquake epicentre. (a) Shows The Global Centroid Moment Tensor (GCMT) focal mechanism of this earthquake.
Figure 7
Figure 7
(a) Production trends for the last 15 years in an area of 5 km radius (indicated by the red dashed circle in Fig. 1b) that includes the 223 wells (with an average depth of 1.5 km) located around the 2019 October 17 earthquake epicentre (red star in Fig. 6) in the GSJ basin. Fluid (water and hydrocarbons) extraction (blue) and injection (water, red) and balance between them (injection minus extraction, black). The date of the occurrence of the earthquake is indicated by a vertical line in the chronological axis. The earthquake occurs immediately after the highest injection historic peak and in the strongest and sudden historical imbalance. (bd) Plots of time-series of deformation (orange for ascending orbit, blue for descending orbit) and standardised fluid balance (black line) for wells over the deformation zones labelled 1,2,3 in Fig. 6a. (b) Represents the trends of 85 recovery wells inside deformation zone 1, (c) 29 wells in zone 2, and (d) 15 wells in zone 3. Besides the standardisation, the scale bar in the right vertical axis provides the magnitude of the accumulated fluid balance during the analised period for the whole deformation zone.
Figure 8
Figure 8
(a) and (d) Show co-seismic Line-Of-Sight (LOS) deformation of the Mw 4.9, 2019 October 17 GSJ basin earthquake obtained as the average of 4 and 6 co-seismic ascending and descending interferograms, respectively. The white arrows indicate satellite Line-of-Sight direction (LOS) and the black arrows indicates satellite azimuth (Az). (b) and (e) Show LOS deformation predicted by the forward model using the maximum a posteriori probability solution. (c) and (f) Show the residuals. The black rectangle represents the outline of the optimal fault plane, and the beach ball represents the fault plane solution from The Global Centroid Moment Tensor (GCMT, www.globalcmt.org/).

Similar articles

Cited by

References

    1. Kim J-W, Lu Z. Association between localized geohazards in West Texas and human activities, recognized by Sentinel-1A/B satellite radar imagery. Sci. Rep. 2018 doi: 10.1038/s41598-018-23143-6. - DOI - PMC - PubMed
    1. Shirzaei M, Ellsworth WL, Tiampo KF, González PJ, Manga M. Surface uplift and time-dependent seismic hazard due to fluid injection in eastern Texas. Science. 2016;353(6306):1416–1419. doi: 10.1126/science.aag0262. - DOI - PubMed
    1. Semple AG, Pritchard ME, Lohman RB. An incomplete inventory of suspected human-induced surface deformation in North America detected by satellite interferometric synthetic-aperture radar. Remote Sens. 2017;9:1296. doi: 10.3390/rs9121296. - DOI
    1. Segall P, Grasso J-R, Mossop A. Poroelastic stressing and induced seismicity near the Lacq gas field, southwestern France. J. Geophys. Res. 1994;99(B8):15423–15438. doi: 10.1029/94JB00989. - DOI
    1. Van Thienen-Visser K, Breunese JN. Induced seismicity of the Groningen gas field: History and recent developments. Lead. Edge. 2015;34(6):664–671. doi: 10.1190/tle34060664.1. - DOI

Publication types