. 2022 Nov;8(11):1289-1303.
doi: 10.1038/s41477-022-01270-3. Epub 2022 Nov 10.

Polymerization of the backbone of the pectic polysaccharide rhamnogalacturonan I

Affiliations

Polymerization of the backbone of the pectic polysaccharide rhamnogalacturonan I

Robert A Amos et al. Nat Plants. 2022 Nov.

Erratum in

Abstract

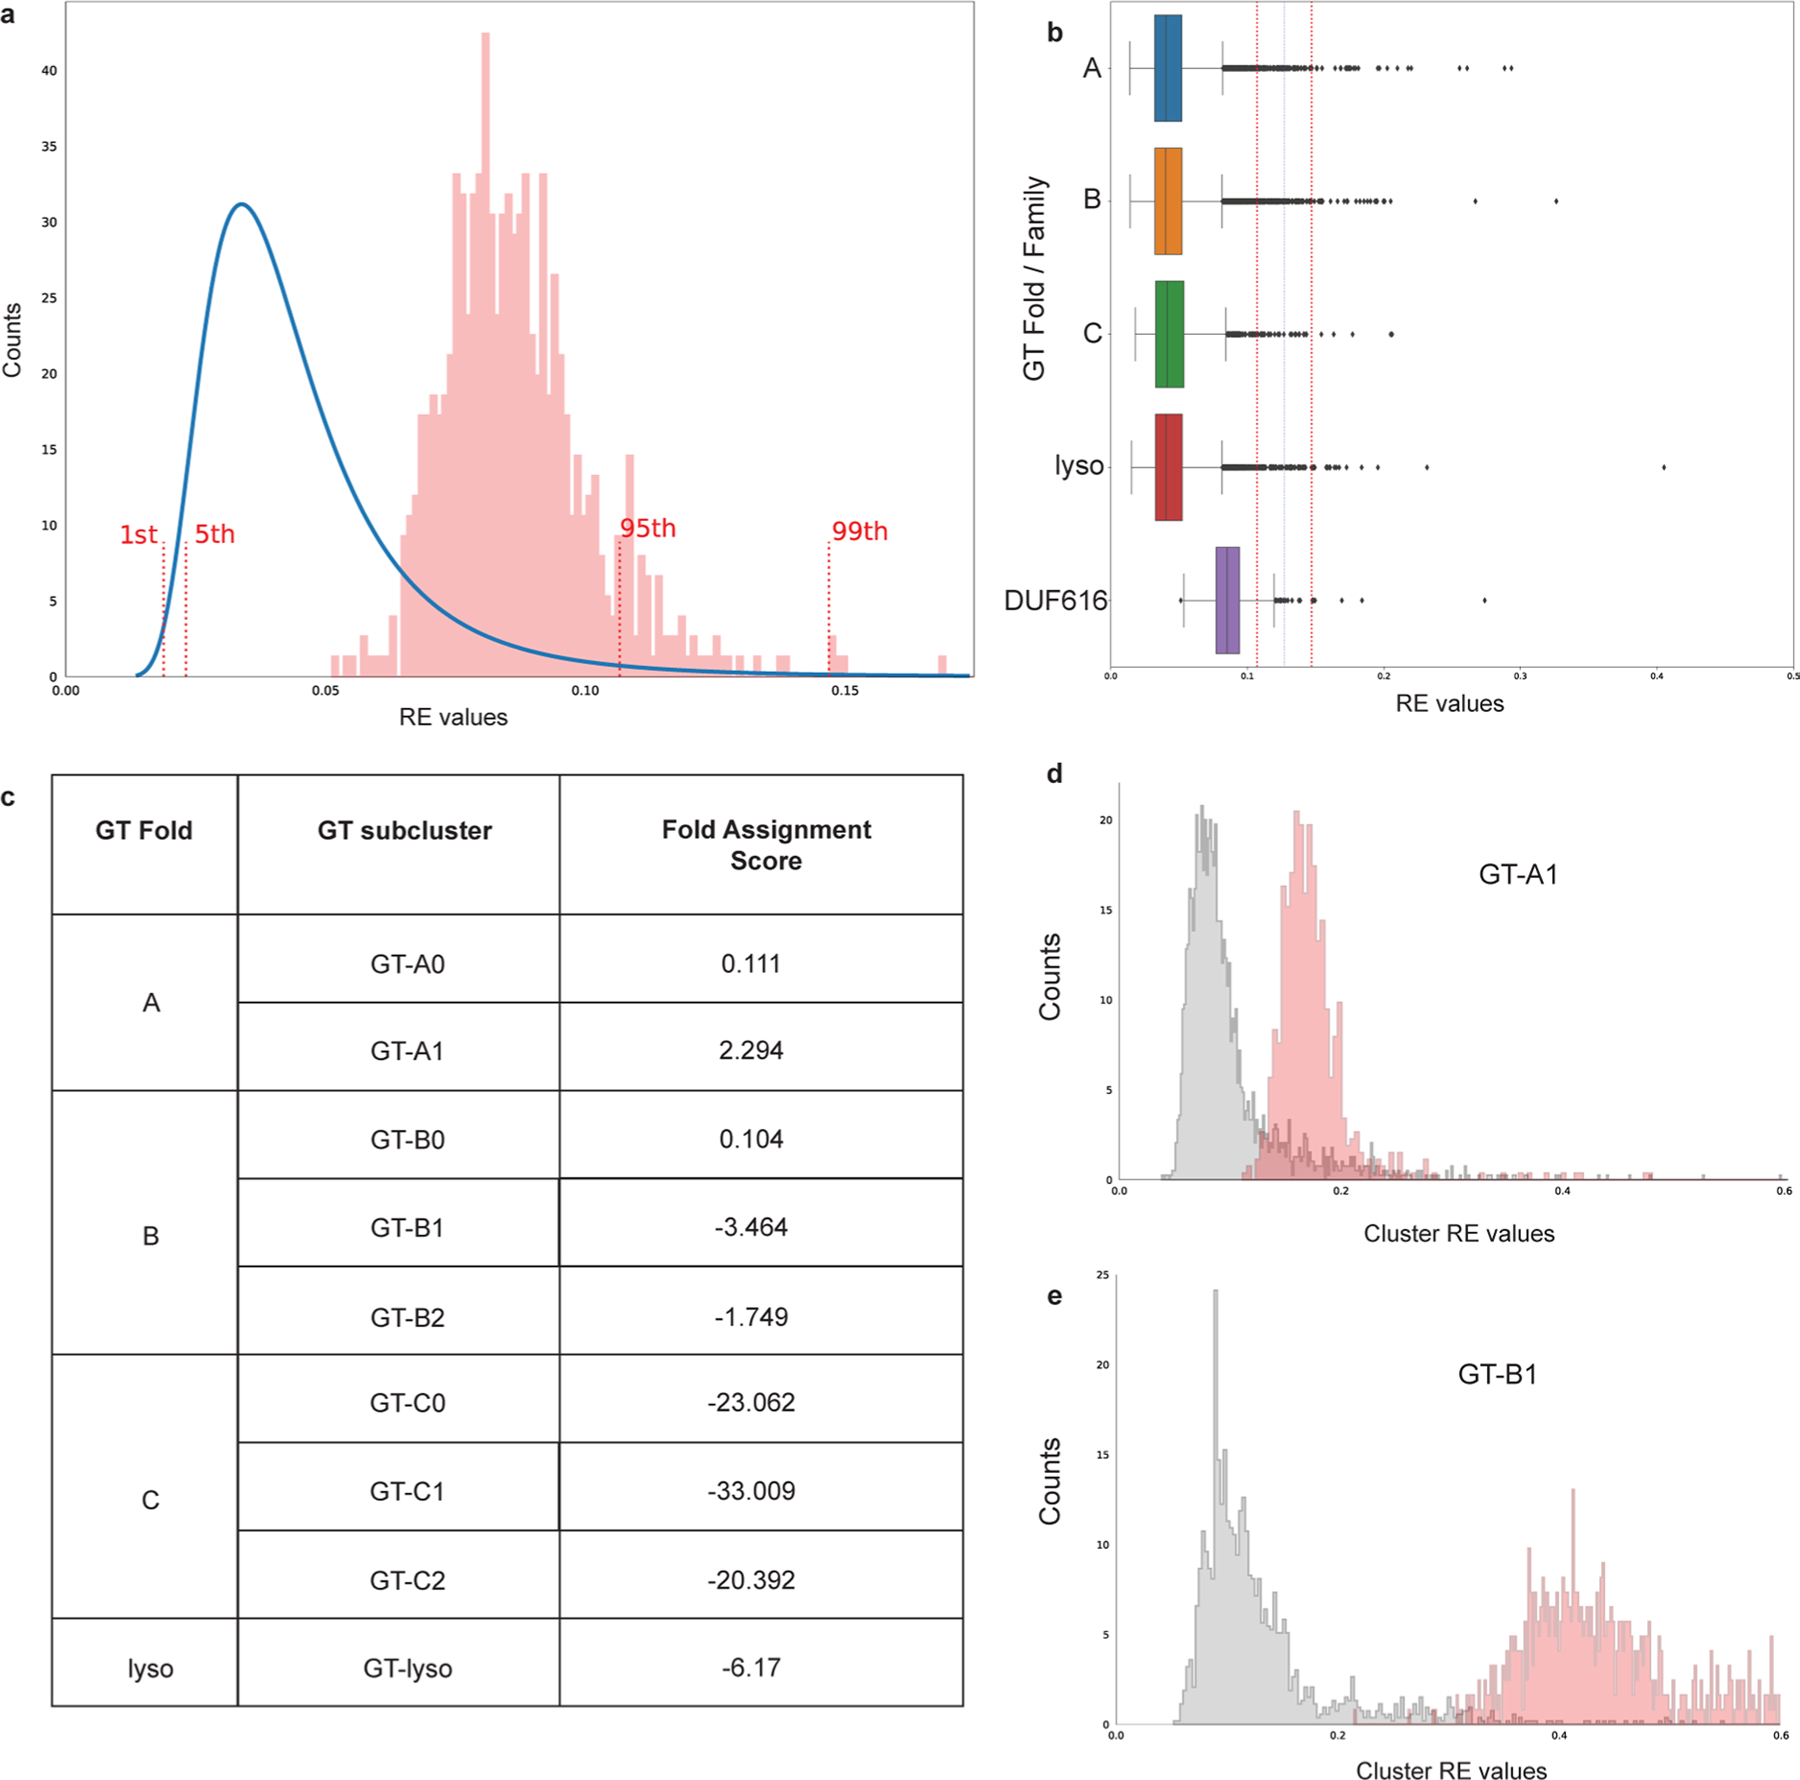
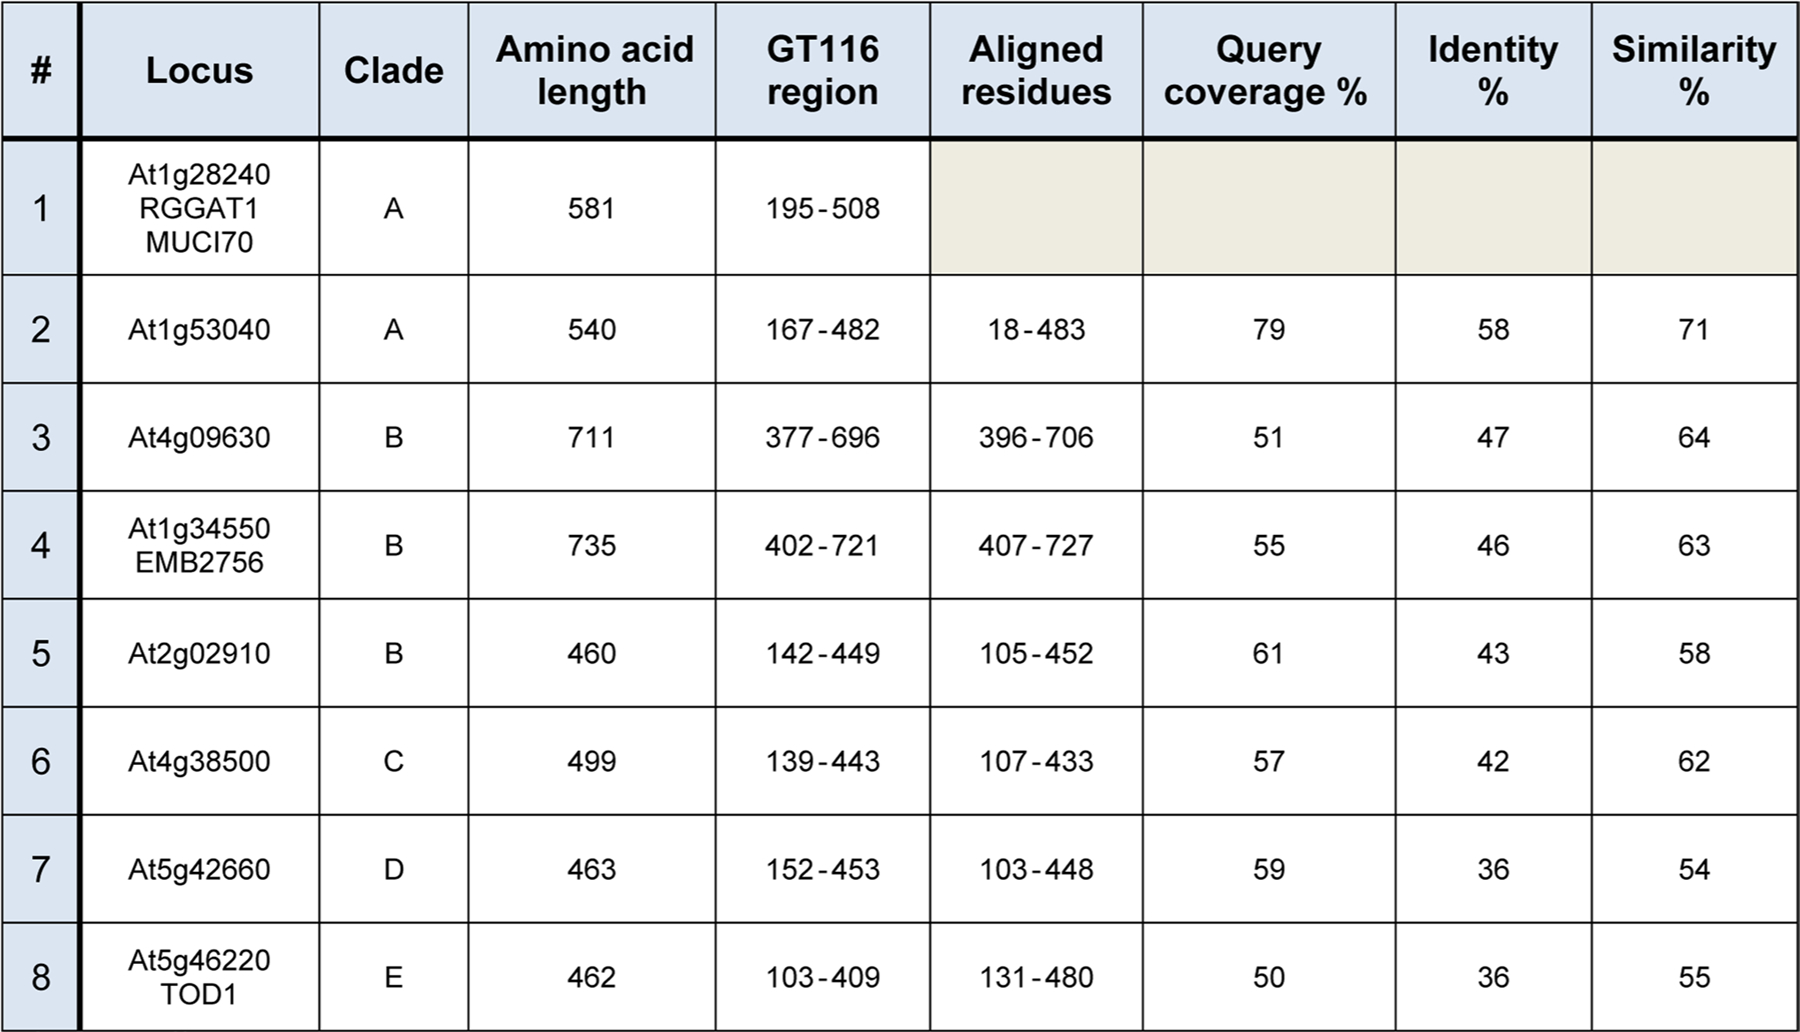
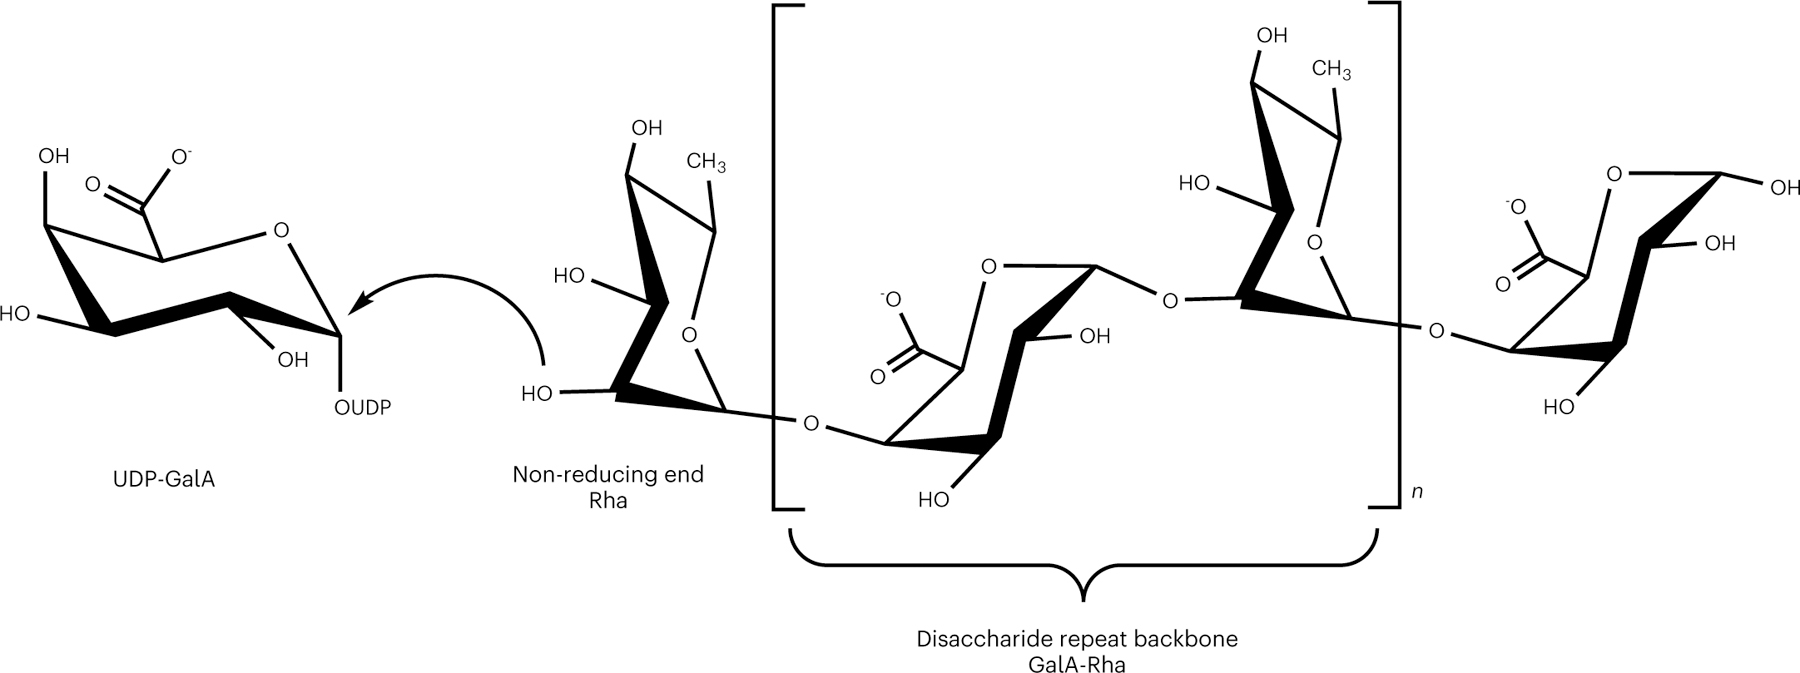
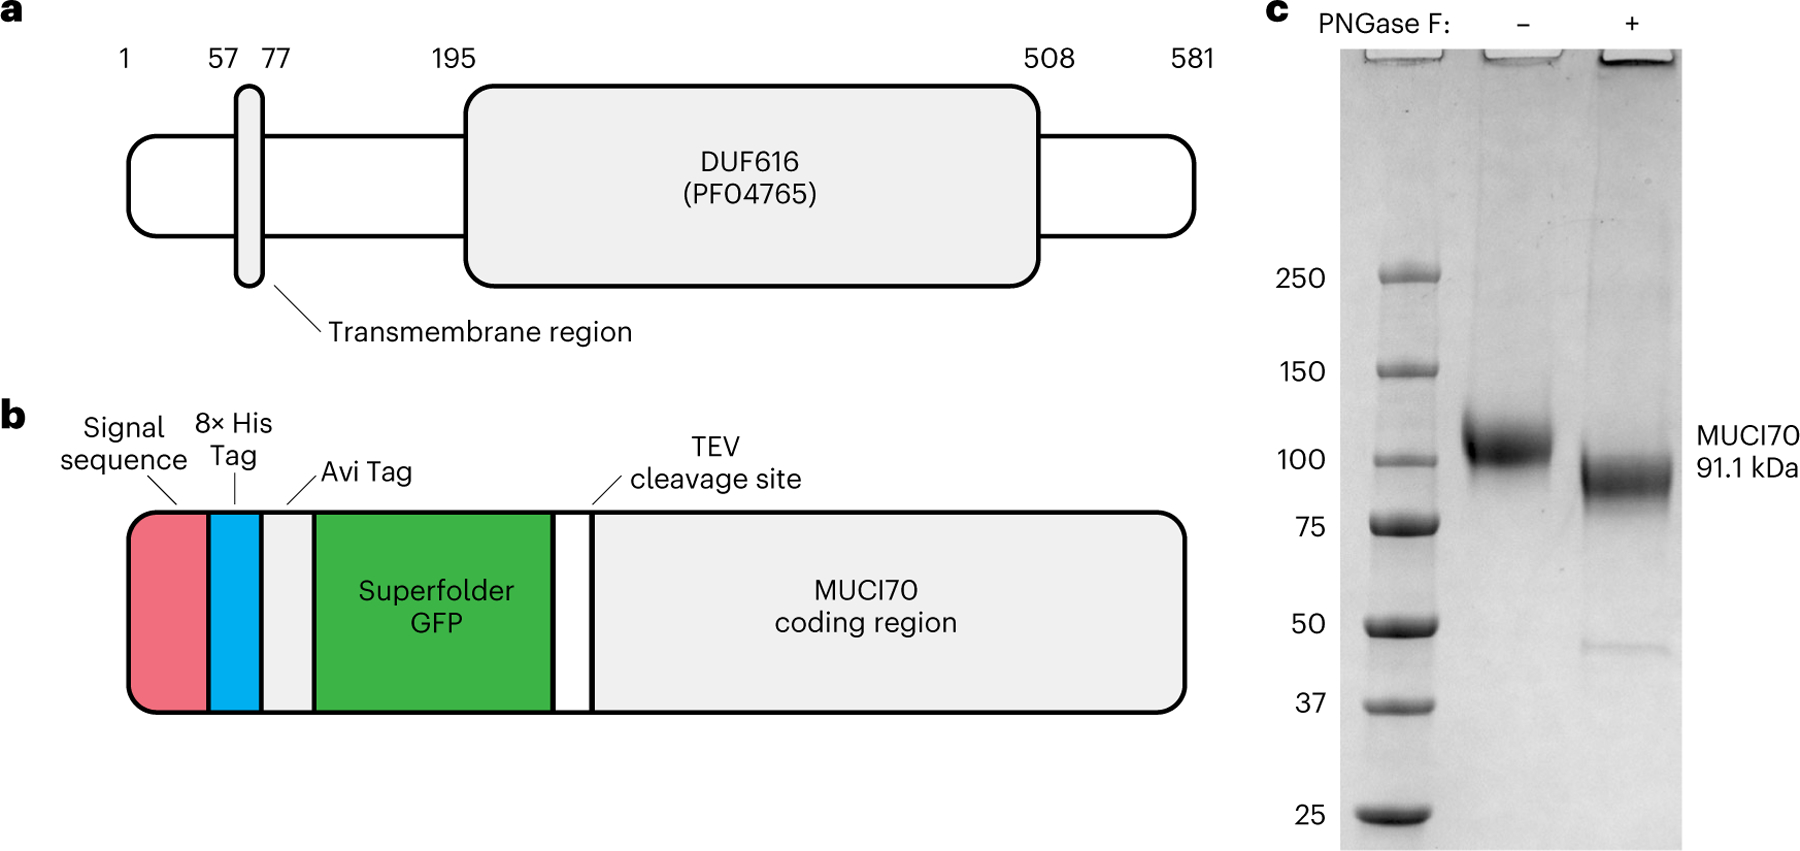
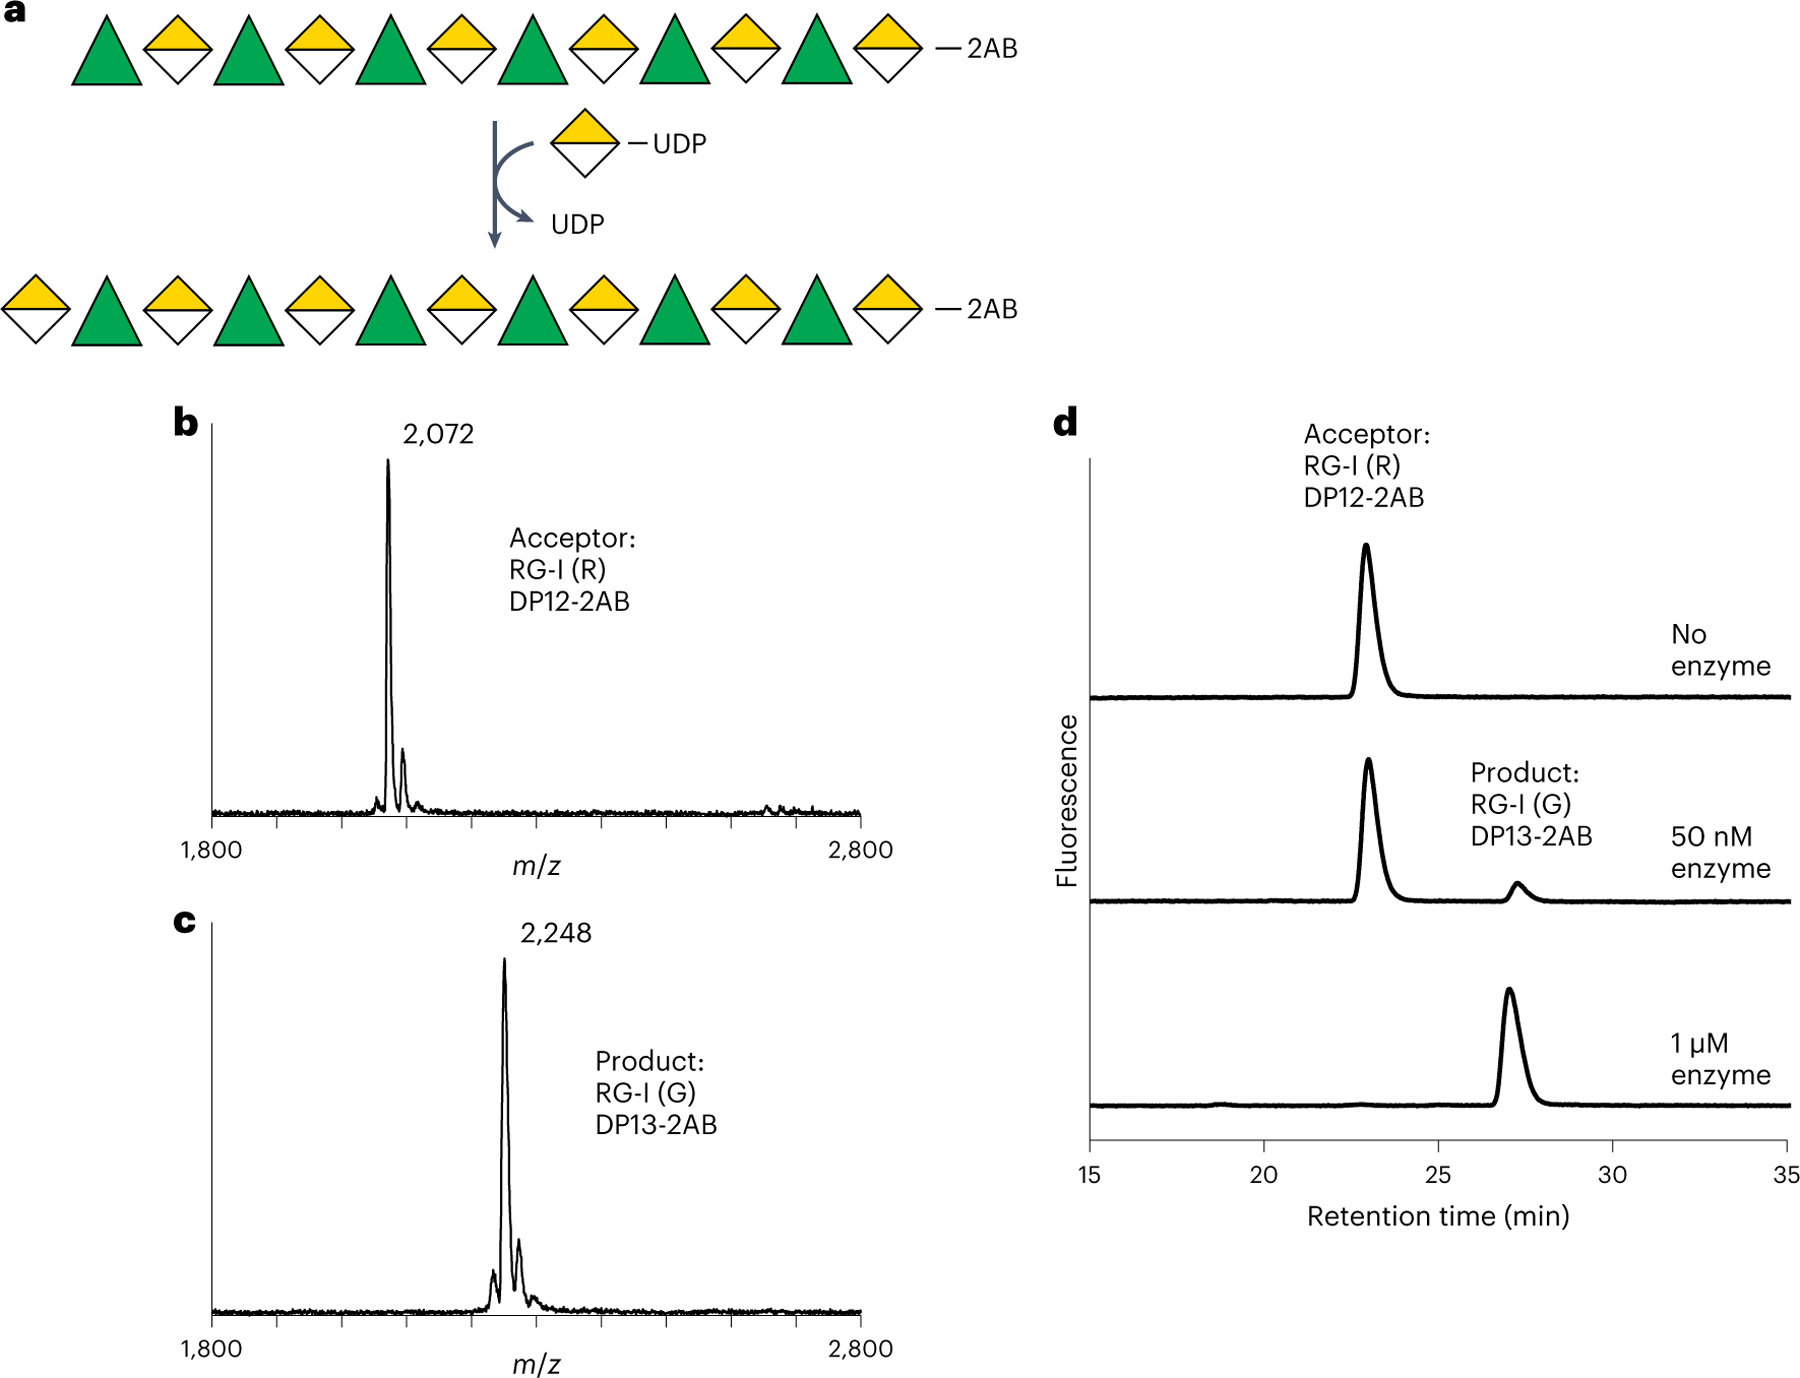
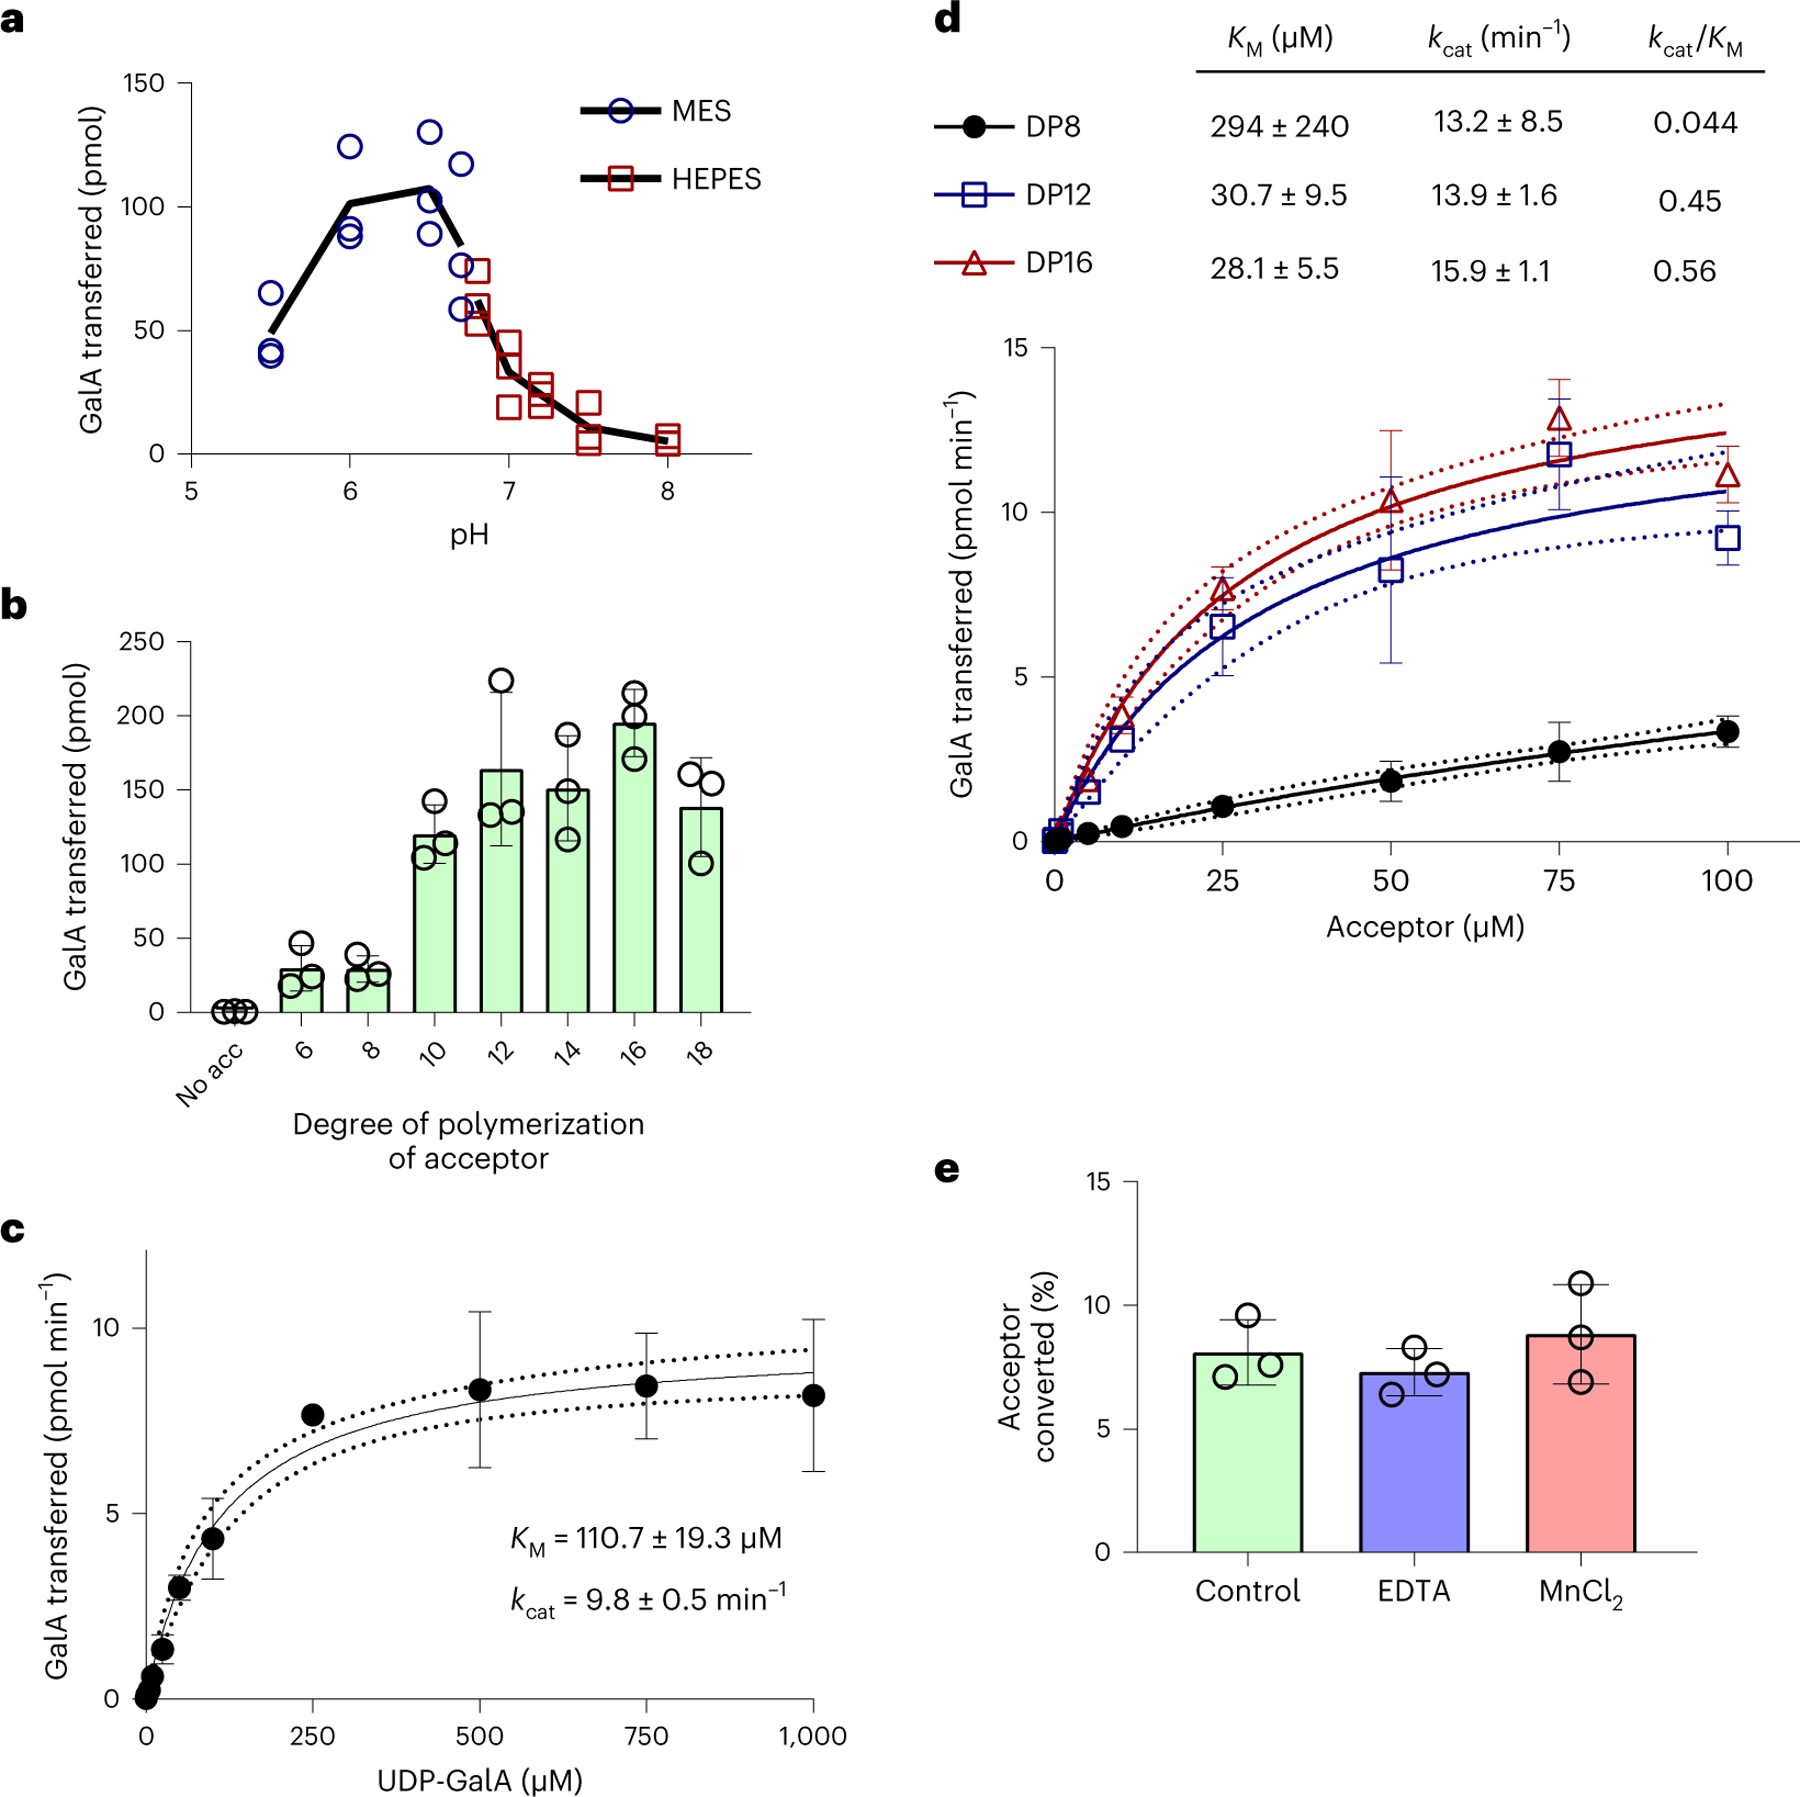
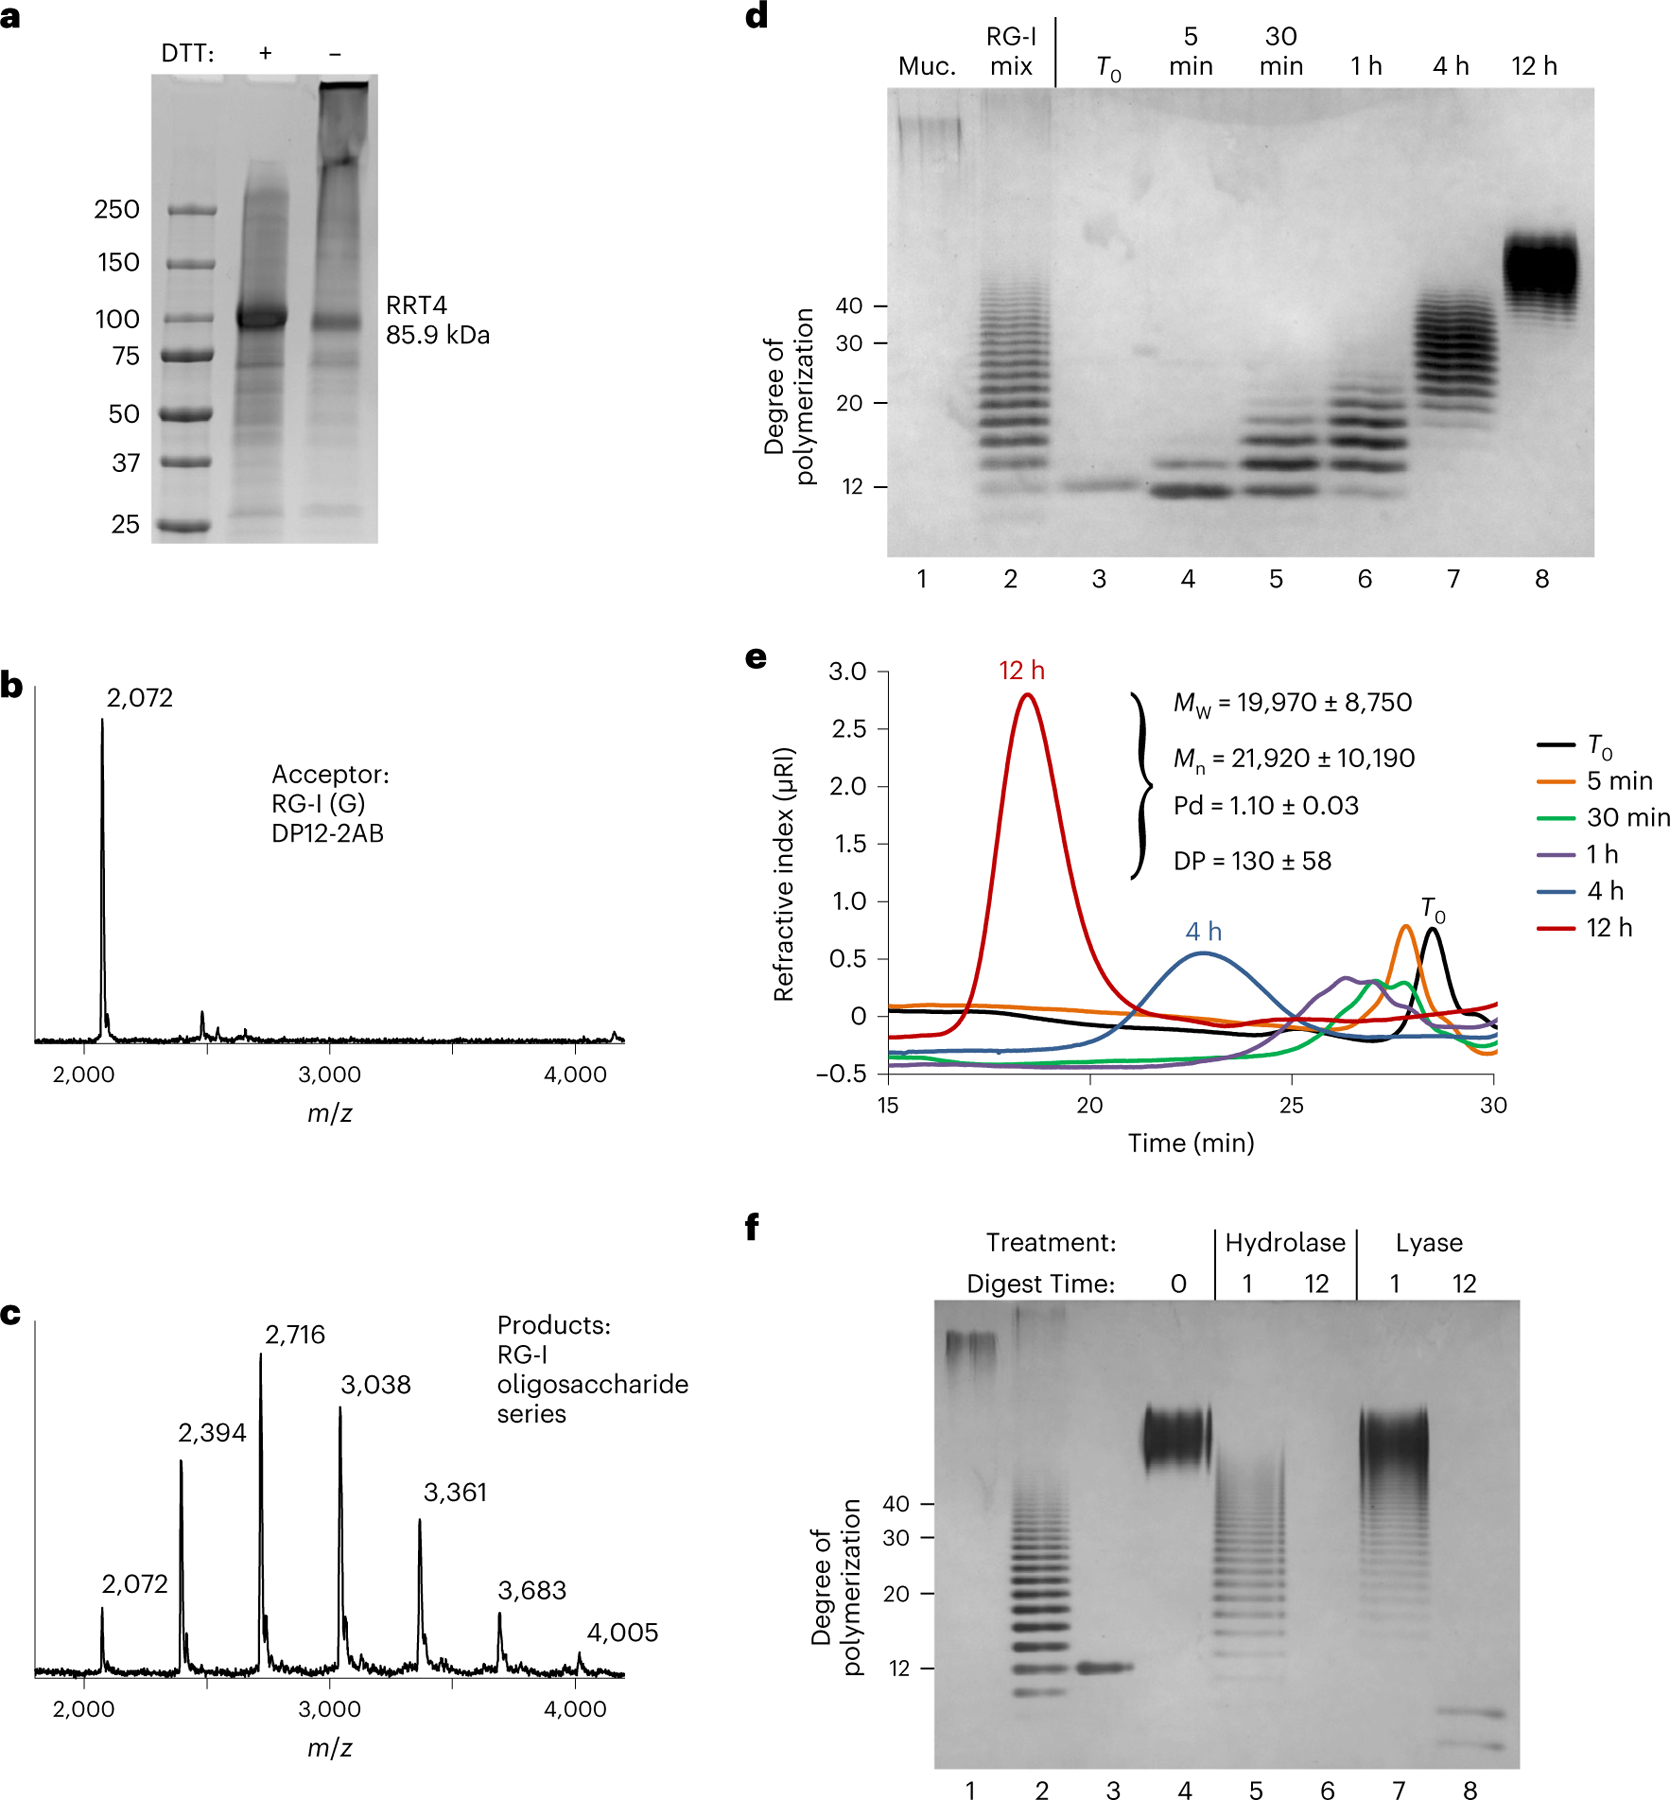
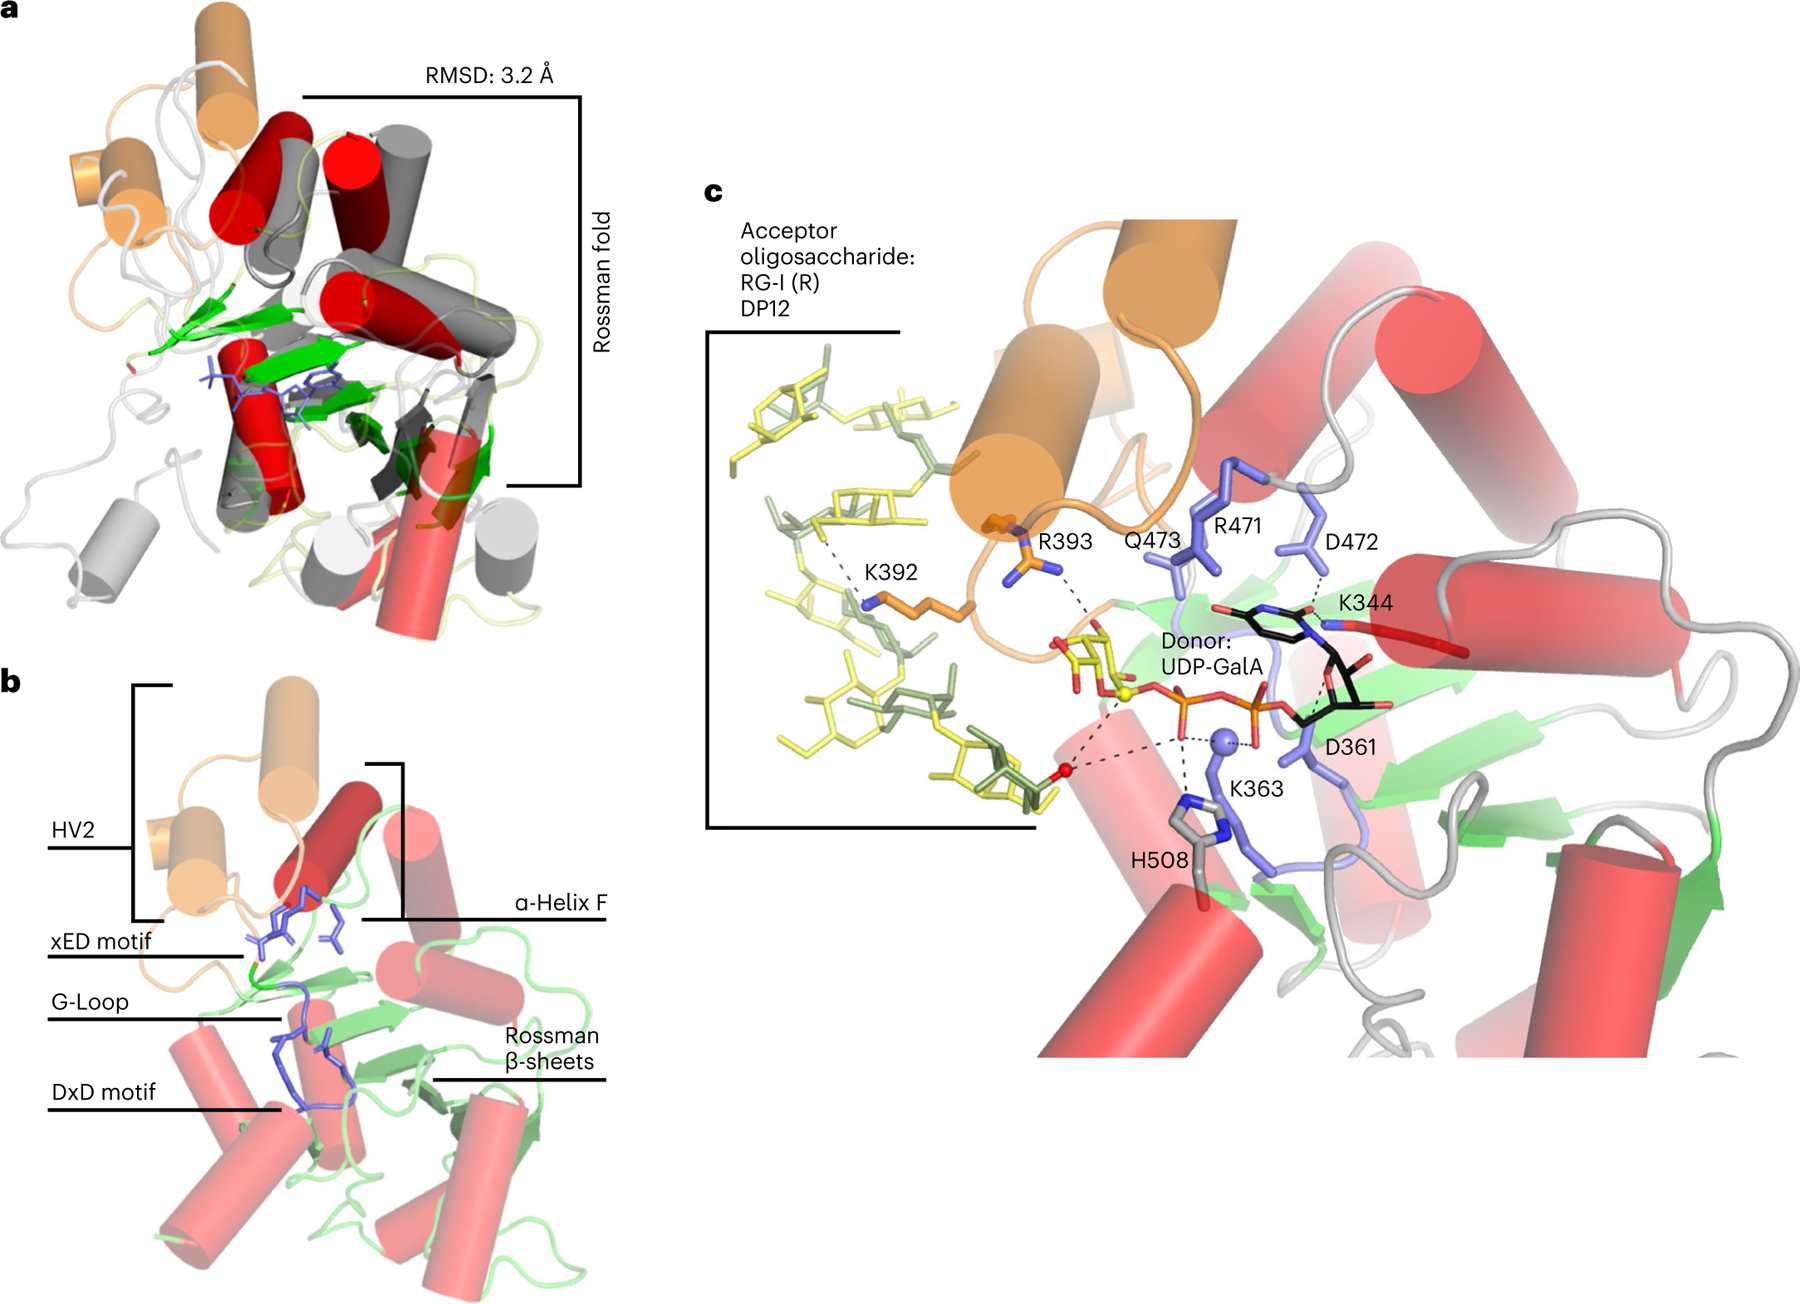
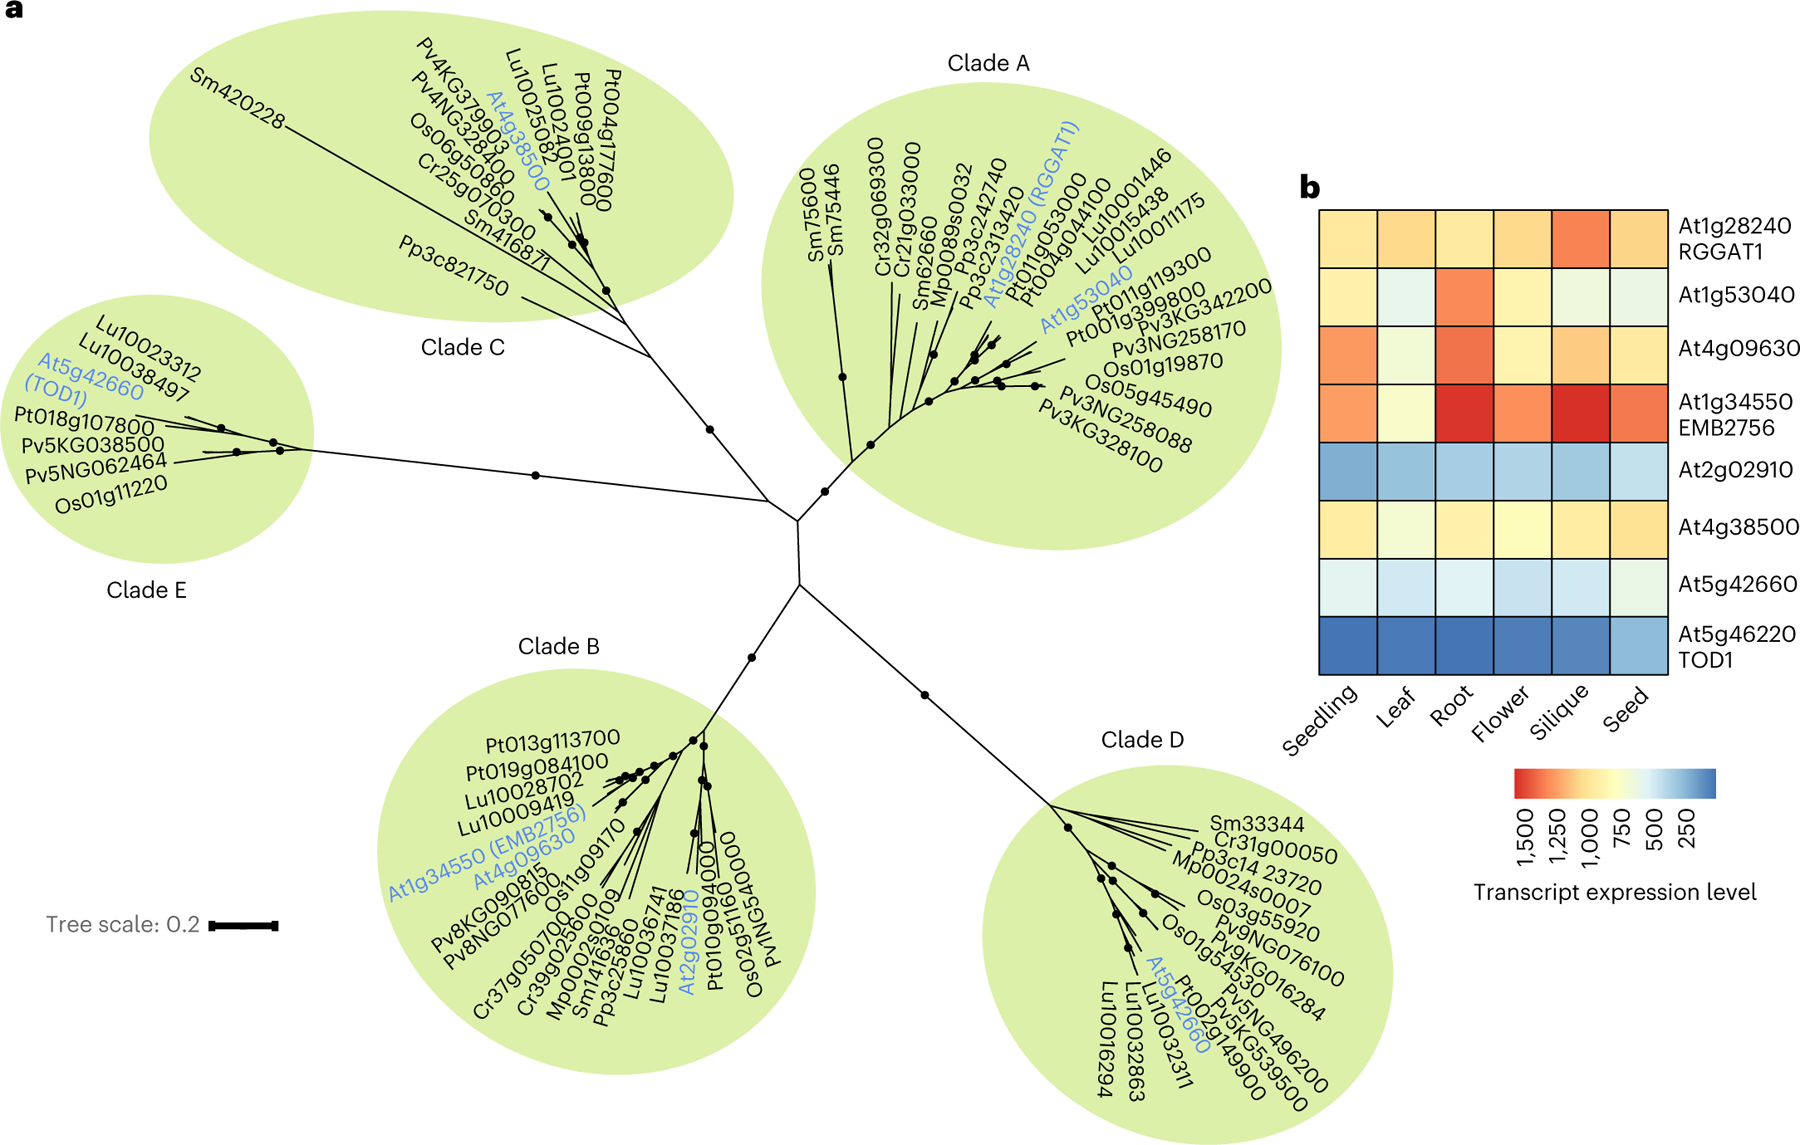
Rhamnogalacturonan I (RG-I) is a major plant cell wall pectic polysaccharide defined by its repeating disaccharide backbone structure of [4)-α-D-GalA-(1,2)-α-L-Rha-(1,]. A family of RG-I:Rhamnosyltransferases (RRT) has previously been identified, but synthesis of the RG-I backbone has not been demonstrated in vitro because the identity of Rhamnogalacturonan I:Galaturonosyltransferase (RG-I:GalAT) was unknown. Here a putative glycosyltransferase, At1g28240/MUCI70, is shown to be an RG-I:GalAT. The name RGGAT1 is proposed to reflect the catalytic activity of this enzyme. When incubated together with the rhamnosyltransferase RRT4, the combined activities of RGGAT1 and RRT4 result in elongation of RG-I acceptors in vitro into a polymeric product. RGGAT1 is a member of a new GT family categorized as GT116, which does not group into existing GT-A clades and is phylogenetically distinct from the GALACTURONOSYLTRANSFERASE (GAUT) family of GalA transferases that synthesize the backbone of the pectin homogalacturonan. RGGAT1 has a predicted GT-A fold structure but employs a metal-independent catalytic mechanism that is rare among glycosyltransferases with this fold type. The identification of RGGAT1 and the 8-member Arabidopsis GT116 family provides a new avenue for studying the mechanism of RG-I synthesis and the function of RG-I in plants.


Conflict of interest statement

Competing interests

The authors declare no competing interests.

Figures

Extended Data Fig. 1 |
Extended Data Fig. 1 |. Expression of MUCI70Δ77 in HEK293 cells.
MUCI70Δ77 was expressed in a total of two small-scale (20 mL) and one large-scale (250 mL) cultures. Total protein is the measure of fluorescence of total GFP fluorescence from cells + culture medium. Secreted protein is the measure of fluorescence of cell-free medium. All samples were taken from a 100 µL aliquot from the cell culture after 6 days. MUCI70Δ77 was expressed with 93% secretion efficiency, defined as the proportion of secreted protein to the total protein fluorescence. Error bars represent the standard deviation from three biological replicates.
Extended Data Fig. 2 |
Extended Data Fig. 2 |. Digest of RG-I mucilage and purification of RG-I acceptor oligosaccharides.
a, Arabidopsis mucilage was digested for the indicated times with RG-I hydrolase and by acid hydrolysis. Digests were carried out using 10 mg of mucilage and 0.1 µg RG-I hydrolase from Aspergillus aculeatus at 40 °C or 0.1 M HCl at 80 °C for the indicated times. b, RG-I oligosaccharides from digested mucilage were injected into a CarboPac PA-1 semi-preparative (22×250 mm) column following labeling with 2AB. Fractions were collected as individual peaks containing RG-I oligosaccharides of the indicated degree of polymerization (indicated above peak). Peaks were eluted in a gradient ranging from 50–1000 mM ammonium formate indicated by the green line.
Extended Data Fig. 3 |
Extended Data Fig. 3 |. RGGAT1 does not transfer GalA to RG-I acceptors containing GalA on the non-reducing end or to HG acceptors.
a. Hypothetical transfer of GalA to the non-reducing end GalA of an RG-I acceptor, resulting in RG-I oligosaccharides containing at least two contiguous GalA residues on the non-reducing end. Such an enzyme should exist in plants since HG:RG-I heteroglycans are known to be present in plant cell walls. The reaction depicted represents the elongation of homogalacturonan onto an RG-I acceptor. b. RGGAT1 does not catalyze the transfer of GalA to the RG-I (G) acceptor. RGGAT1 (1 mM) was incubated with UDP-GalA and an RG-I (G) acceptor for 1 hour. Longer incubation times did not result in any detectable activity. c. Hypothetical transfer of GalA to the non-reducing end of an HG acceptor, resulting in elongation of the HG backbone by at least one GalA monosaccharide. d. RGGAT1 does not catalyze the transfer of GalA to the HG acceptor. RGGAT1 (1 mM) was incubated with UDP-GalA and an HG acceptor for 1 hour. Longer incubation times did not result in any detectable activity.
Extended Data Fig. 4 |
Extended Data Fig. 4 |. Biochemical characterization of RGGAT1 activity.
a, Comparison of RGGAT1 activity using two independent methods. For anion exchange, percentage of acceptor converted was calculated based on the relative proportion of the peaks for the DP12 (R) acceptor and DP13 (G) in the fluorescence chromatogram. For UDP-Glo, activity was measured as a function of UDP released in a 10 min assay containing 1 mM UDP-GalA and 100 µM acceptor. This activity value was presented as “percentage of acceptor converted” based on the conversion that 1 µM UDP released is equal to conversion of 1% of the starting DP12 (R) acceptor to a DP13 (G) product. Reactions contained 50 nM enzyme. Error bars represent the standard deviation from three independent experiments. b, Progress curve of activity using UDP-Glo. In all assays, each point represents the average of duplicate luminescence readings. The blue (assay with 1 mM UDP-GalA) and red (assay with 100 µM UDP-GalA) lines represent the average activity from three independent assays containing 50 nM enzyme. The results from independent assays are shown as individual points. c, Percentage of acceptor conversion was enhanced by addition of a phosphatase (potato apyrase, Sigma A6132) to the reaction. Percentage of acceptor converted was measured as the relative proportion of the peak area of the product to the remaining acceptor at 60 minutes in a reaction containing 50 nM enzyme, 1 mM UDP-GalA, and 100 µM DP12-2AB (R) acceptor. Error bars represent the standard deviation from three independent experiments.
Extended Data Fig. 5 |
Extended Data Fig. 5 |. Expression of RRT1, RRT2, RRT3, RRT4, and co-expression of RRT1:RRT2.
Four proteins from the RRT family were expressed in HEK293 cells. A co-expression experiment in which RRT1 and RRT2 were co-transfected into the cells was also performed. Total protein is the measure of fluorescence in the cells + culture medium. Secreted protein is the measure of fluorescence in cell-free medium. Of the four RRT-family proteins expressed in this system, RRT4Δ51 yielded the highest total protein. RRT4 protein expressed with 50% secretion efficiency. Error bars represent the standard deviation of two biological replicates. Co-expression of RRT1Δ61 with RRT2Δ62 did not result in increased expression, suggesting that these two proteins do not form a heterocomplex in vitro.
Extended Data Fig. 6 |
Extended Data Fig. 6 |. The purified RRT4 protein has RG-I:RhaT activity.
The purified RRT4 enzyme was incubated with 1 mM UDP-Rha and an RG-I (G) acceptor, DP12. Activity was tested at pH 6.5 and 7.0 with either 1 µM or 5 µM enzyme. The reaction progress was detected by MALDI-MS at the indicated time points. Activity at pH 6.5 was higher based on the relative conversion of the acceptor (2072 Da) to the RhaT product (2218 Da).
Extended Data Fig. 7 |
Extended Data Fig. 7 |. Individual RGGAT1 and RRT4 enzymes do not polymerize RG-I.
RGGAT1 enzyme (1 µM) was incubated with 100 µM RG-I (R) acceptor and 1 mM of UDP-GalA, UDP-Rha, or a combination of UDP-GalA and UDP-Rha. The activity was limited to addition of a single GalA residue with no additional products detected when UDP-Rha was included in the reaction. RRT4 enzyme (1 µM) was incubated with 100 µM RG-I (G) acceptor and 1 mM of UDP-GalA, UDP-Rha, or a combination of UDP-GalA and UDP-Rha. The activity was limited to addition of a single Rha residue with no additional products detected when UDP-GalA was included in the reaction.
Extended Data Fig. 8 |
Extended Data Fig. 8 |. Coexpression of RGGAT1 with RRT family members does not improve RRT expression.
RGGAT1 (91.1 kDa) was expressed alone (lane 2) or coexpressed with RRT1 (81.3 kDa), RRT2 (86.4 kDa), RRT3 (86.7 kDa), or RRT4 (85.9 kDa) in HEK293 cells (lanes 3–6). The proteins were purified by Ni2+-NTA affinity from the cell culture medium. Protein concentration was measured by fluorescence. Proteins were loaded into an SDS-PAGE gel based on an equal amount of fluorescence corresponding to an estimated 1 µg total protein. All samples were separated under reducing conditions (+DTT) to observe the presence of monomers. Proteins were compared to previously-purified controls (Lanes 8–10). Lane 10, containing both RGGAT1 and RRT4 protein, was used as a control to demonstrate that the RGGAT1 and RRT4 monomers can be distinguished when an equal amount of both proteins was present. Although some RRT protein may be present in each co-expression lane, the results indicate that they were poorly expressed compared to RGGAT1. The gel represents a single experiment of the coexpression of RGGAT1 with RRT family members.
Extended Data Fig. 9 |
Extended Data Fig. 9 |. DUF616 family sequences are predicted to be a GT-A fold type.
a, Reconstruction error (RE) values are calculated for DUF616 (n = 678) sequences and fall within 95% CI of the RE values for GT-A, B, C and lyso type folds suggesting that DUF616 belongs to one of the known folds. The reference RE values (blue line) were combined from the training set consisting of 39713 GT-A, GT-B, GT-C and GT-lyso sequences. b, RE values for the GT-A (n = 12,316), B (n = 20,397), C (n = 1,518), lyso (n = 5482) and DUF616 (n = 678) sequences are shown as boxplots. Dotted lines mark the 95th and the 99th percentile upper bounds. Boxes show the first and third quartiles. The line within the box indicates the median value. The whiskers mark 1.5 times the interquartile range, excluding the outliers shown as individual diamonds. c, Highest Fold Assignment Scores are found to be for the GT-A1 subcluster for the DUF616 sequences, suggesting that the sequences from this novel family adopt a GT-A type fold. d and e, The RE values against sub cluster GT-A1 and GT-B1 are plotted for DUF616 sequences. As seen, the RE values for GT-A1 are much closer to the true RE values, suggesting overall similarity in core structural fold.
Extended Data Fig. 10 |
Extended Data Fig. 10 |. The GT116 family contains eight putative members.
The GT116 domain was annotated as DUF616 (PF04765) in pfam. There are 12 Arabidopsis thaliana DUF616 sequences in pfam corresponding to 8 unique gene loci. The GT116 region is the envelope region containing the DUF616 domain predicted by pfam. The At1g28240/RGGAT1/MUCI70 sequence was entered as a query sequence in Protein BLAST. For the 7 additional GT116 sequences, aligned amino acid residues, query coverage, identity, and similarity are target sequence values obtained using At1g28240 as a query.
Fig. 1 |
Fig. 1 |. Representative chemical structure of rhamnogalacturonan I (RG-I) backbone.
RG-I is a polysaccharide with a [4)-α-d-GalA-(1,2)-α-l-Rha-(1,] disaccharide repeat backbone. The curved arrow represents the nucleophilic attack of an acceptor oligosaccharide with a non-reducing end Rha to the anomeric carbon of UDP-GalA. This putative transfer of a GalA monosaccharide to elongate the RG-I acceptor with retention of stereochemistry is referred to here as RG-I:GalAT activity. Chemical structure was created with ChemDraw Professional 16.0.
Fig. 2 |
Fig. 2 |. MUCI70 protein domain structure, expression construct and purified protein.
a, Representation of the conserved domains within the 581 amino acid coding region of At1g28240 (MUCI70). The region from amino acid 57 to 77 is a putative transmembrane domain that was truncated to create the expression construct. Residues 195–508 are the putative GT domain. b, Expression construct pGEn2 containing the truncated coding region (residues 78–581) of MUCI70. The fusion protein has N-terminal tags that include a signal sequence for secretion, 8× His Tag, Avi Tag, ‘superfolder’ GFP and a site for tag removal by Tobacco Etch Virus (TEV) protease. c, Coomassie blue-stained SDS–polyacrylamide gel of the MUCI70 fusion protein. Expression of the fusion protein in HEK293 cells resulted in secretion of the protein into the cell culture medium. The protein was purified by Ni2+-NTA affinity (HisTrap HP) and size-exclusion chromatography (Superdex 200), resulting in a protein that resolves near the expected molecular weight of the fusion protein (91.1 kDa) after removal of N-linked glycosylation by PNGase F. Similar results were obtained from two independent purifications of MUCI70. The gel shown is representative of two independent digest experiments.
Fig. 3 |
Fig. 3 |. Recombinant RGGAT1 is an RG-I:Galacturonosyltransferase.
a, Reaction scheme representing RG-I:GalAT activity using the Symbol Nomenclature for Glycans. Rha, green triangles. GalA, yellow divided diamond. The oligosaccharide acceptor contains 2AB at the reducing end. Transfer of GalA from UDP-GalA results in conversion of an RG-I (R) DP12-2AB acceptor to an RG-I (G) DP13-2AB product. The abbreviation RG-I (R) signifies RG-I oligosaccharides obtained from digestion of RG-I with RGase A resulting in a non-reducing terminal rhamnose, while RG-I (G) represents an RG-I oligosaccharide with a GalA at the non-reducing terminus, in this case resulting from the catalytic activity of RGGAT1 on RG-I (R). b, MALDI-TOF-MS spectrum of the DP12-2AB oligosaccharide acceptor of predicted mass 2,071.8 Da. c, MALDI-TOF-MS spectrum of the product after GalA transfer. The mass increase of 176 Da is consistent with the addition of a single GalA unit to the acceptor oligosaccharide shown in b. d, The product of RGGAT1 activity was detected by anion exchange chromatography with fluorescence detection. RGGAT1 enzyme (50 nM or 1 µM) was incubated with 1 mM UDP-GalA and 100 µM RG-I (R) DP12-2AB acceptor for 10 min. The reaction was boiled, and an aliquot representing 2.5 nmol of the starting acceptor was separated using a CarboPac PA-1 anion exchange column. The starting acceptor is represented by the peak with a retention time of 22 min. The top panel is a control reaction with no enzyme. In the middle panel, use of 50 nM enzyme resulted in approximately 10% of the acceptor converted into the product based on the peak areas. In the bottom panel, a reaction containing 1 µM enzyme resulted in 100% conversion of the acceptor into the product. The assay is representative of at least three independent replicates. Quantitation of the peak area of the reaction containing 50 nM enzyme is shown in Extended Data Fig. 4a.
Fig. 4 |
Fig. 4 |. Biochemical characterization of RG-I:GalAT activity by RGGAT1.
a, The pH optimum of RGGAT1 activity was measured using UDP-Glo in 10 min reactions containing 50 nM enzyme, 1 mM UDP-GalA and 100 µM of a DP12-2AB acceptor. Reactions were incubated with 50 mM of MES buffer (blue circles) of pH 5.5–6.7 or HEPES buffer (red squares) of pH 6.7–8.0. The buffer MES pH 6.5 was used for standard condition assays. The black line represents the average value of n = 3 independent assays. Individual data points from the three assays are shown. b, RGGAT1 activity was measured in 10 min reactions containing 50 nM enzyme, 1 mM UDP-GalA and 100 µM of acceptors with degrees of polymerization ranging from DP6 to DP18 or no acceptor (no acc) using UDP-Glo. Error bars represent standard deviations of n = 3 independent experiments. c, Michaelis-Menten kinetics for the UDP-GalA donor. RGGAT1 was incubated for 10 min with 100 µM DP16 acceptor and variable concentrations of UDP-GalA (0–1,000 µM). Kinetic constants were calculated by nonlinear regression using GraphPad Prism. Error bars represent standard deviations from n = 4 independent experiments. Dotted lines represent 95% confidence intervals. KM and kcat are reported as mean ± s.e.m. d, Michaelis-Menten kinetics for RG-I oligosaccharide acceptors of DP8, DP12 and DP16. RGGAT1 was incubated for 10 min with 1 mM UDP-GalA and variable concentrations of the indicated acceptors (0–100 µM). Kinetic constants were calculated by nonlinear regression using GraphPad Prism. Error bars represent standard deviations of n = 3 independent experiments. Dotted lines represent 95% confidence intervals. KM and kcat are reported as mean ± s.e.m. e, RGGAT1 was incubated in a 50 mM MES pH 6.5 buffer (control) or with buffer containing either 10 mM EDTA or 10 mM MnCl2 for 30 min before the assay. After a 30 min incubation period, the enzyme was diluted and assayed as described. The final concentration during the reaction was 10 mM for EDTA and 0.25 mM for MnCl2. No difference in activity compared to the control reaction was detected. Error bars represent standard deviations of n = 3 independent experiments.
Fig. 5 |
Fig. 5 |. The combined activities of RGGAT1 and RRT4 polymerize the RG-I backbone.
a, Coomassie blue-stained SDS–polyacrylamide gel of the RRT4 fusion protein. The location of the RRT4 monomer with a predicted mass of 85.9 kDa is indicated. Similar results were obtained from three independent purifications of RRT4. The gel shown is a single experiment from the purified protein used in all assays. b, MALDI-TOF-MS spectrum of a control reaction containing a DP12-2AB oligosaccharide acceptor of predicted mass 2,071.8 Da. The acceptor is labelled as RG-I (G) to identify that it contains GalA on the non-reducing end. c, MALDI-TOF-MS spectrum of a reaction containing 5 µM of both RGGAT1 and RRT4 enzymes, 1 mM UDP-GalA, 1 mM UDP-Rha and 100 µM of the RG-I (G) acceptor detected in b. After 1 h incubation, a series of peaks separated by 322 Da is consistent with the addition of GalA-Rha disaccharide units added by the combined activities of GalAT and RhaT. d, In vitro polymerization of RG-I detected by alcian blue-stained polyacrylamide gel electrophoresis. A reaction containing 5 µM of both RGGAT1 and RRT4 enzymes, 1 mM UDP-GalA, 1 mM UDP-Rha and 10 µM of RG-I (R) DP12-2AB acceptor was incubated for the indicated amounts of time. Aliquots equivalent to 300 ng of starting acceptor were removed from the reaction at each time point and were boiled. Control samples are undigested mucilage (Muc., lane 1) and an RG-I oligosaccharide mixture enriched for DP10-40 (lane 2). Reaction samples (lanes 3–8) represent an equal amount of starting reaction material. The degree of polymerization of RG-I oligosaccharides is indicated. The data are representative of duplicate experiments. e, In vitro polymerization of RG-I detected by size-exclusion chromatography with refractive index detection. Reactions were incubated for the amount of time as in d. Aliquots equivalent to 5 µg of starting acceptor were removed from the reaction at individual times, boiled and injected into the column. Selected time points are labelled on the chromatogram. Characteristics of the polysaccharide product synthesized after 12 h measured by SEC-MALS are shown (MW, weight-averaged molecular mass; Mn, number-averaged molecular mass; Pd, polydispersity). Measured values represent the mean ± s.d. from n = 2 experiments. f, Digest of the in vitro polymerized material by RG-I hydrolase and RG-I lyase from Aspergillus aculeatus. In vitro polymerization of RG-I from a DP12-2AB starting acceptor (lane 3) was performed for 12 h (lane 4). The polymerized material was digested with RG-I hydrolase (lanes 5 and 6) or RG-I lyase (lanes 7 and 8) for 1 or 12 h, as indicated. Control lanes contained undigested mucilage (lane 1) and RG-I oligosaccharide mixture (lane 2) as in d. All lanes represent a reaction aliquot equivalent to 300 ng of starting DP12-2AB acceptor.
Fig. 6 |
Fig. 6 |. Predicted GT-A fold of RGGAT1.
a, Structural alignment of RGGAT1 AlphaFold2 structure (red and green) to a GT31 structure (grey) (pdb: 6wmo) at an RMSD of 3.2 Å across 155 residues, validating that the 3D structure matches a GT-A fold topology. The secondary structure matching algorithm in the molecular graphics programme Coot 0.9.7 was used to produce an alignment that was restricted to the core Rossman α-helices (red) and β-sheets (green) shown as opaque structures. b, The AlphaFold2 structure of RGGAT1 has elements of the canonical GT-A fold structure that includes β-sheets of the Rossman fold (green), α-Helix F (dark red) and three conserved motifs of the GT-A fold core (xED, G-Loop and DxD motifs, blue). Hypervariable region 2 (HV2, orange) has helices that are poorly aligned to the template. c, Docked structure of RGGAT1 with the donor UDP-GalA and acceptor RG-I (R) DP12 oligosaccharide. Selected amino acids predicted to interact with the donor and acceptor substrates are shown in stick representation. Dashed lines represent putative hydrogen bonding interactions within 2.7–3.4 Å distance. Residues in blue indicate putative GT-A motifs. Residues in orange are residues present on the HV2 region in contact with the acceptor. Based on a retaining mechanism, the acceptor nucleophile (red sphere) is deprotonated by the β-phosphate oxygen of the UDP donor, allowing a nucleophilic attack on the anomeric carbon of the GalA (yellow sphere). The side-chain amine of K363 (blue sphere) may function in place of a divalent cation to interact with the nucleotide phosphate diester of UDP-GalA.
Fig. 7 |
Fig. 7 |. Phylogenetic tree and tissue expression of GT116 family proteins.
a, Phylogenetic tree containing 77 GT116 sequences from 9 plant species. Arabidopsis gene names are in blue and organized into 5 clades. The clades (A, B, C, D and E) were ranked according to the primary amino acid sequences with the highest similarity to RGGAT1. Black circles indicate support for nodes with bootstrap values of greater than 90% from 500 bootstrap trials. Branch lengths indicate genetic divergence, with the scale bar indicating the average number of substitutions per amino acid. At, Arabidopsis thaliana; Cr, Ceratopteris richardii (fern); Lu, Linum usitatissimum (flax); Mp, Marchantia polymorphia (liverwort); Os, Oryza sativa (rice); Pv, Panicum virgatum (switchgrass); Pt, Populus trichocarpa (poplar); Pp, Physcomitrium patens (bryophyte); Sm, Selaginella moellendorffi (lycophyte). b, Heat map of RNA-seq data retrieved from TravaDB for each GT116 family member from 6 Arabidopsis tissues. Expression values are absolute read counts from selected tissues. For mature tissues in which data from several developmental stages were available (flowers, siliques, seeds), younger tissues that had not reached senescence were selected.

Similar articles

Cited by

References

    1. Atmodjo MA, Hao Z & Mohnen D Evolving views of pectin biosynthesis. Annu. Rev. Plant Biol 64, 747–779 (2013). - PubMed
    1. Biswal AK et al. Sugar release and growth of biofuel crops are improved by downregulation of pectin biosynthesis. Nat. Biotechnol 36, 249–257 (2018). - PubMed
    1. Wu D et al. Dietary pectic substances enhance gut health by its polycomponent: a review. Compr. Rev. Food Sci. Food Saf 20, 2015–2039 (2021). - PubMed
    1. Bonnin E, Garnier C & Ralet MC Pectin-modifying enzymes and pectin-derived materials: applications and impacts. Appl. Microbiol. Biotechnol 98, 519–532 (2014). - PubMed
    1. Atmodjo MA et al. Galacturonosyltransferase (GAUT)1 and GAUT7 are the core of a plant cell wall pectin biosynthetic homog alacturonan:galacturonosyltransferase complex. Proc. Natl Acad. Sci. USA 108, 20225–20230 (2011). - PMC - PubMed