. 2023 Apr;19(4):431-439.
doi: 10.1038/s41589-022-01182-5. Epub 2022 Nov 10.

Chemical inhibition of DPP9 sensitizes the CARD8 inflammasome in HIV-1-infected cells

Affiliations

Chemical inhibition of DPP9 sensitizes the CARD8 inflammasome in HIV-1-infected cells

Kolin M Clark et al. Nat Chem Biol. 2023 Apr.

Abstract

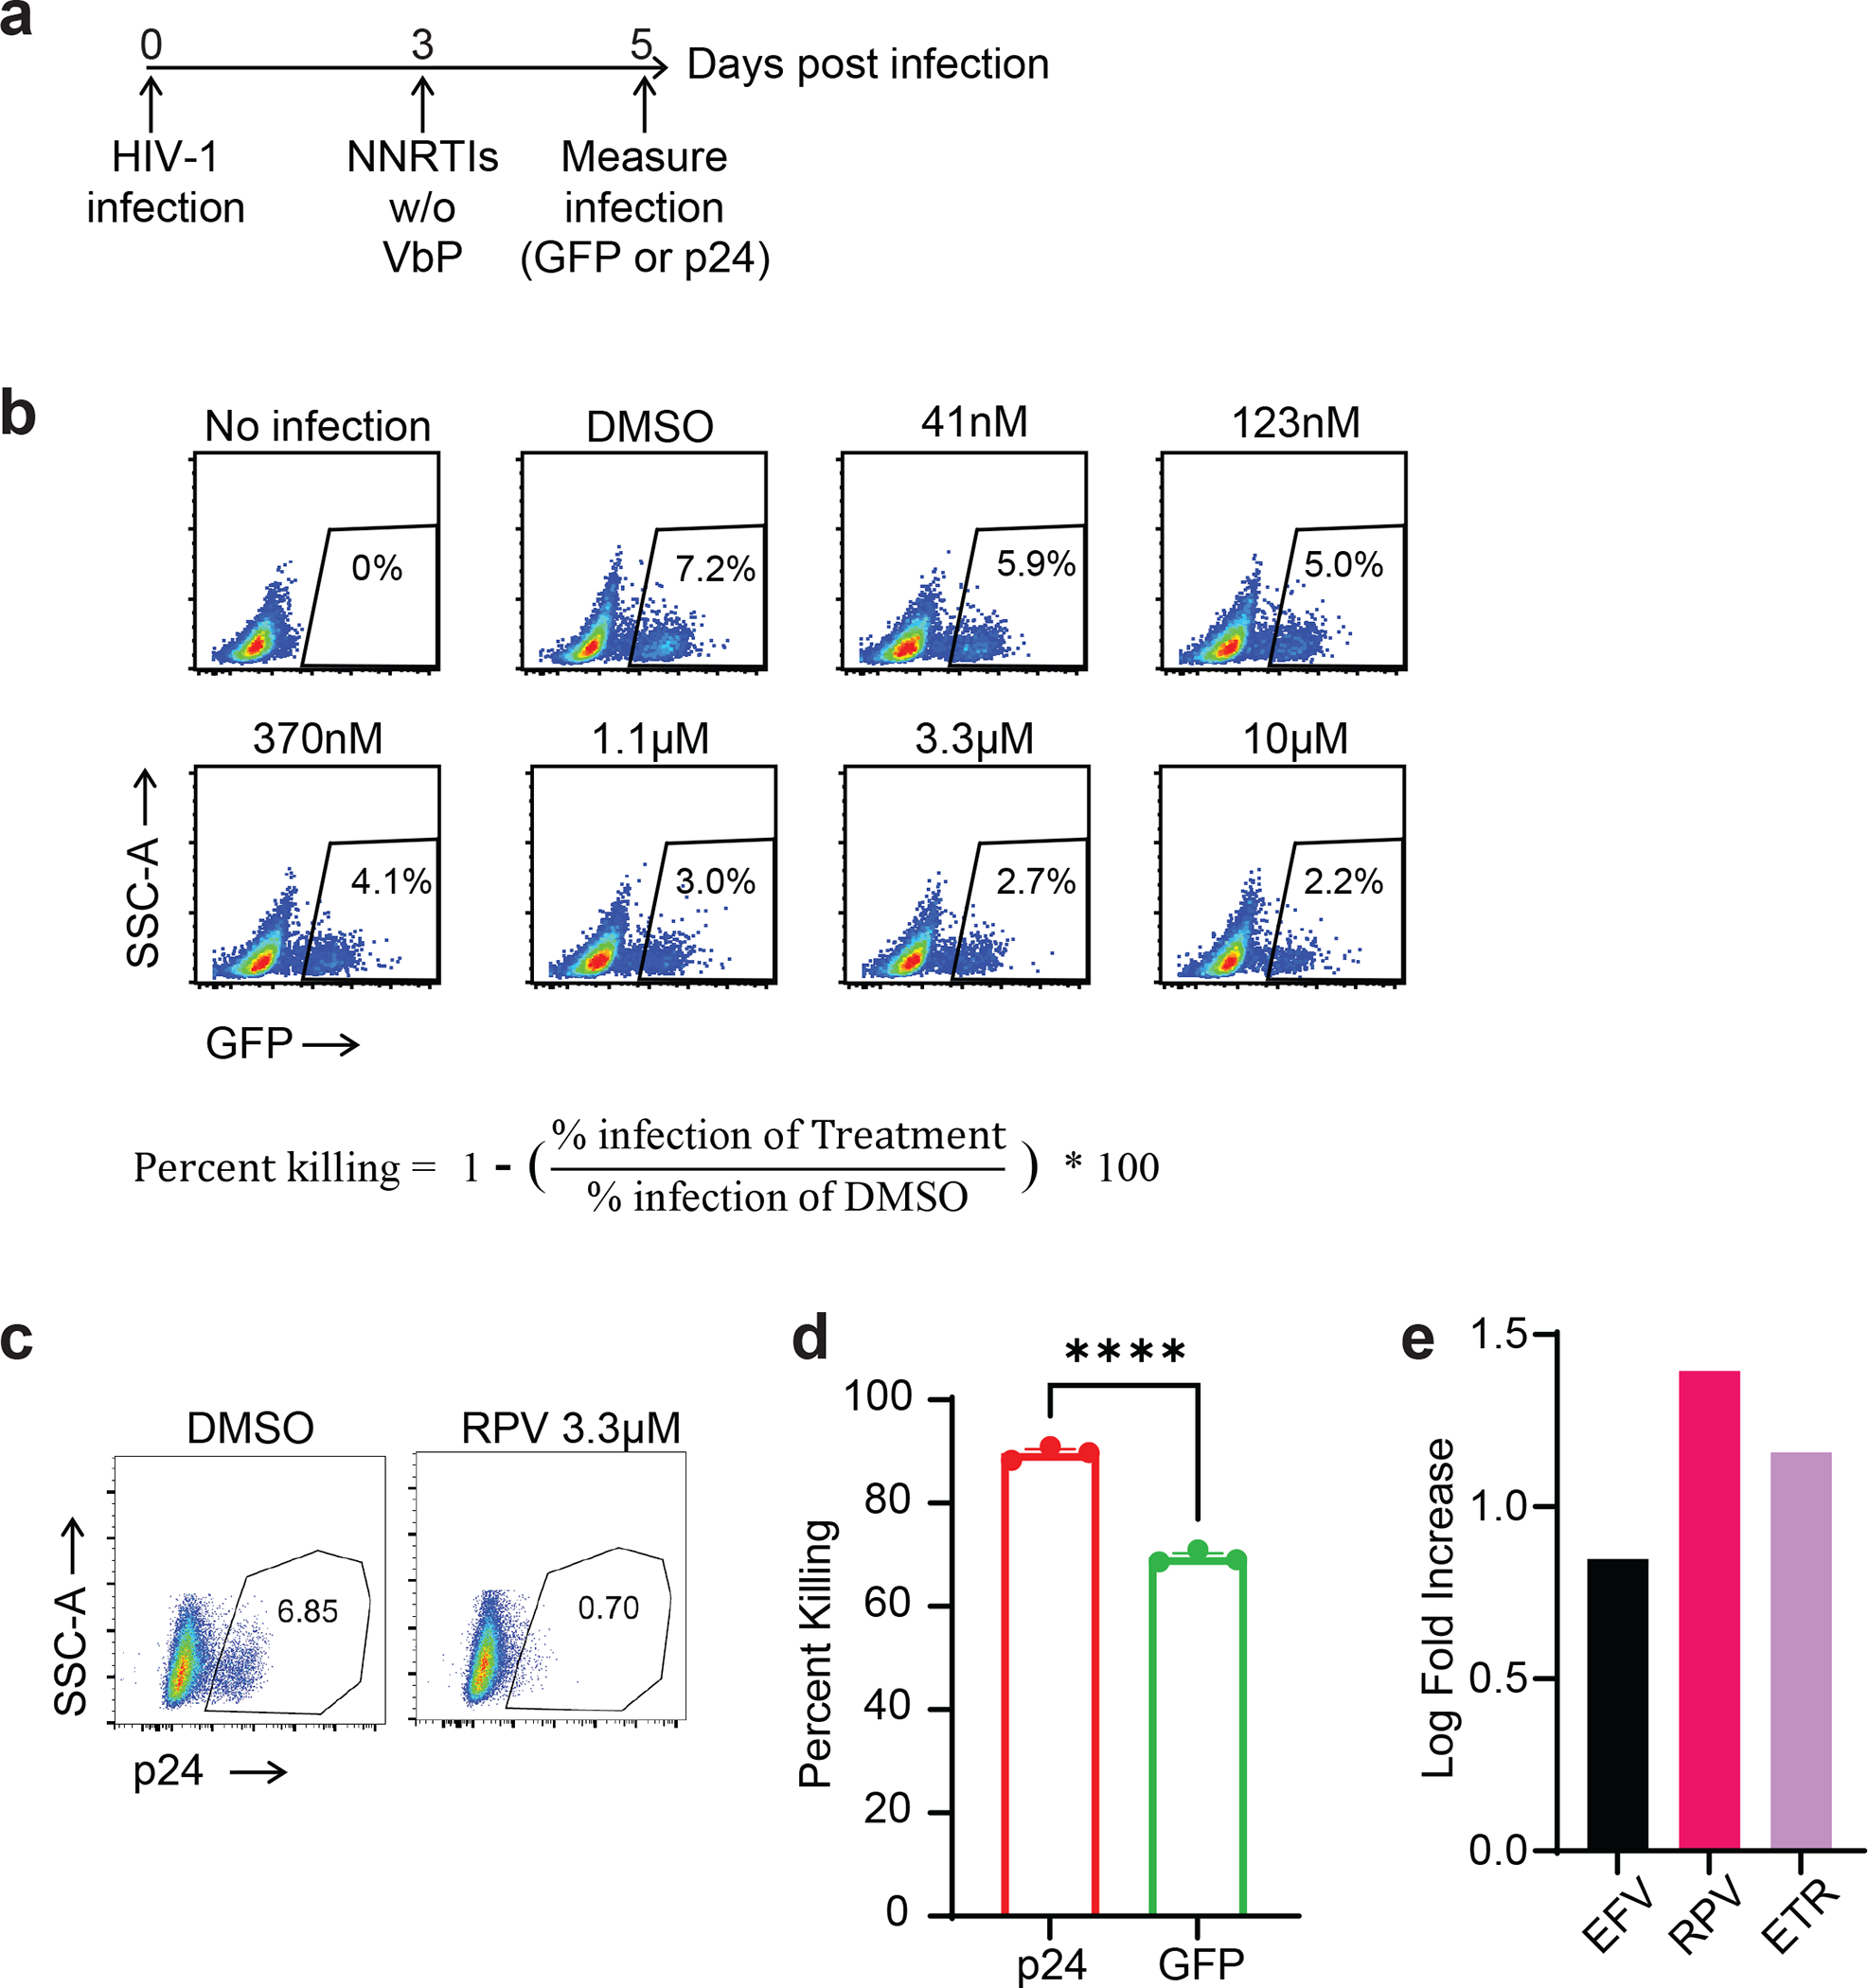
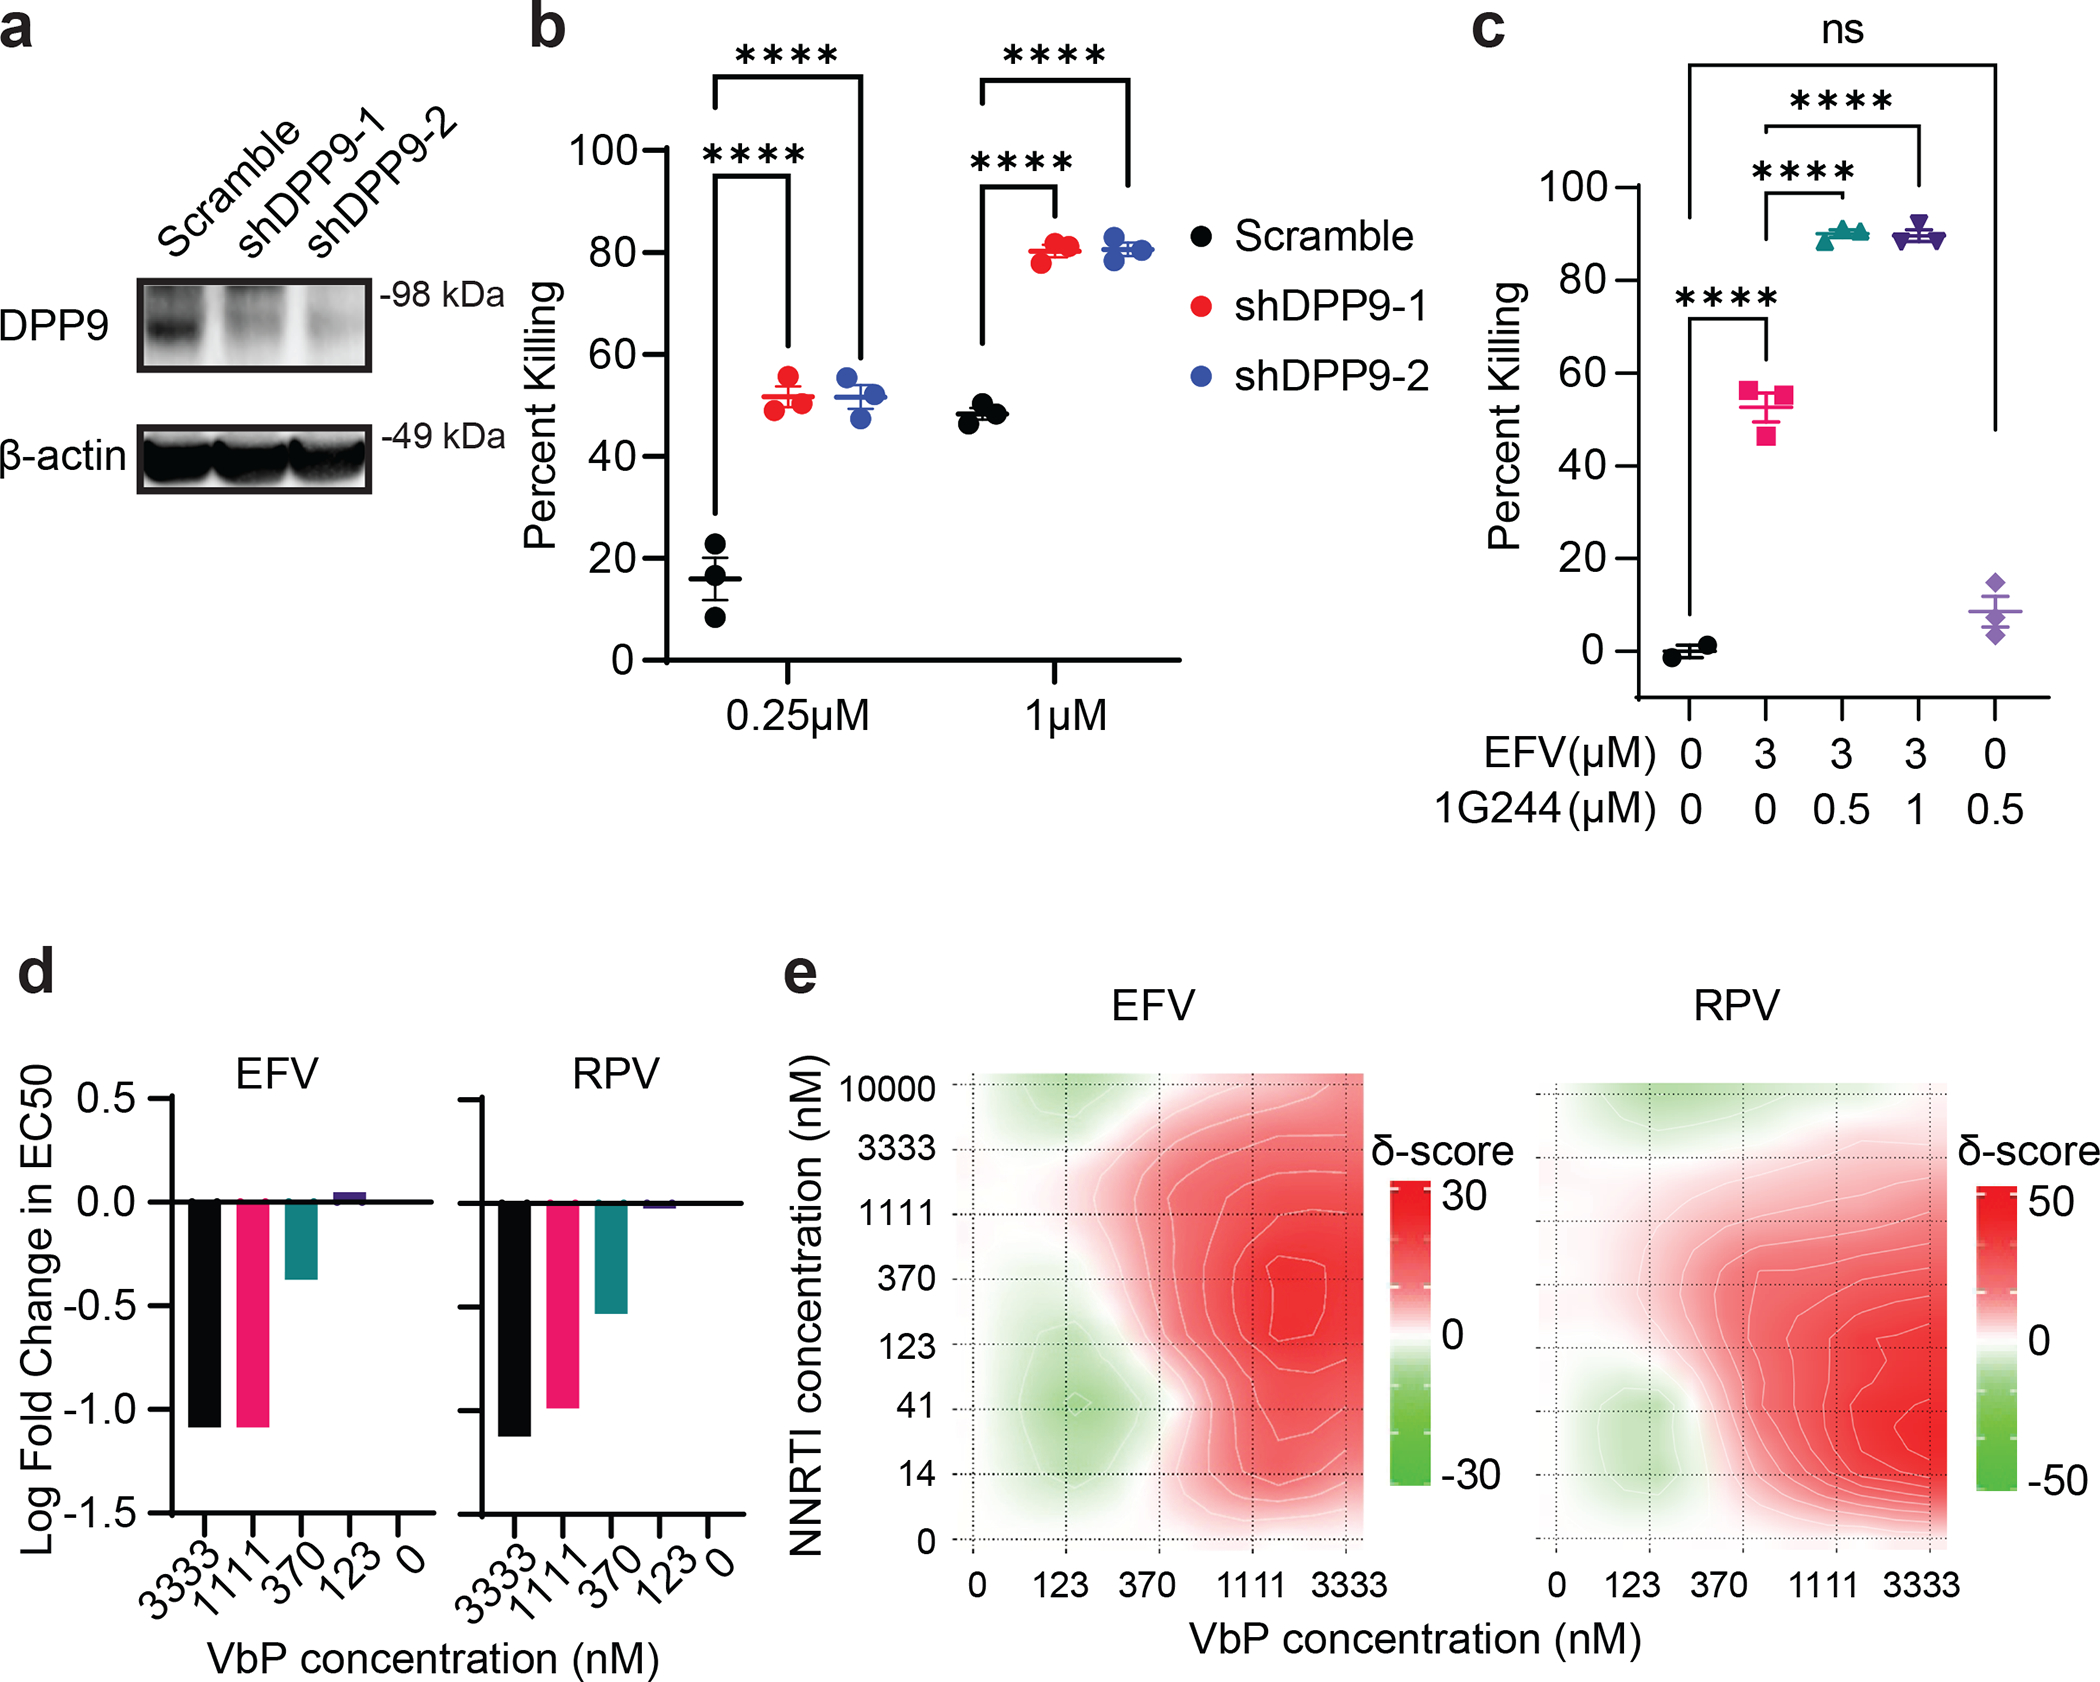
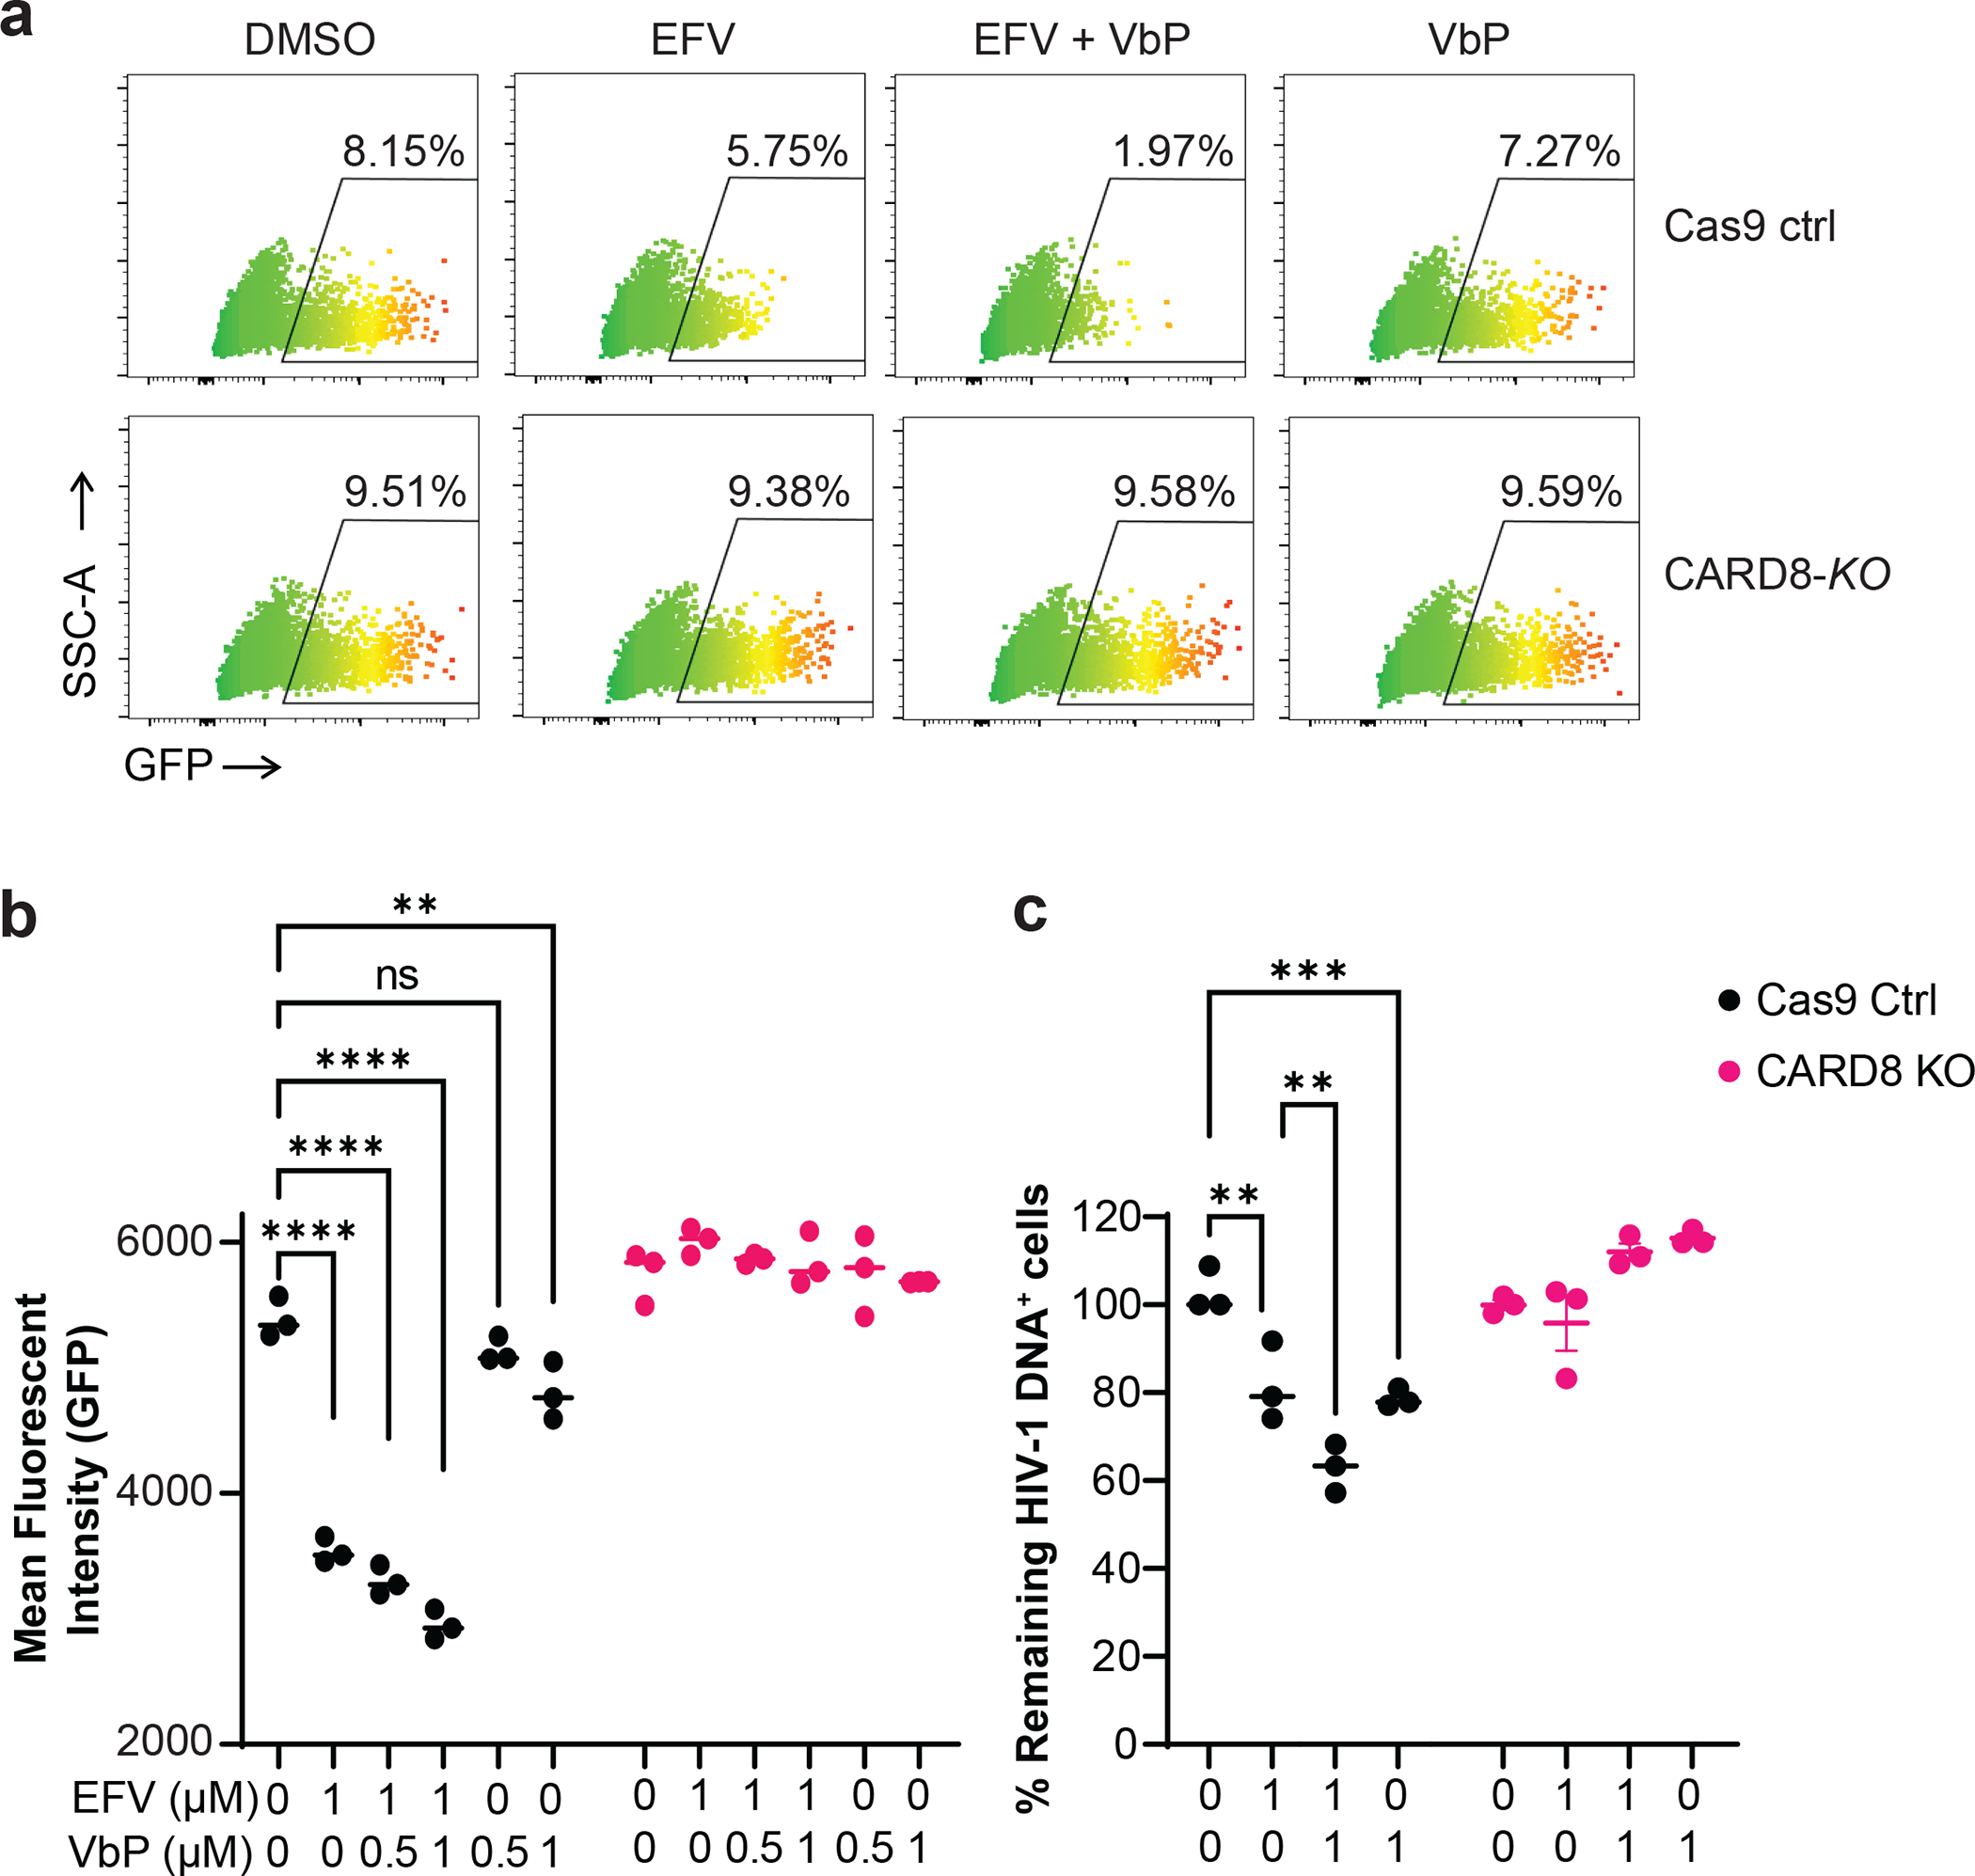
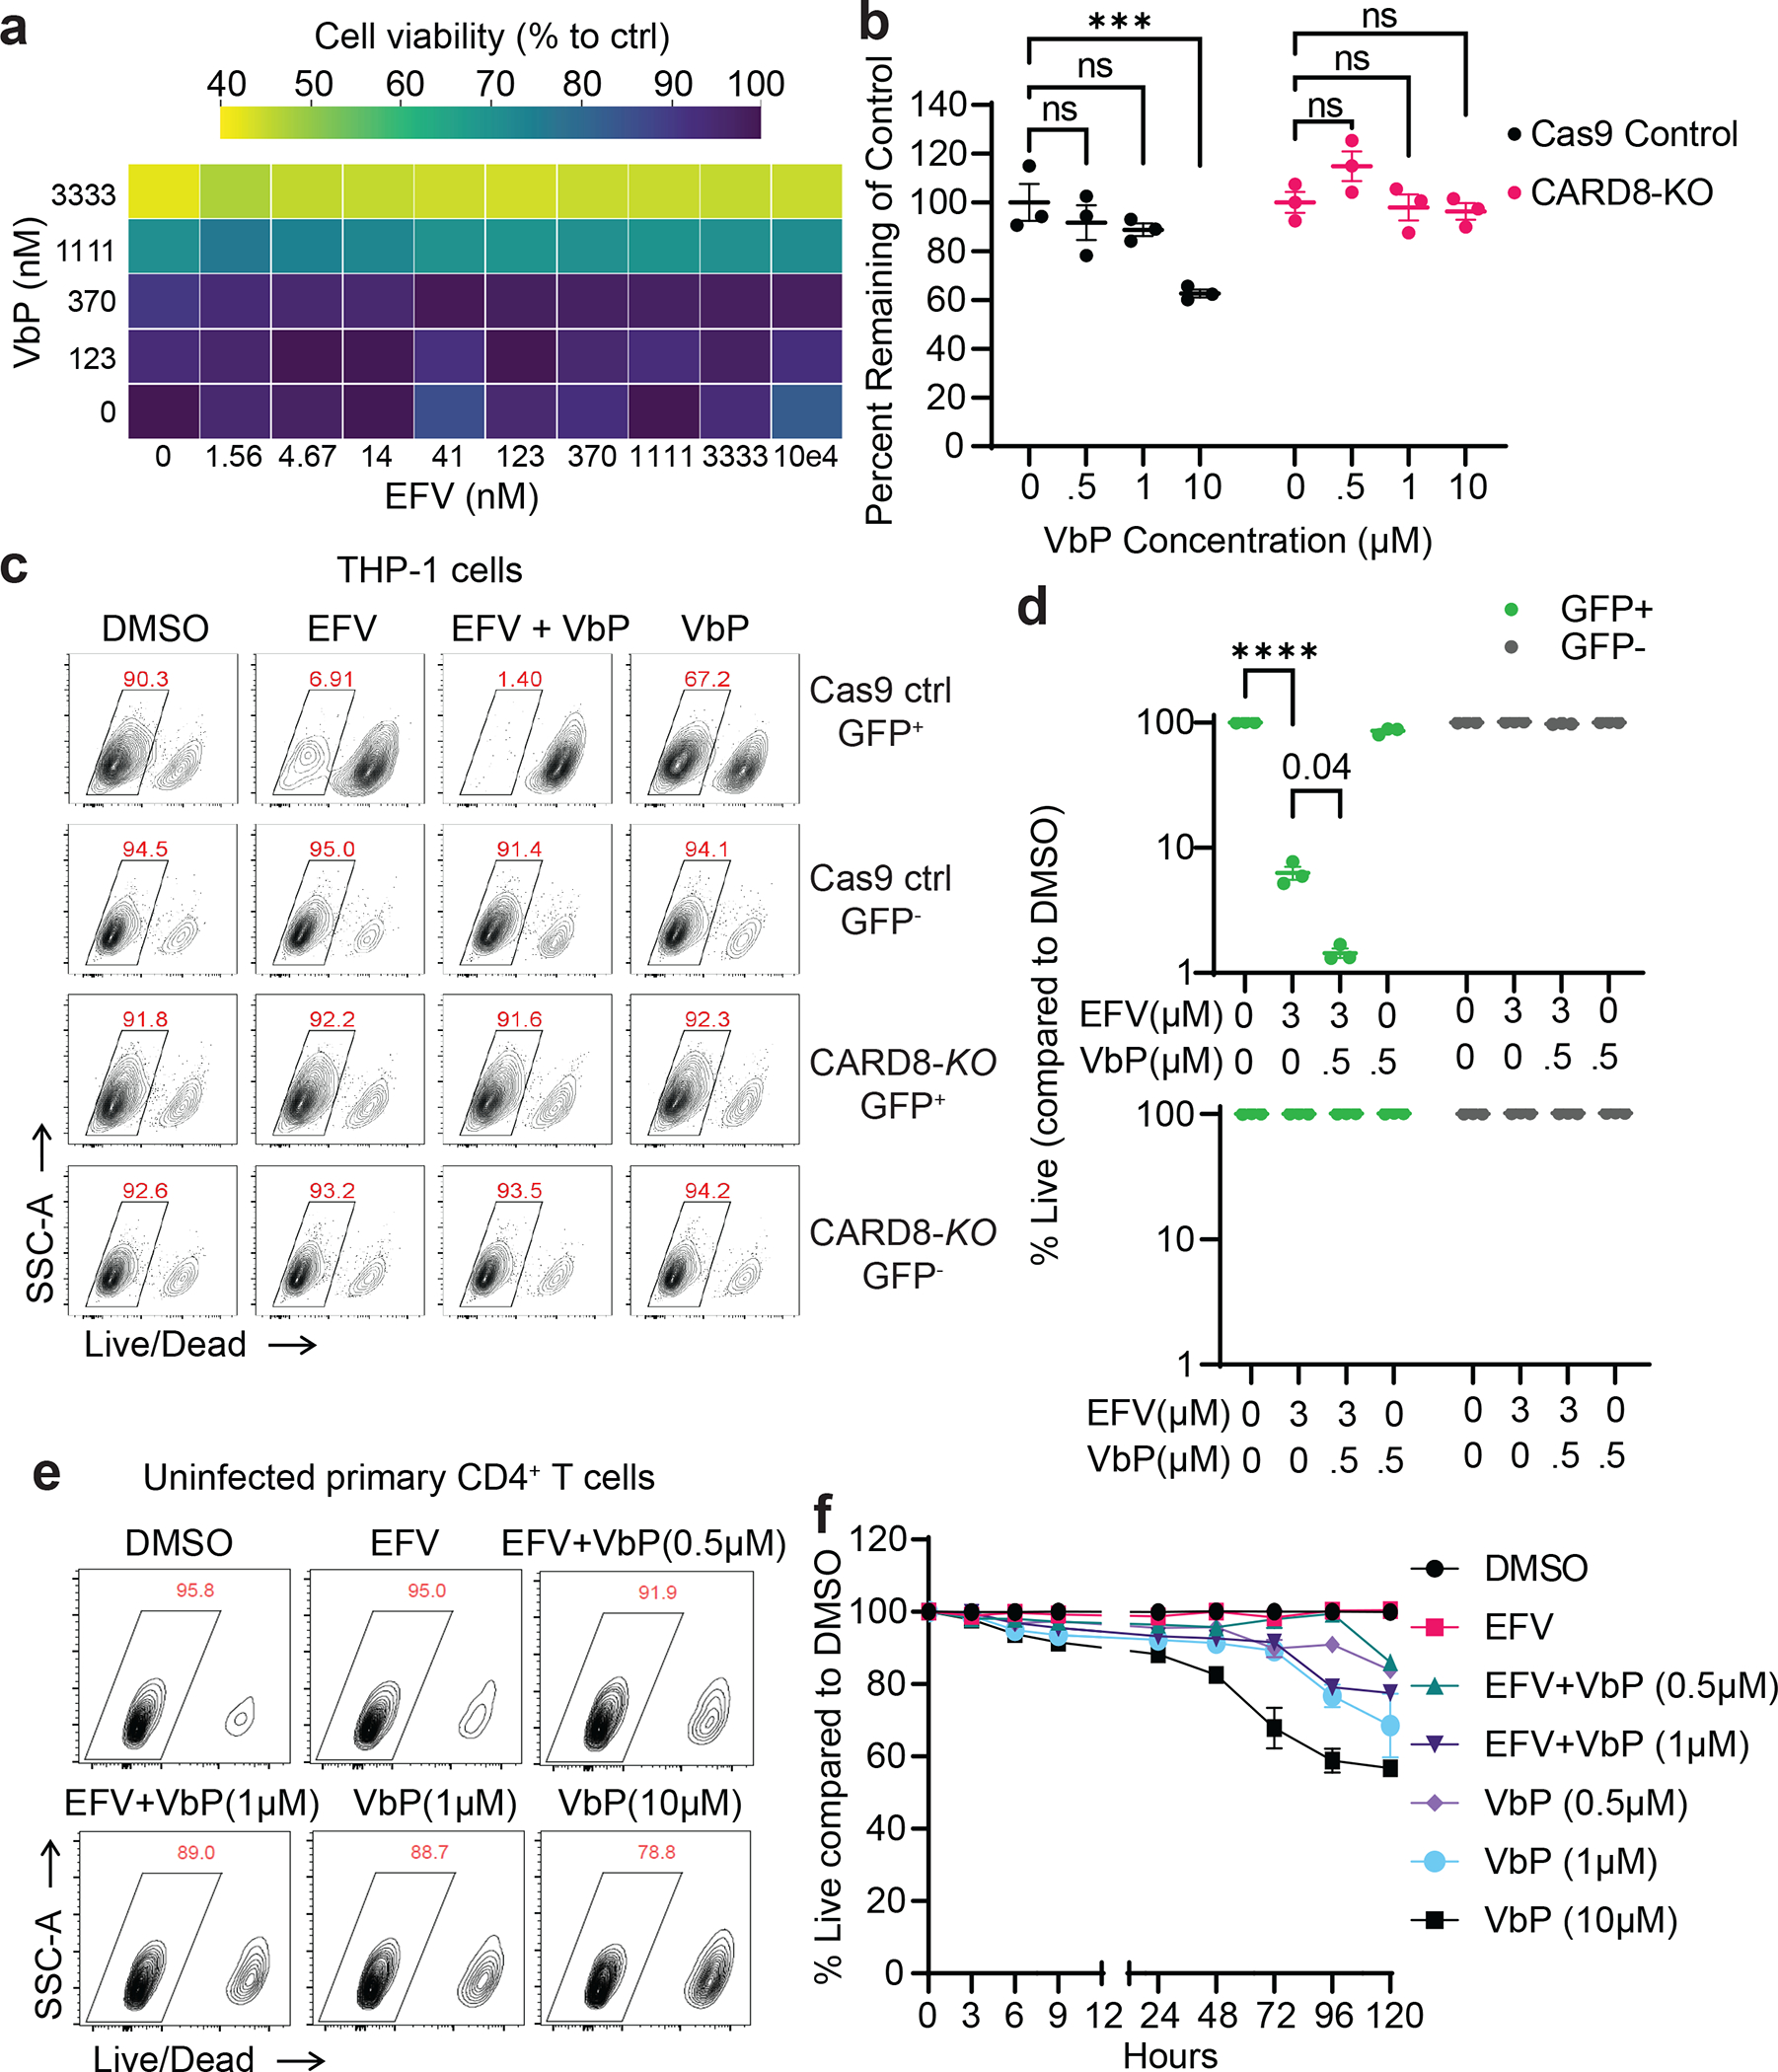
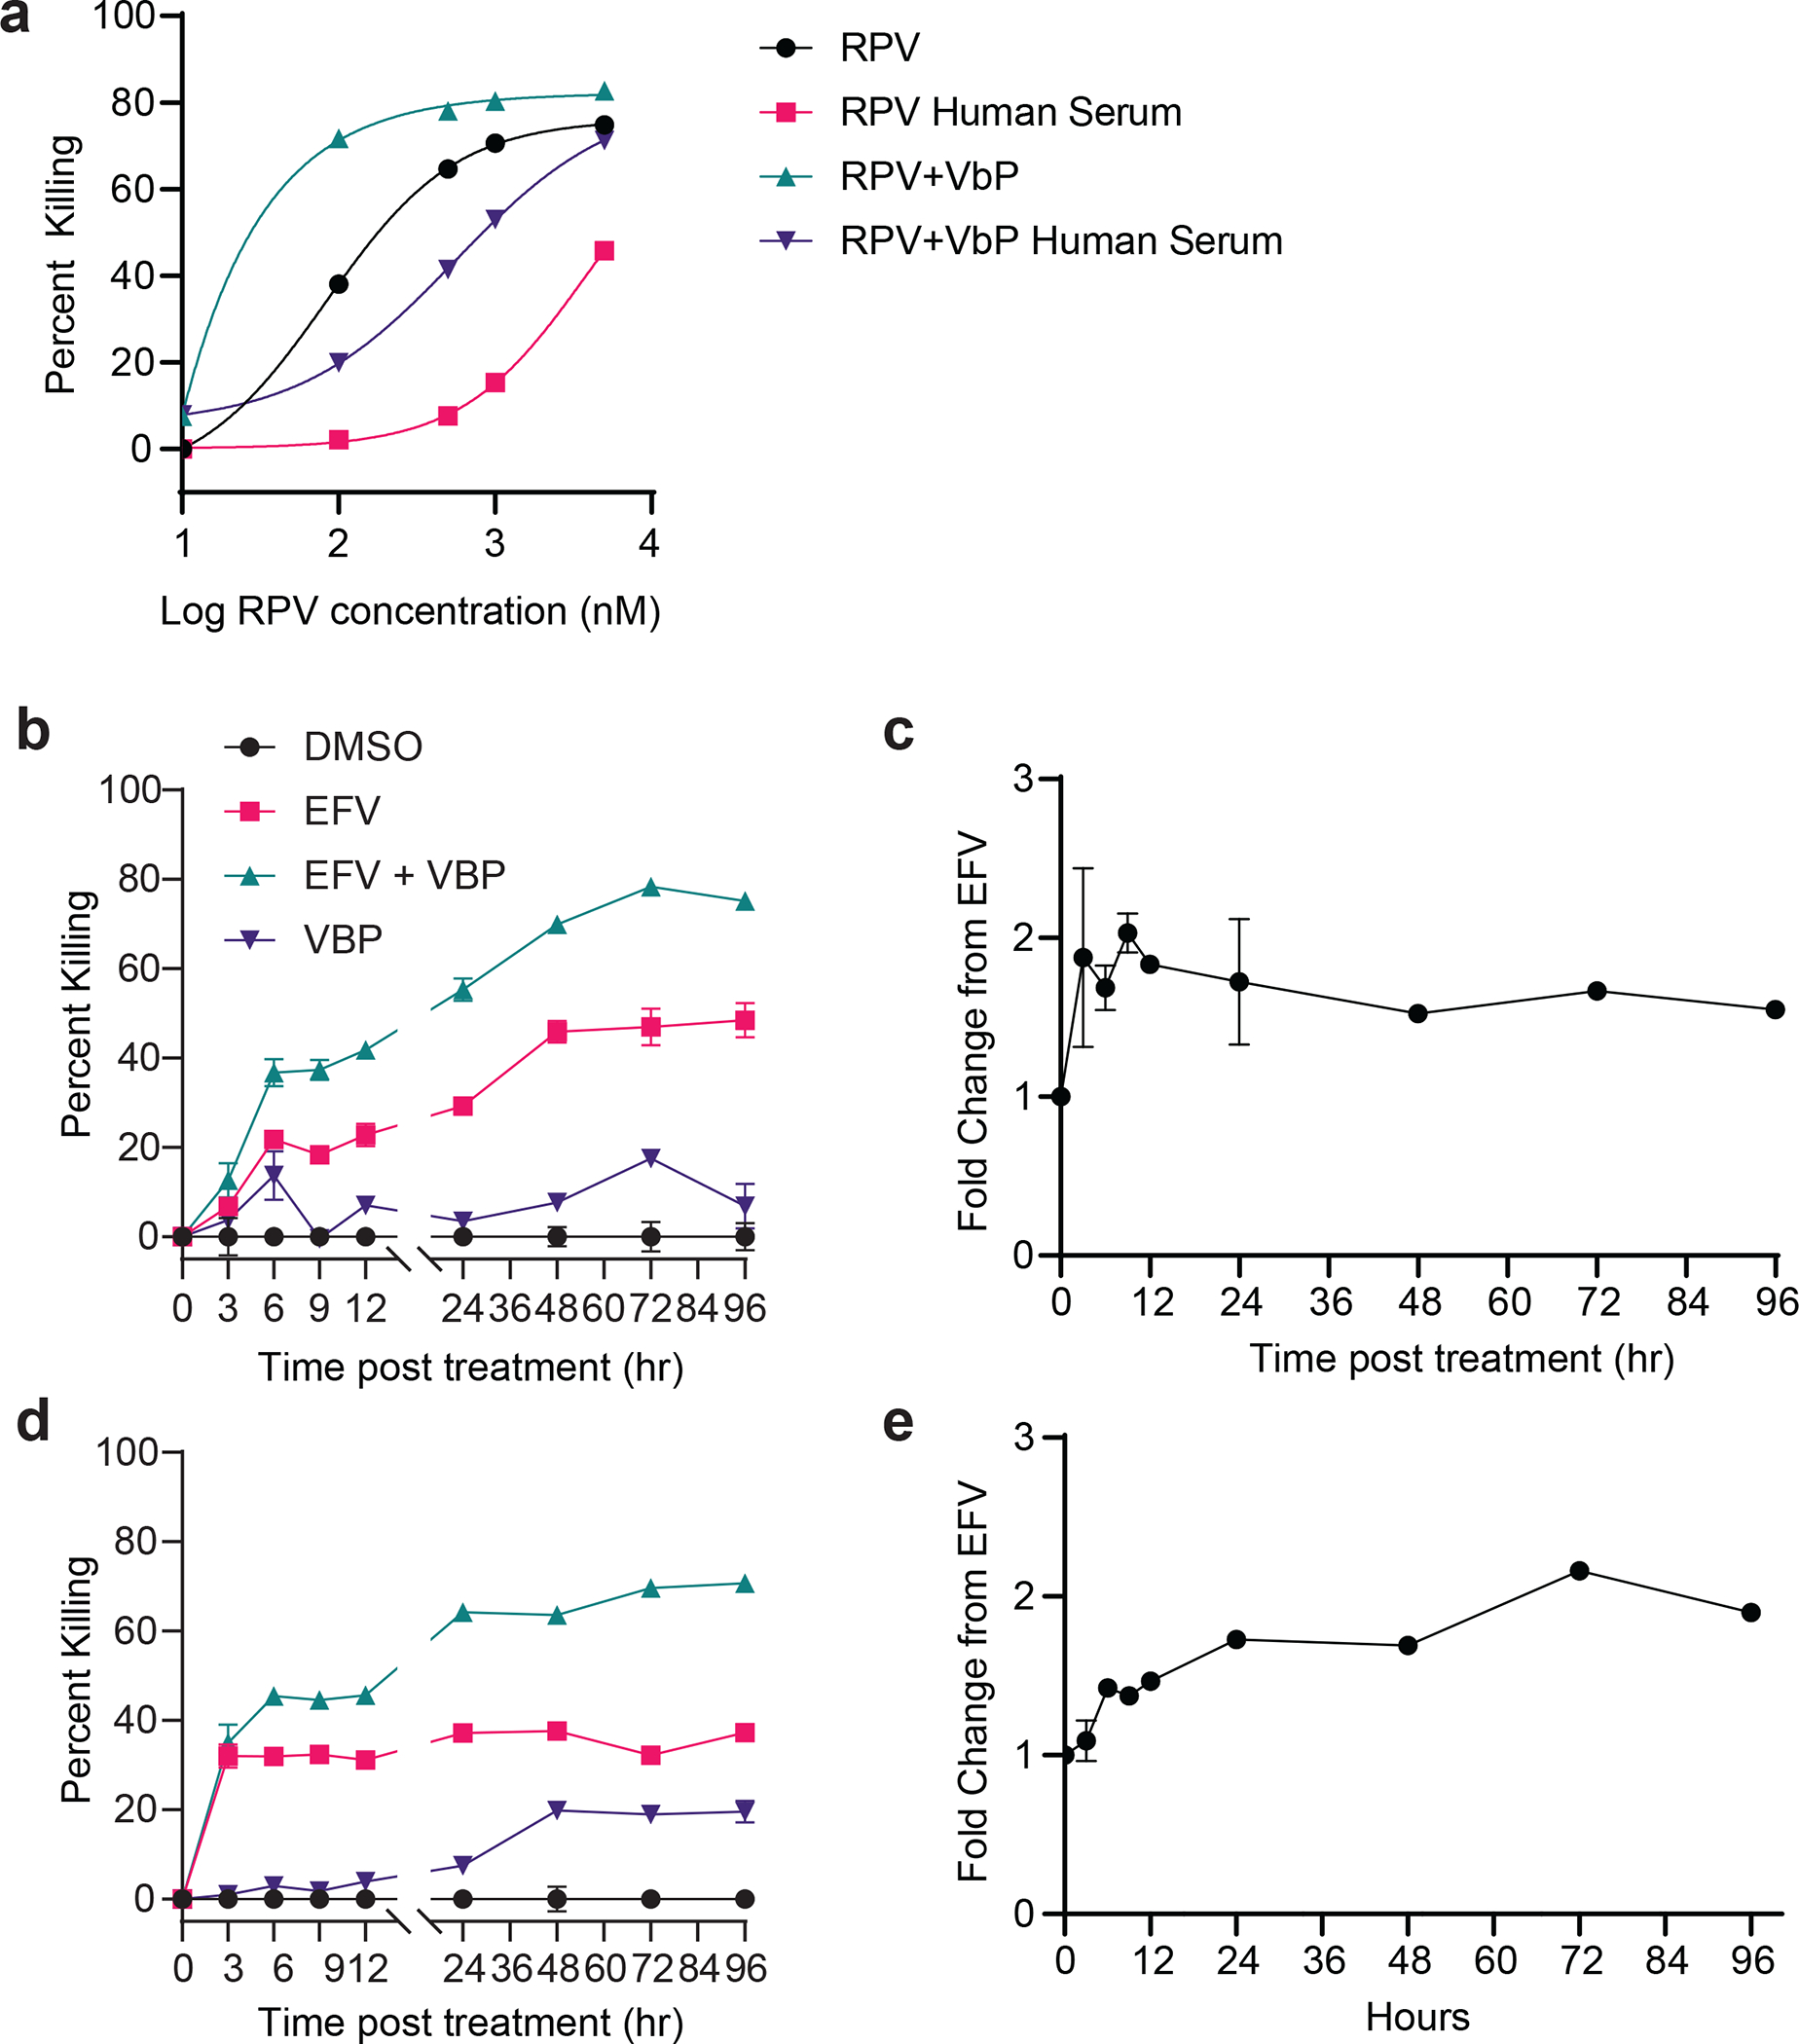
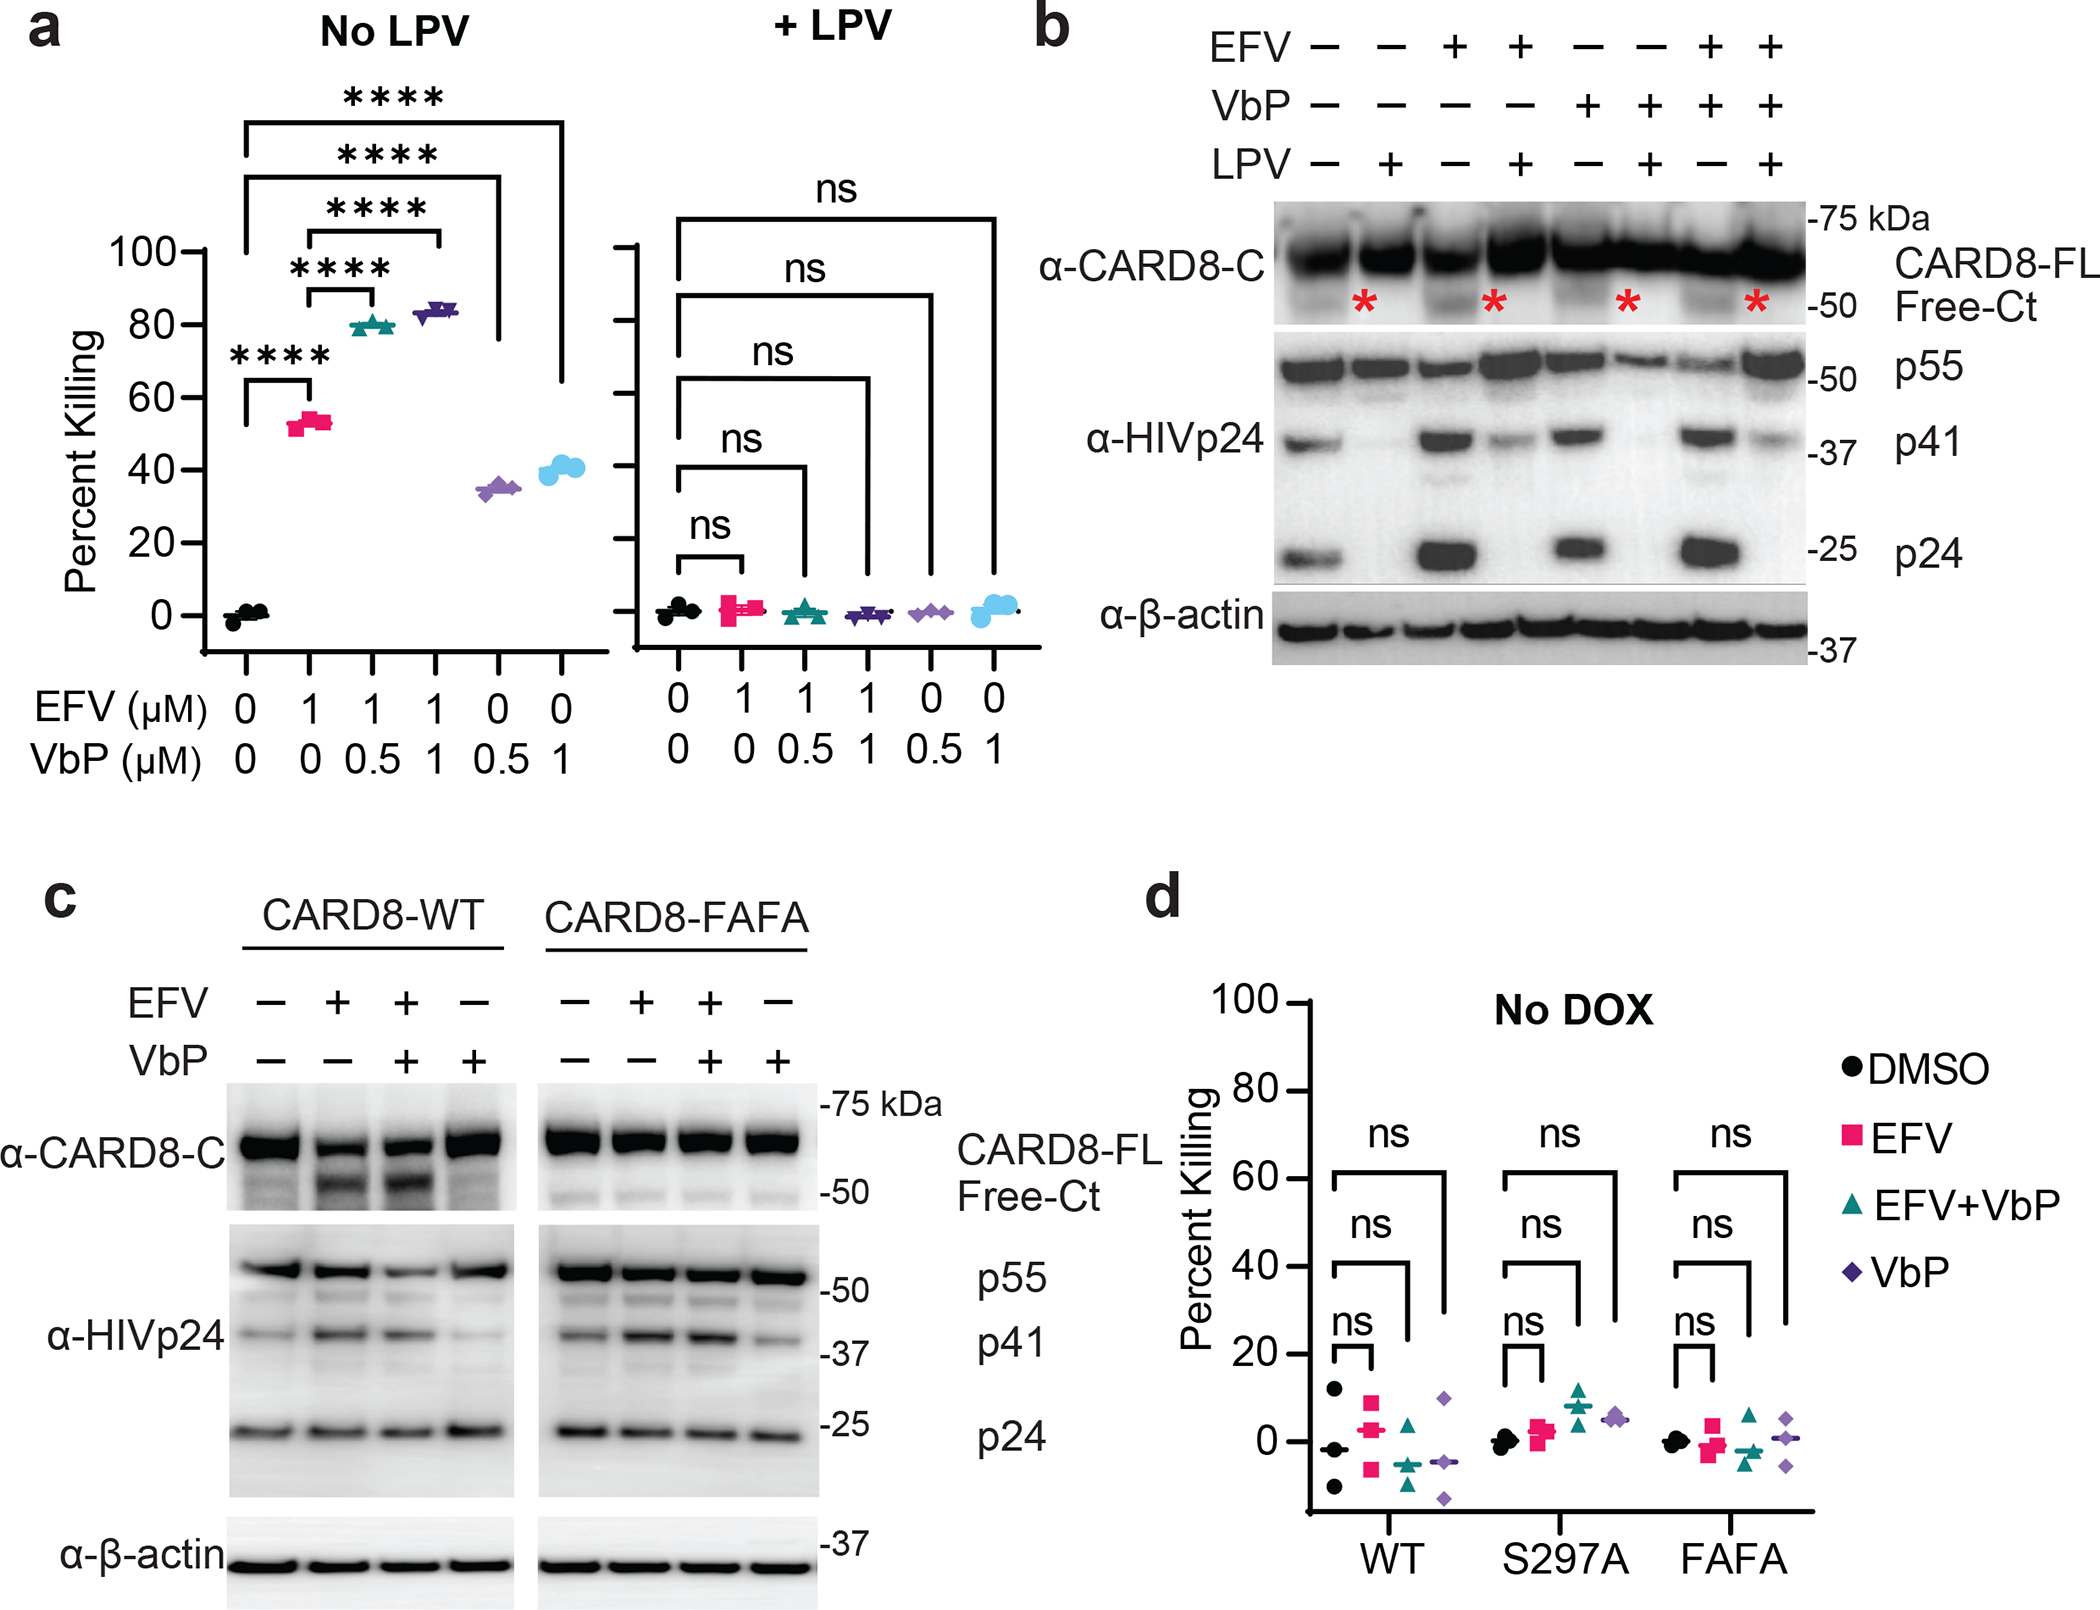
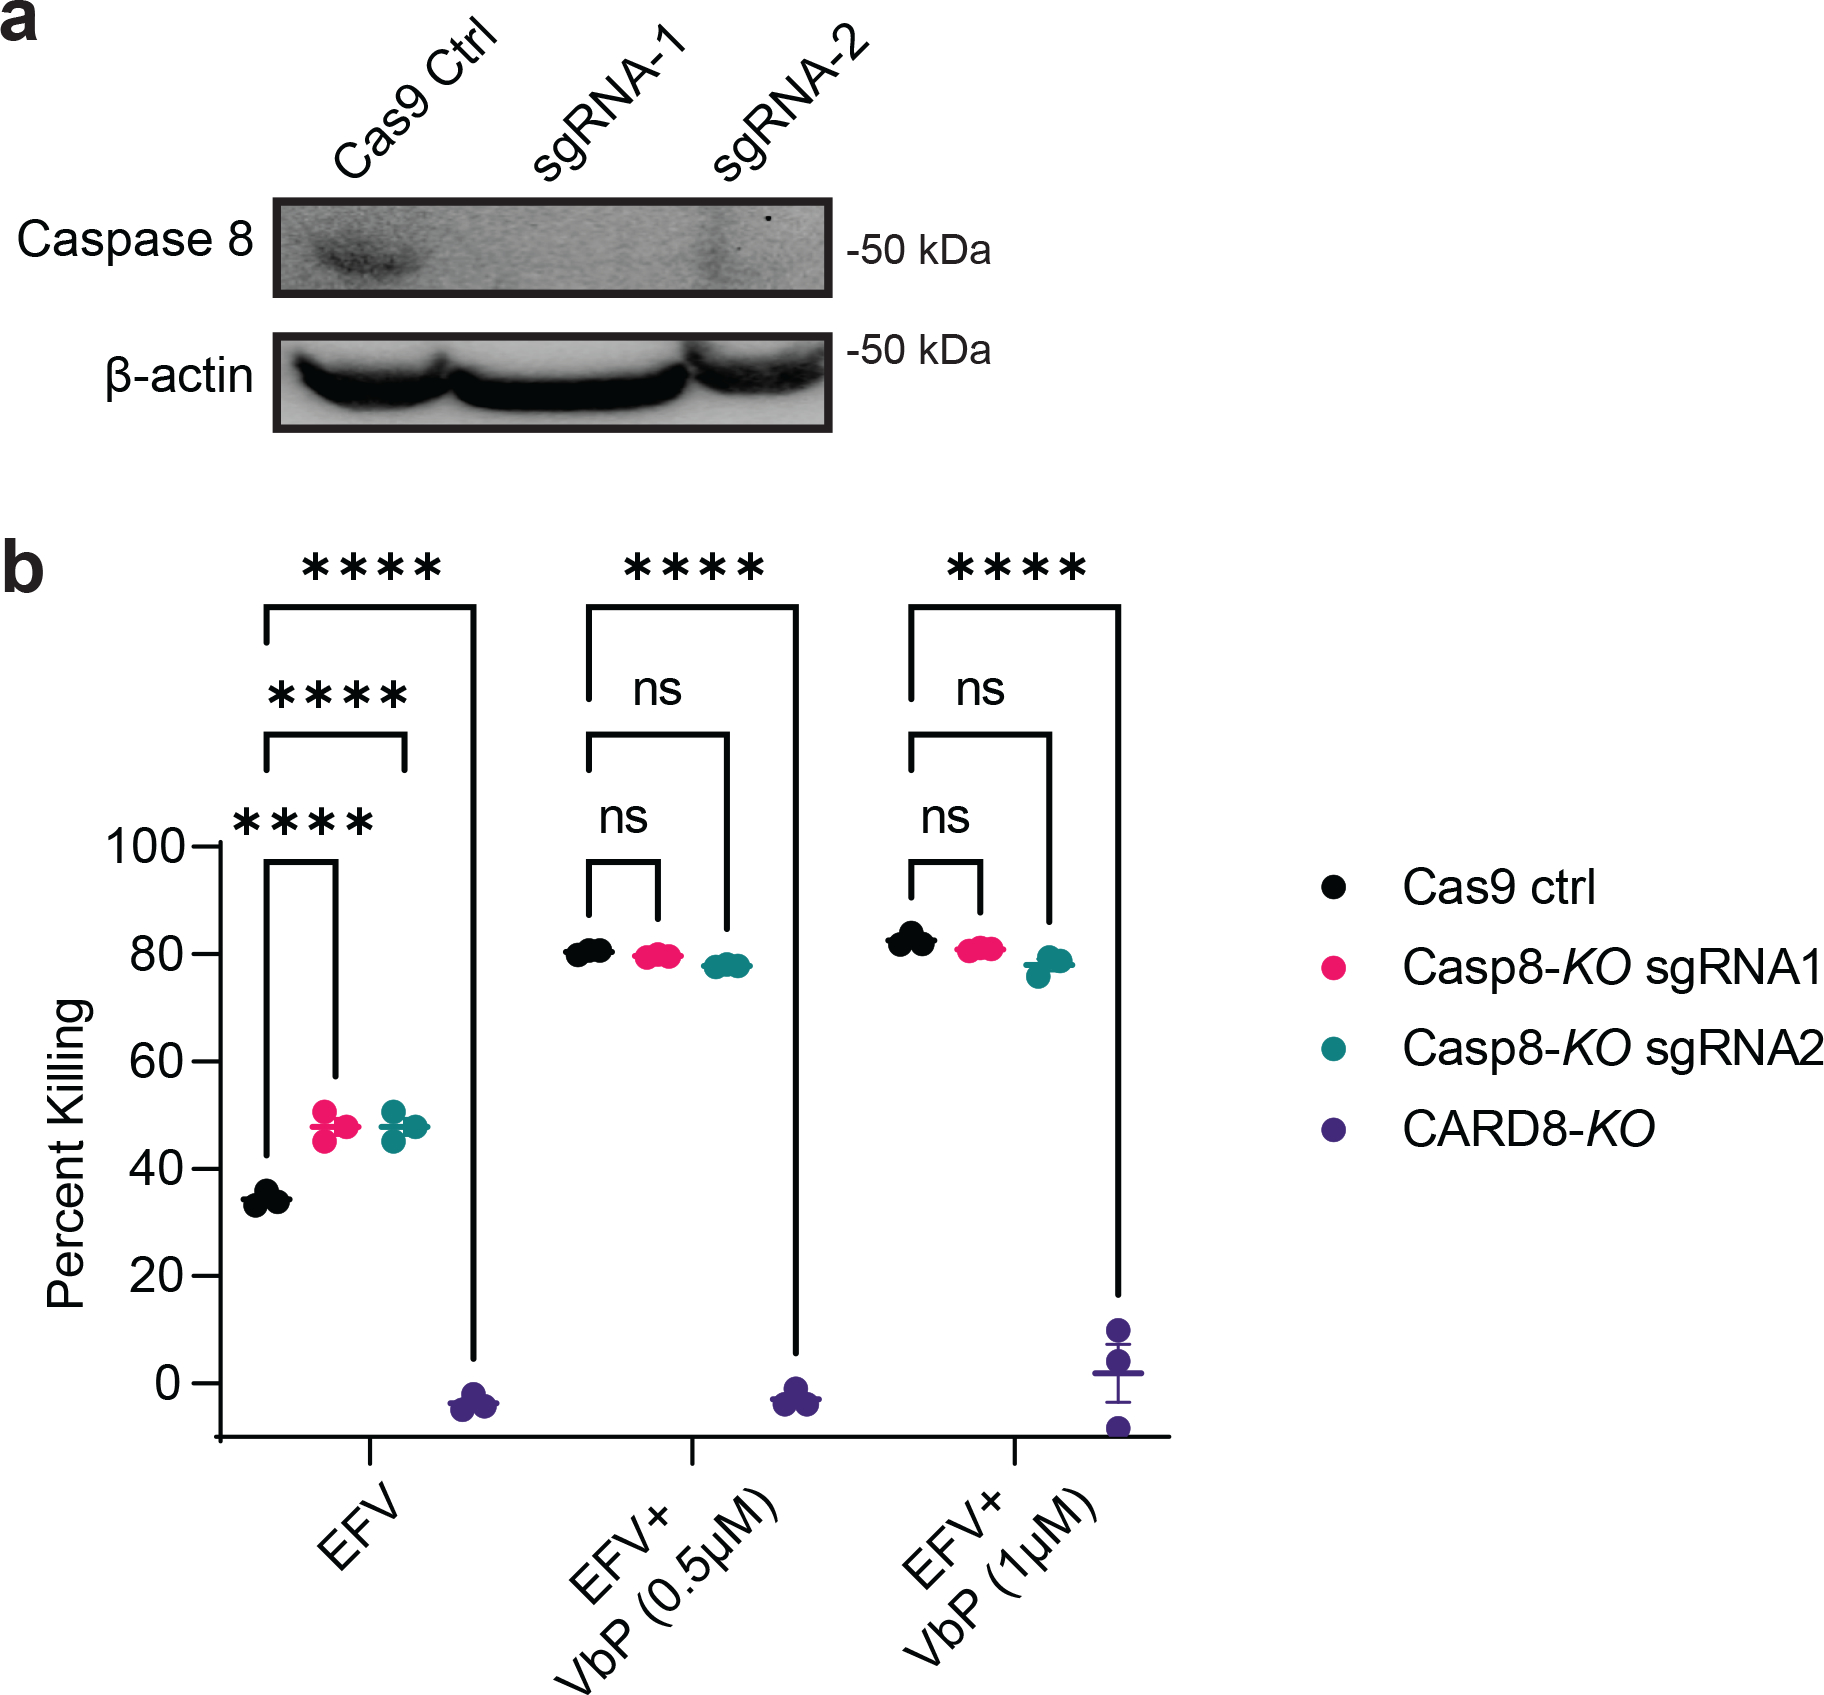
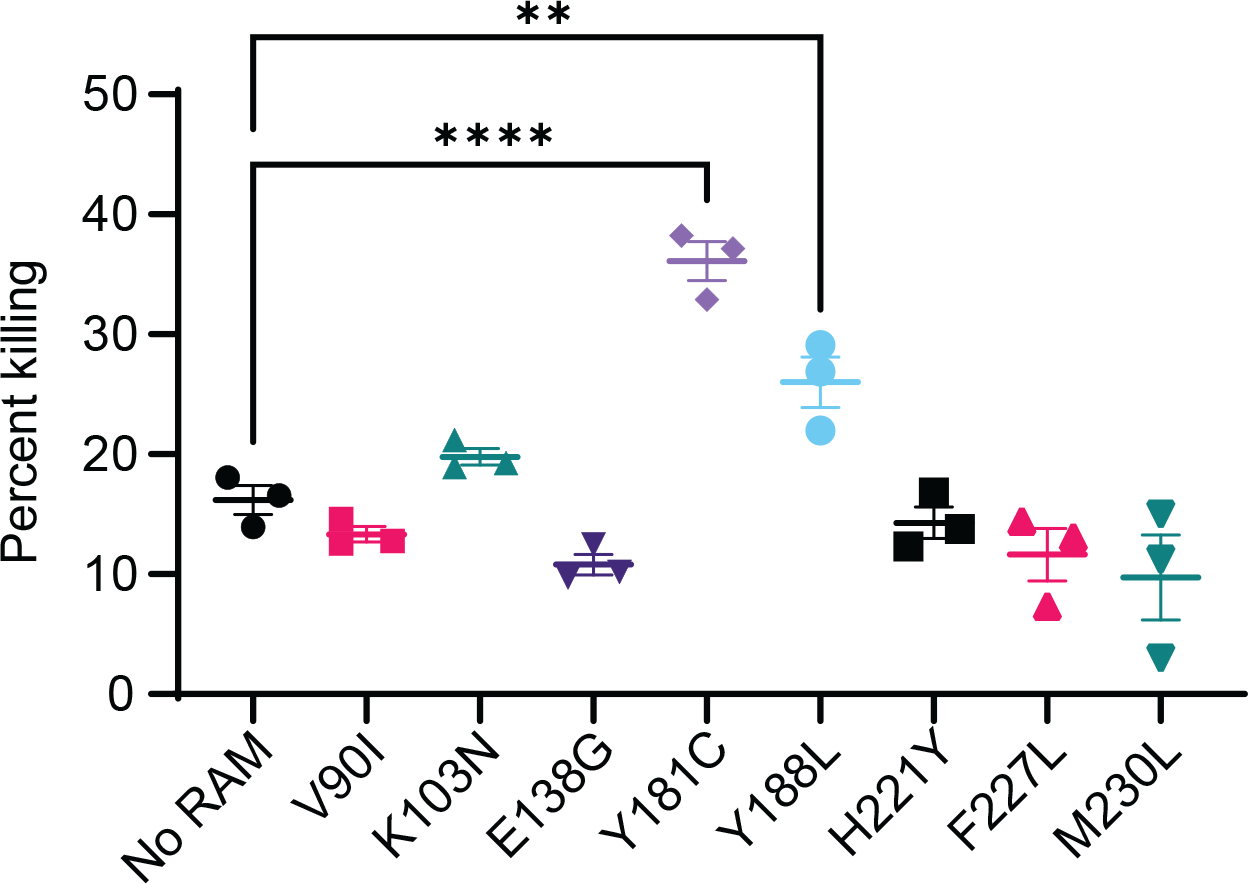
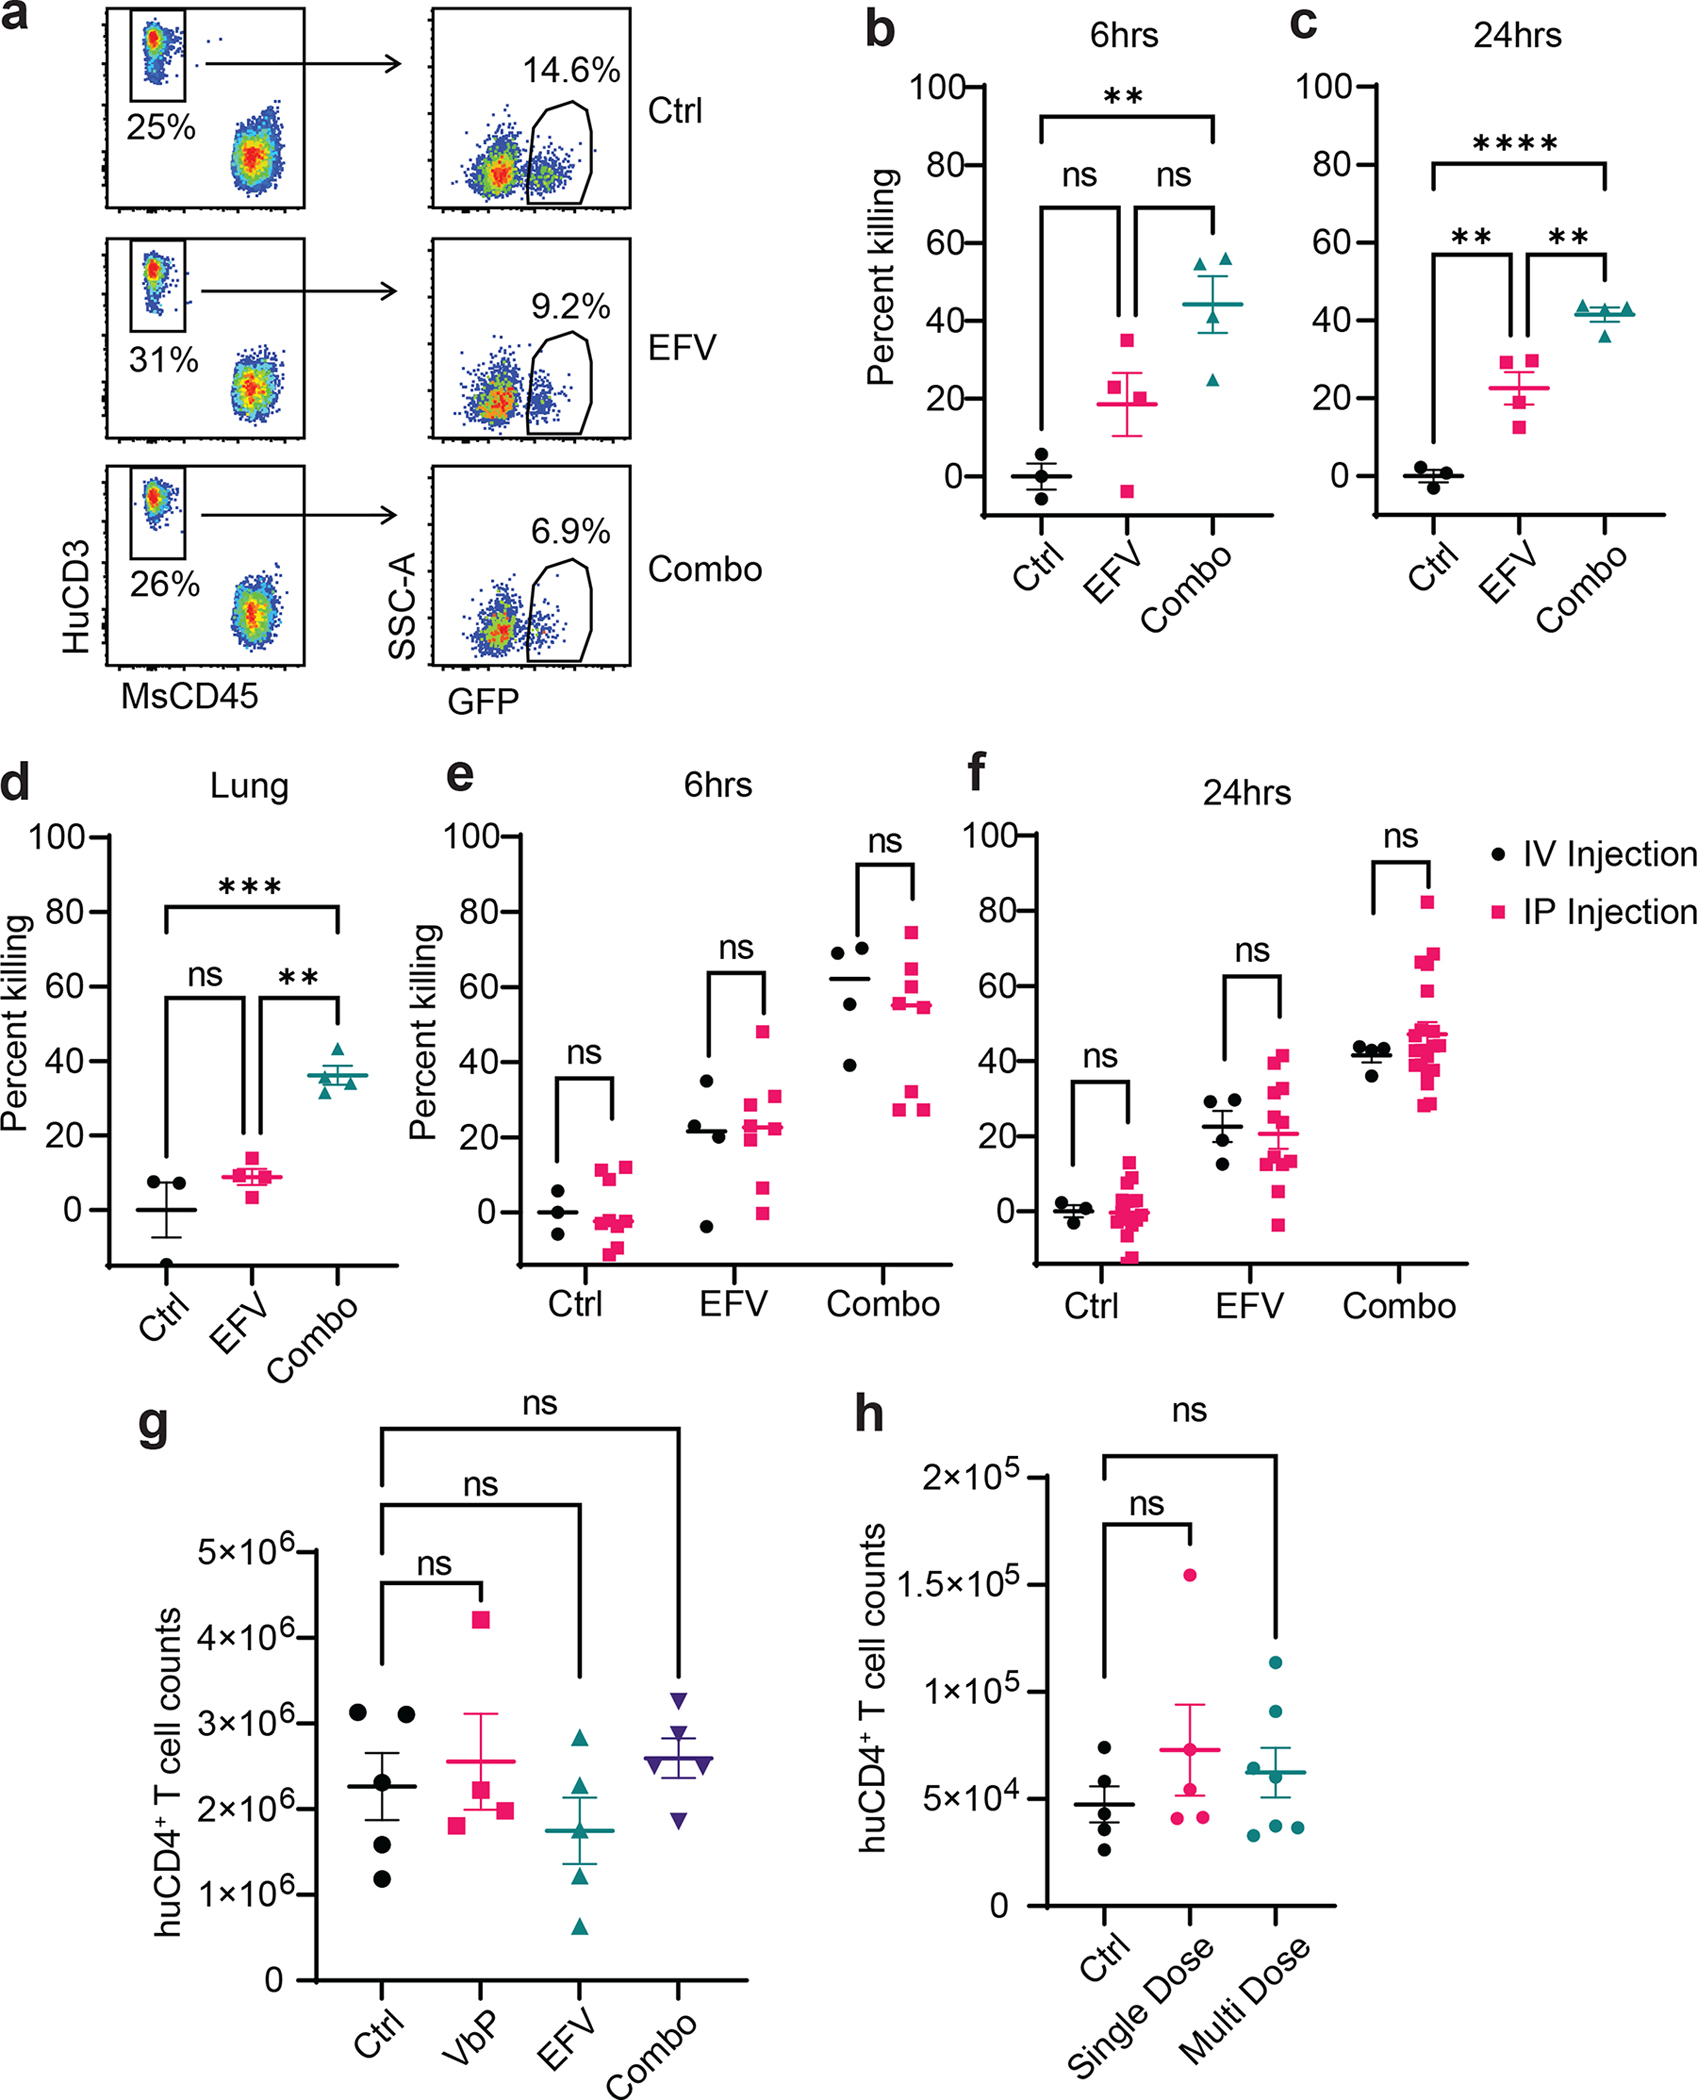
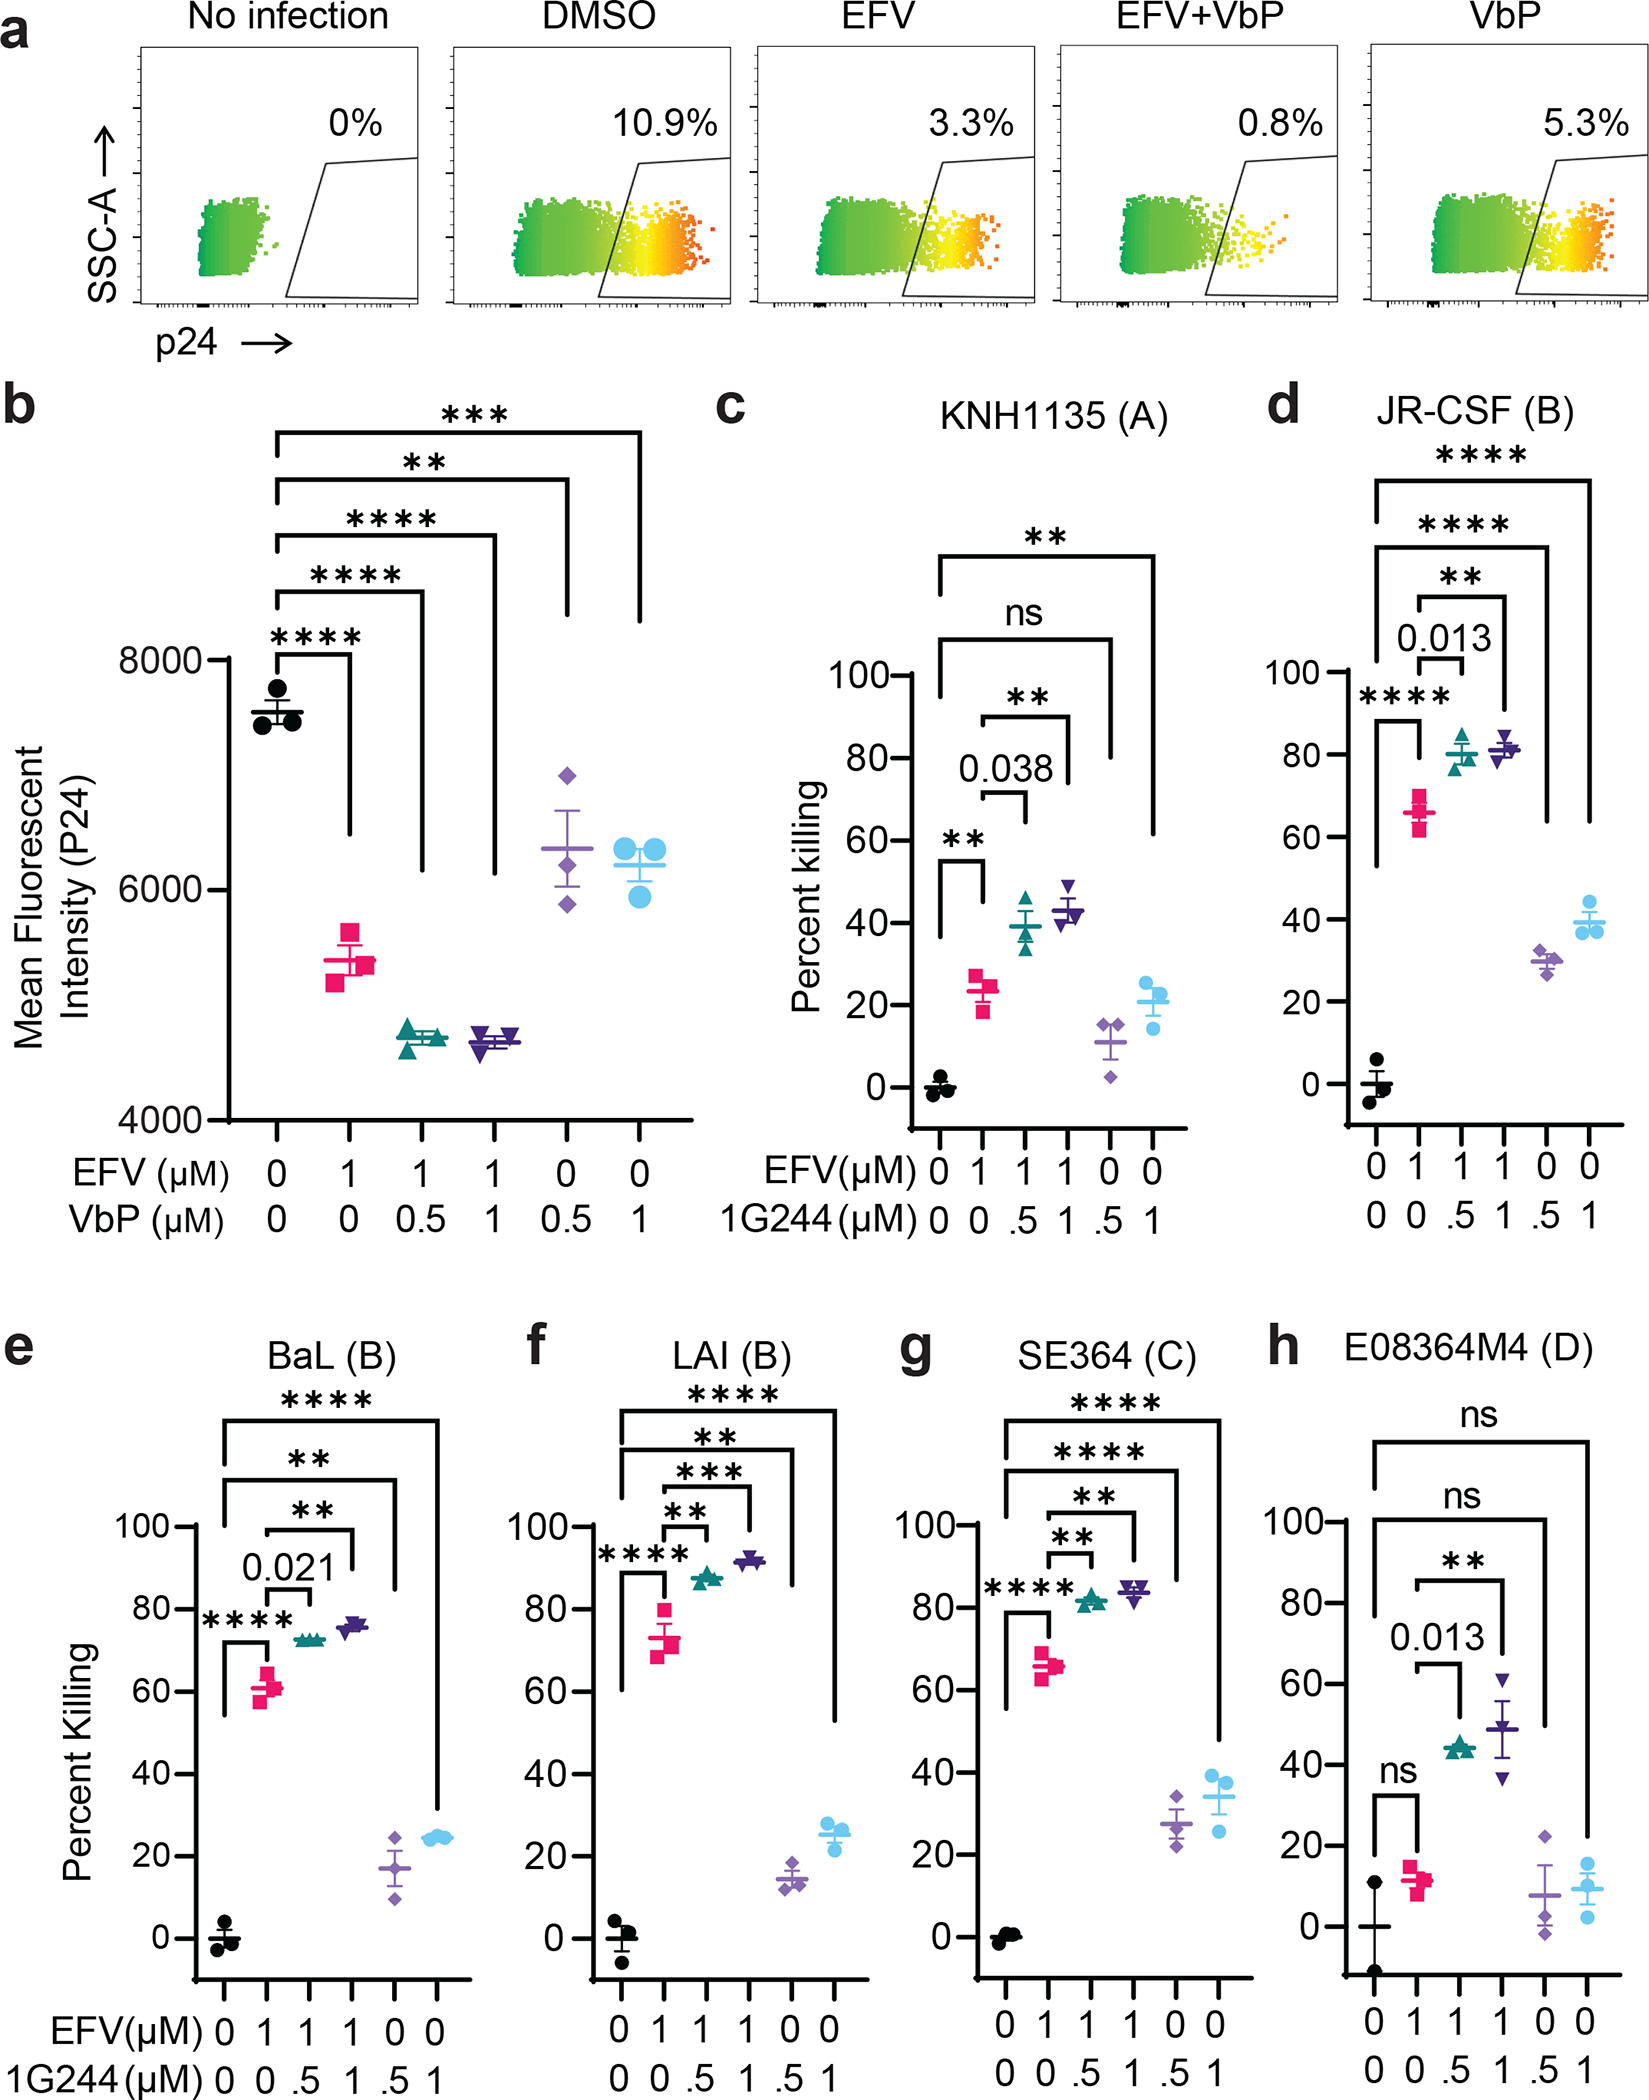
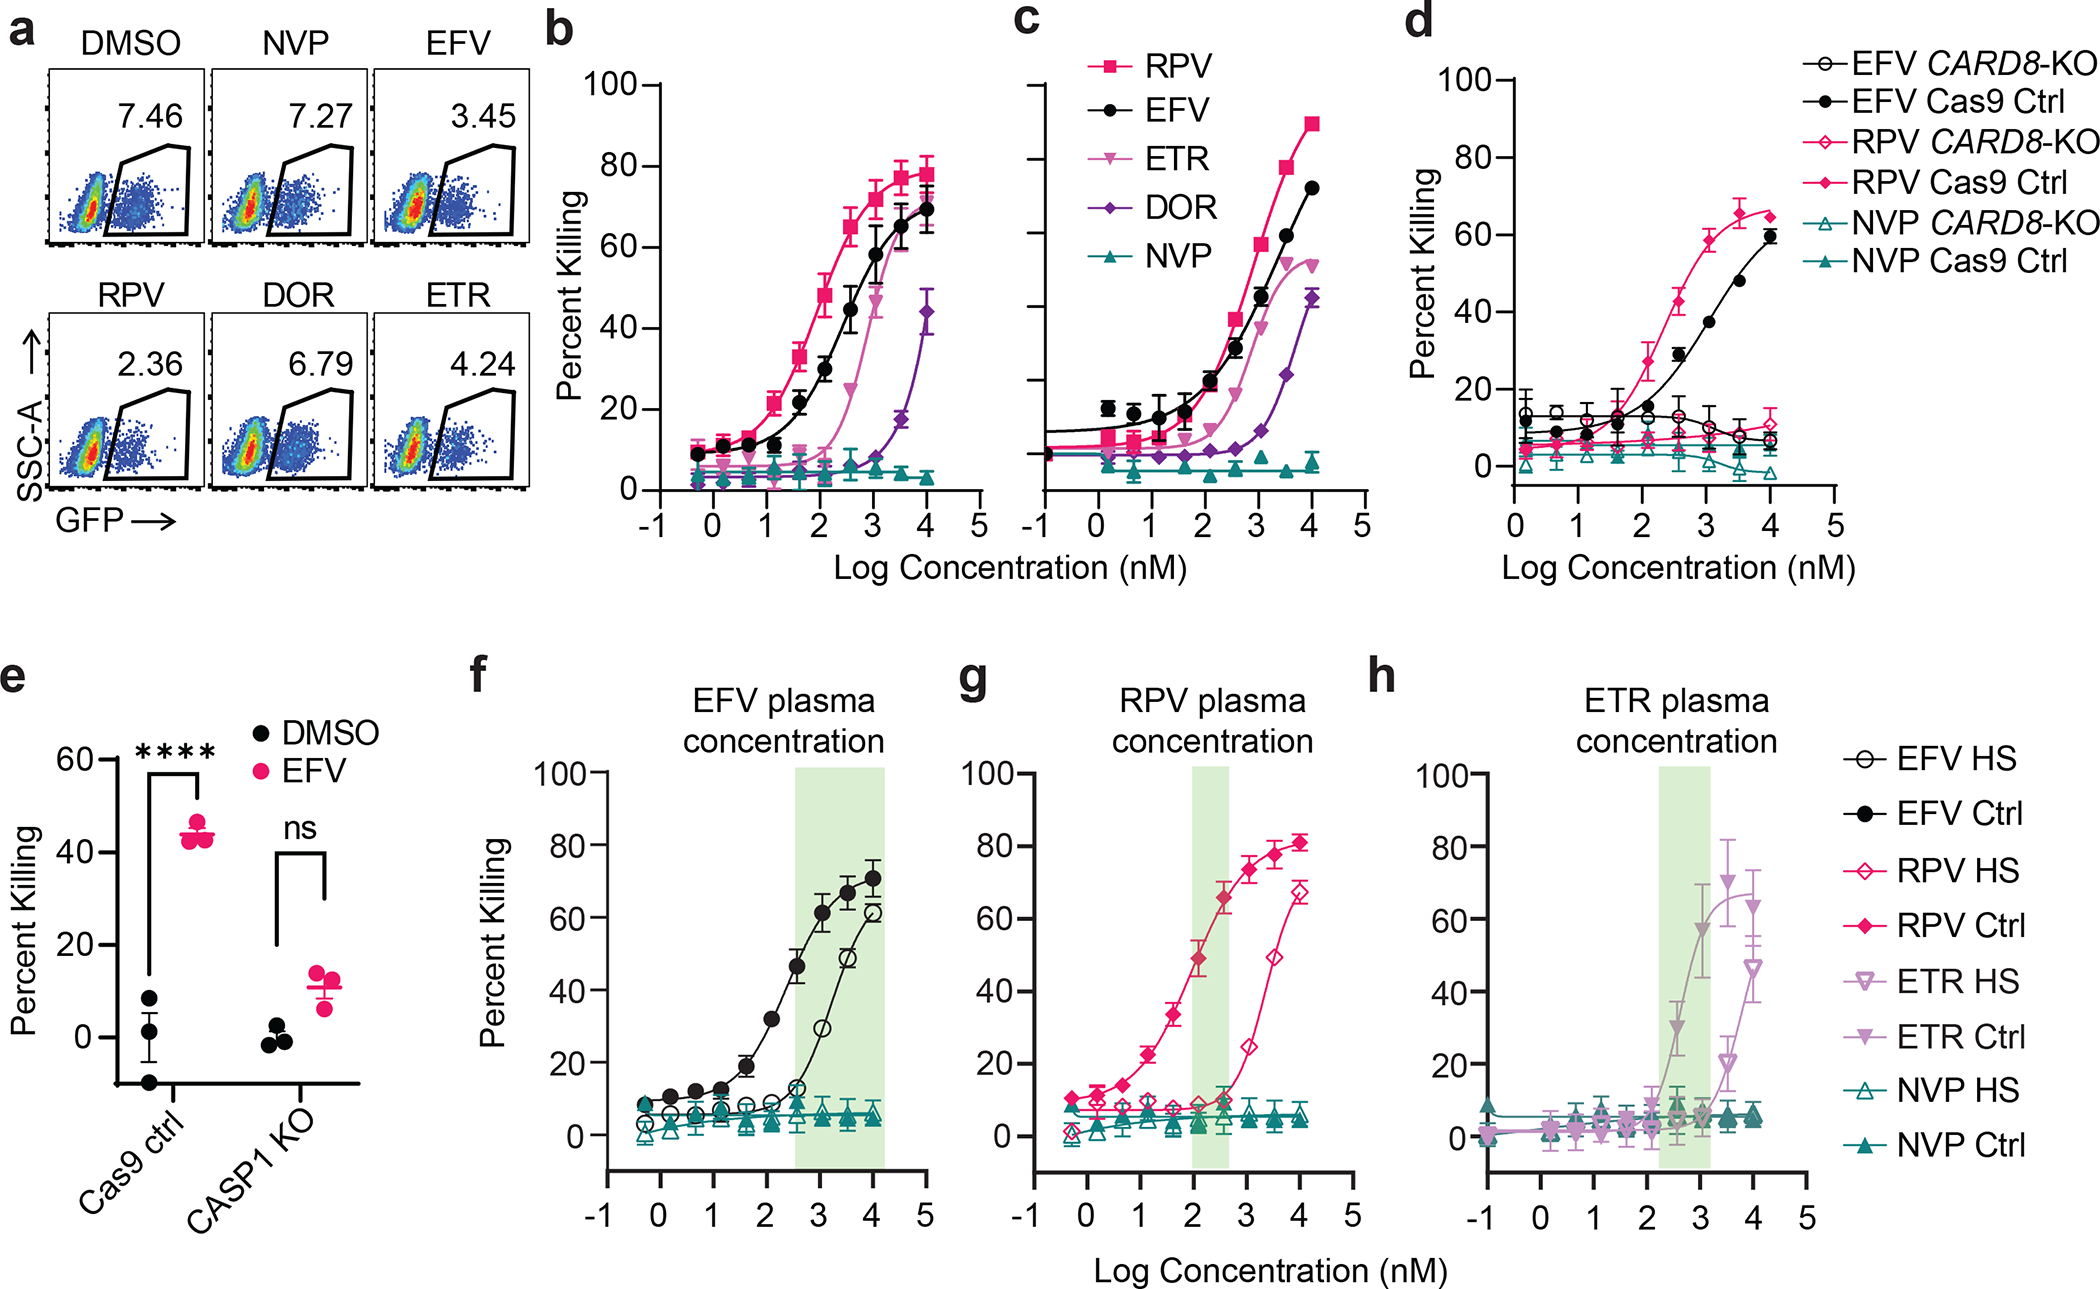
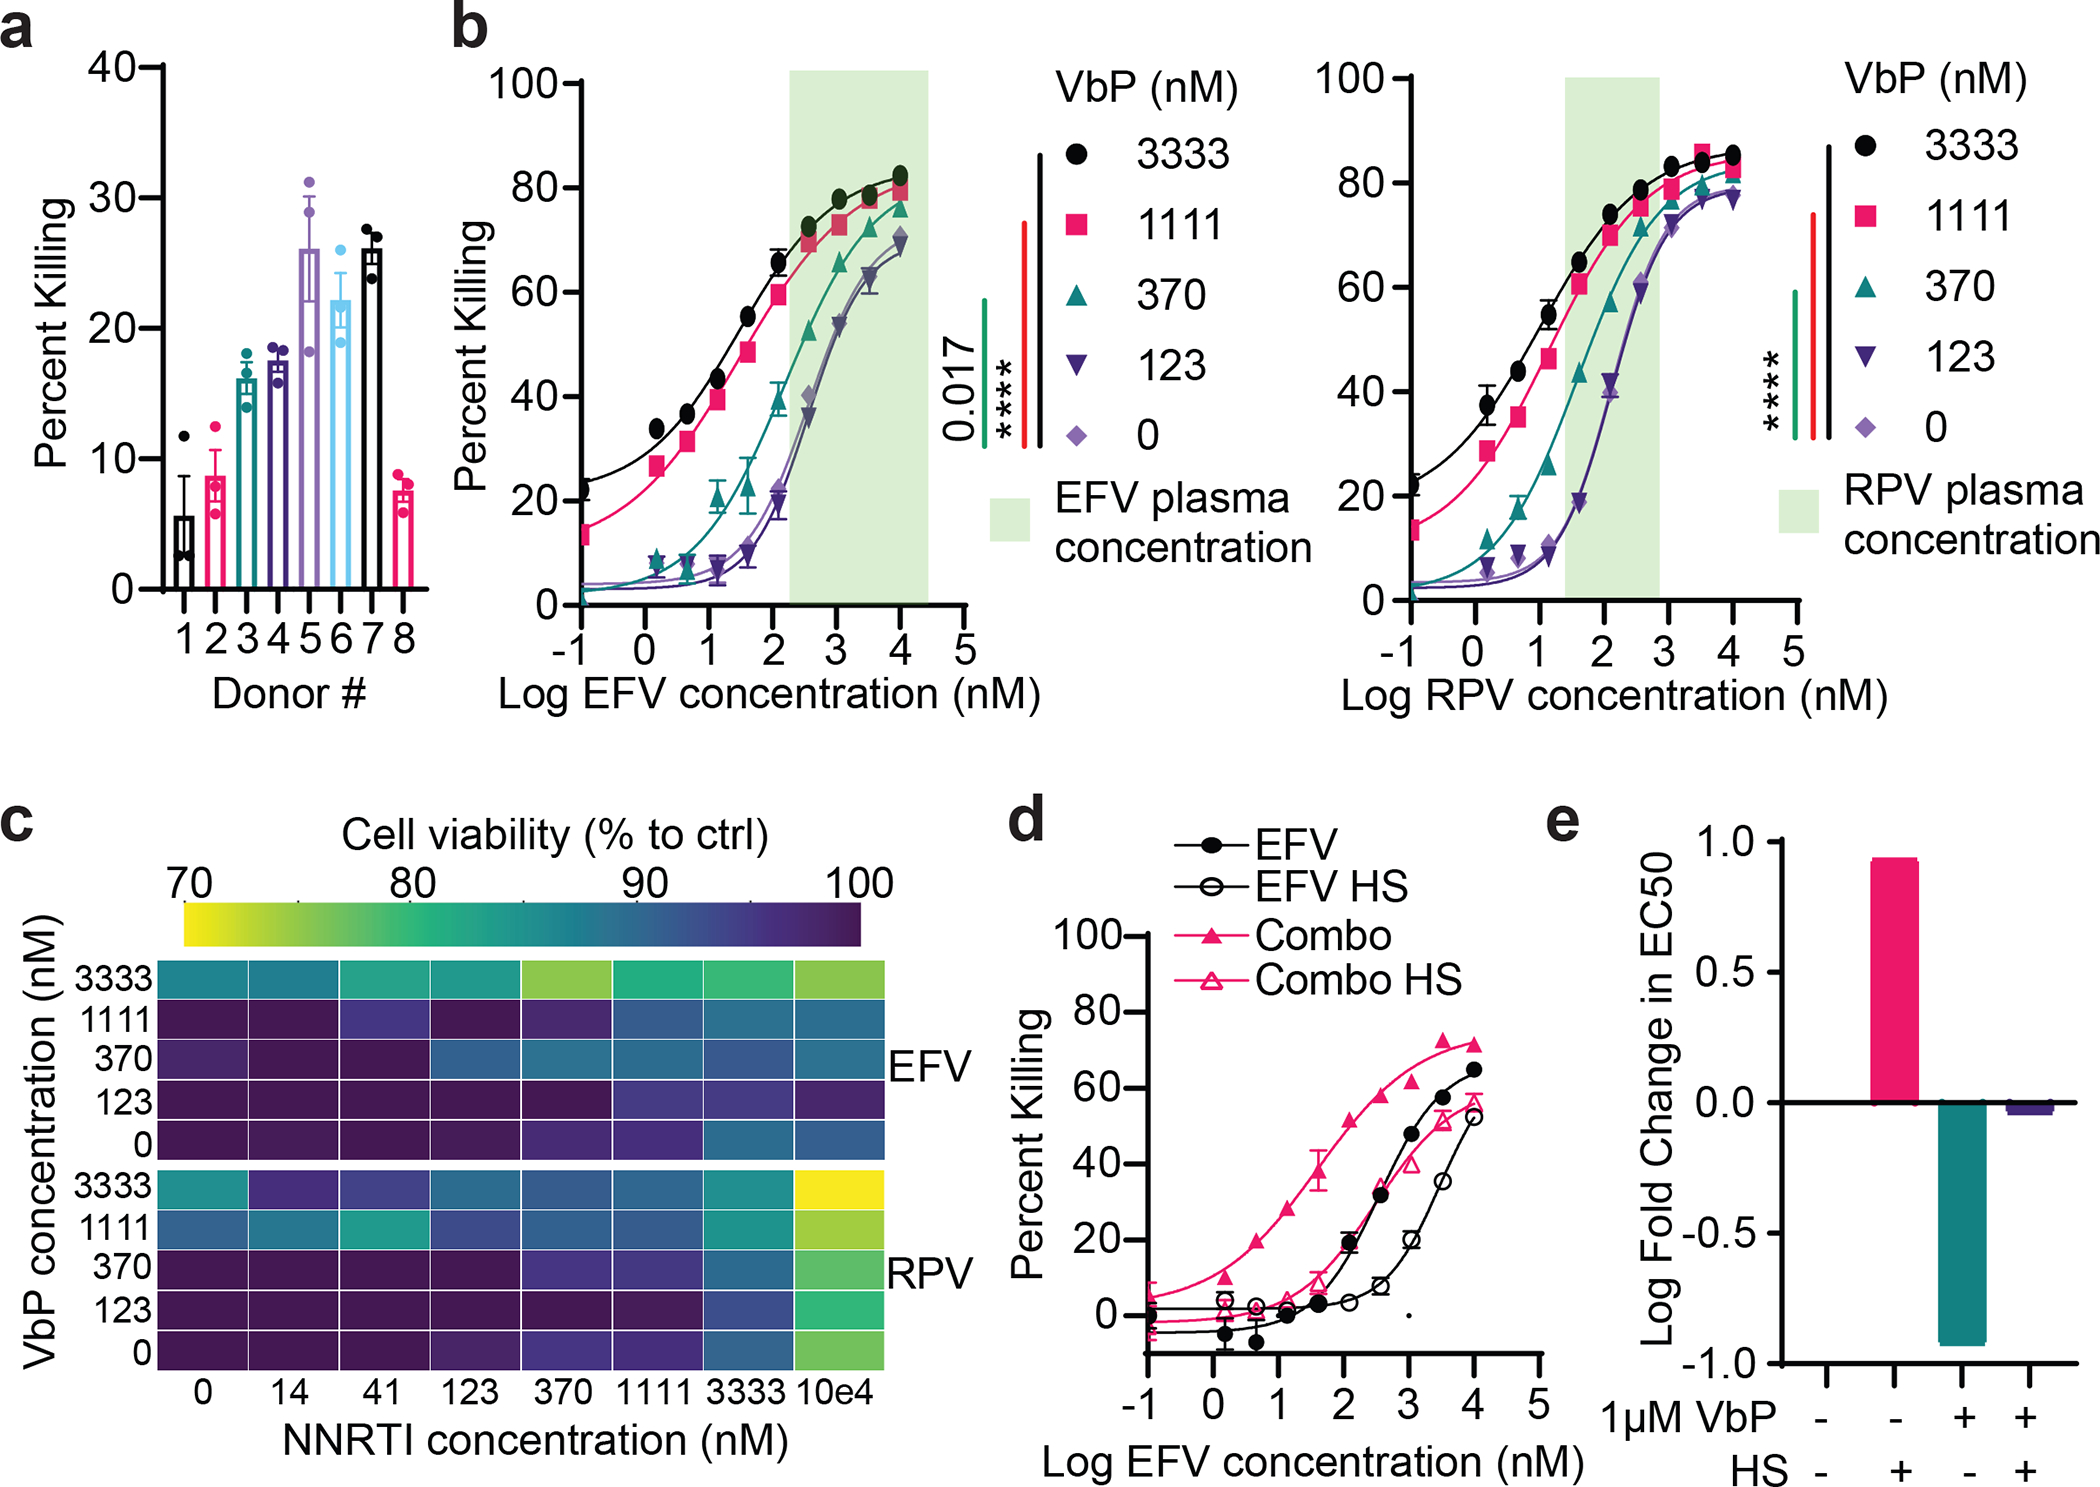
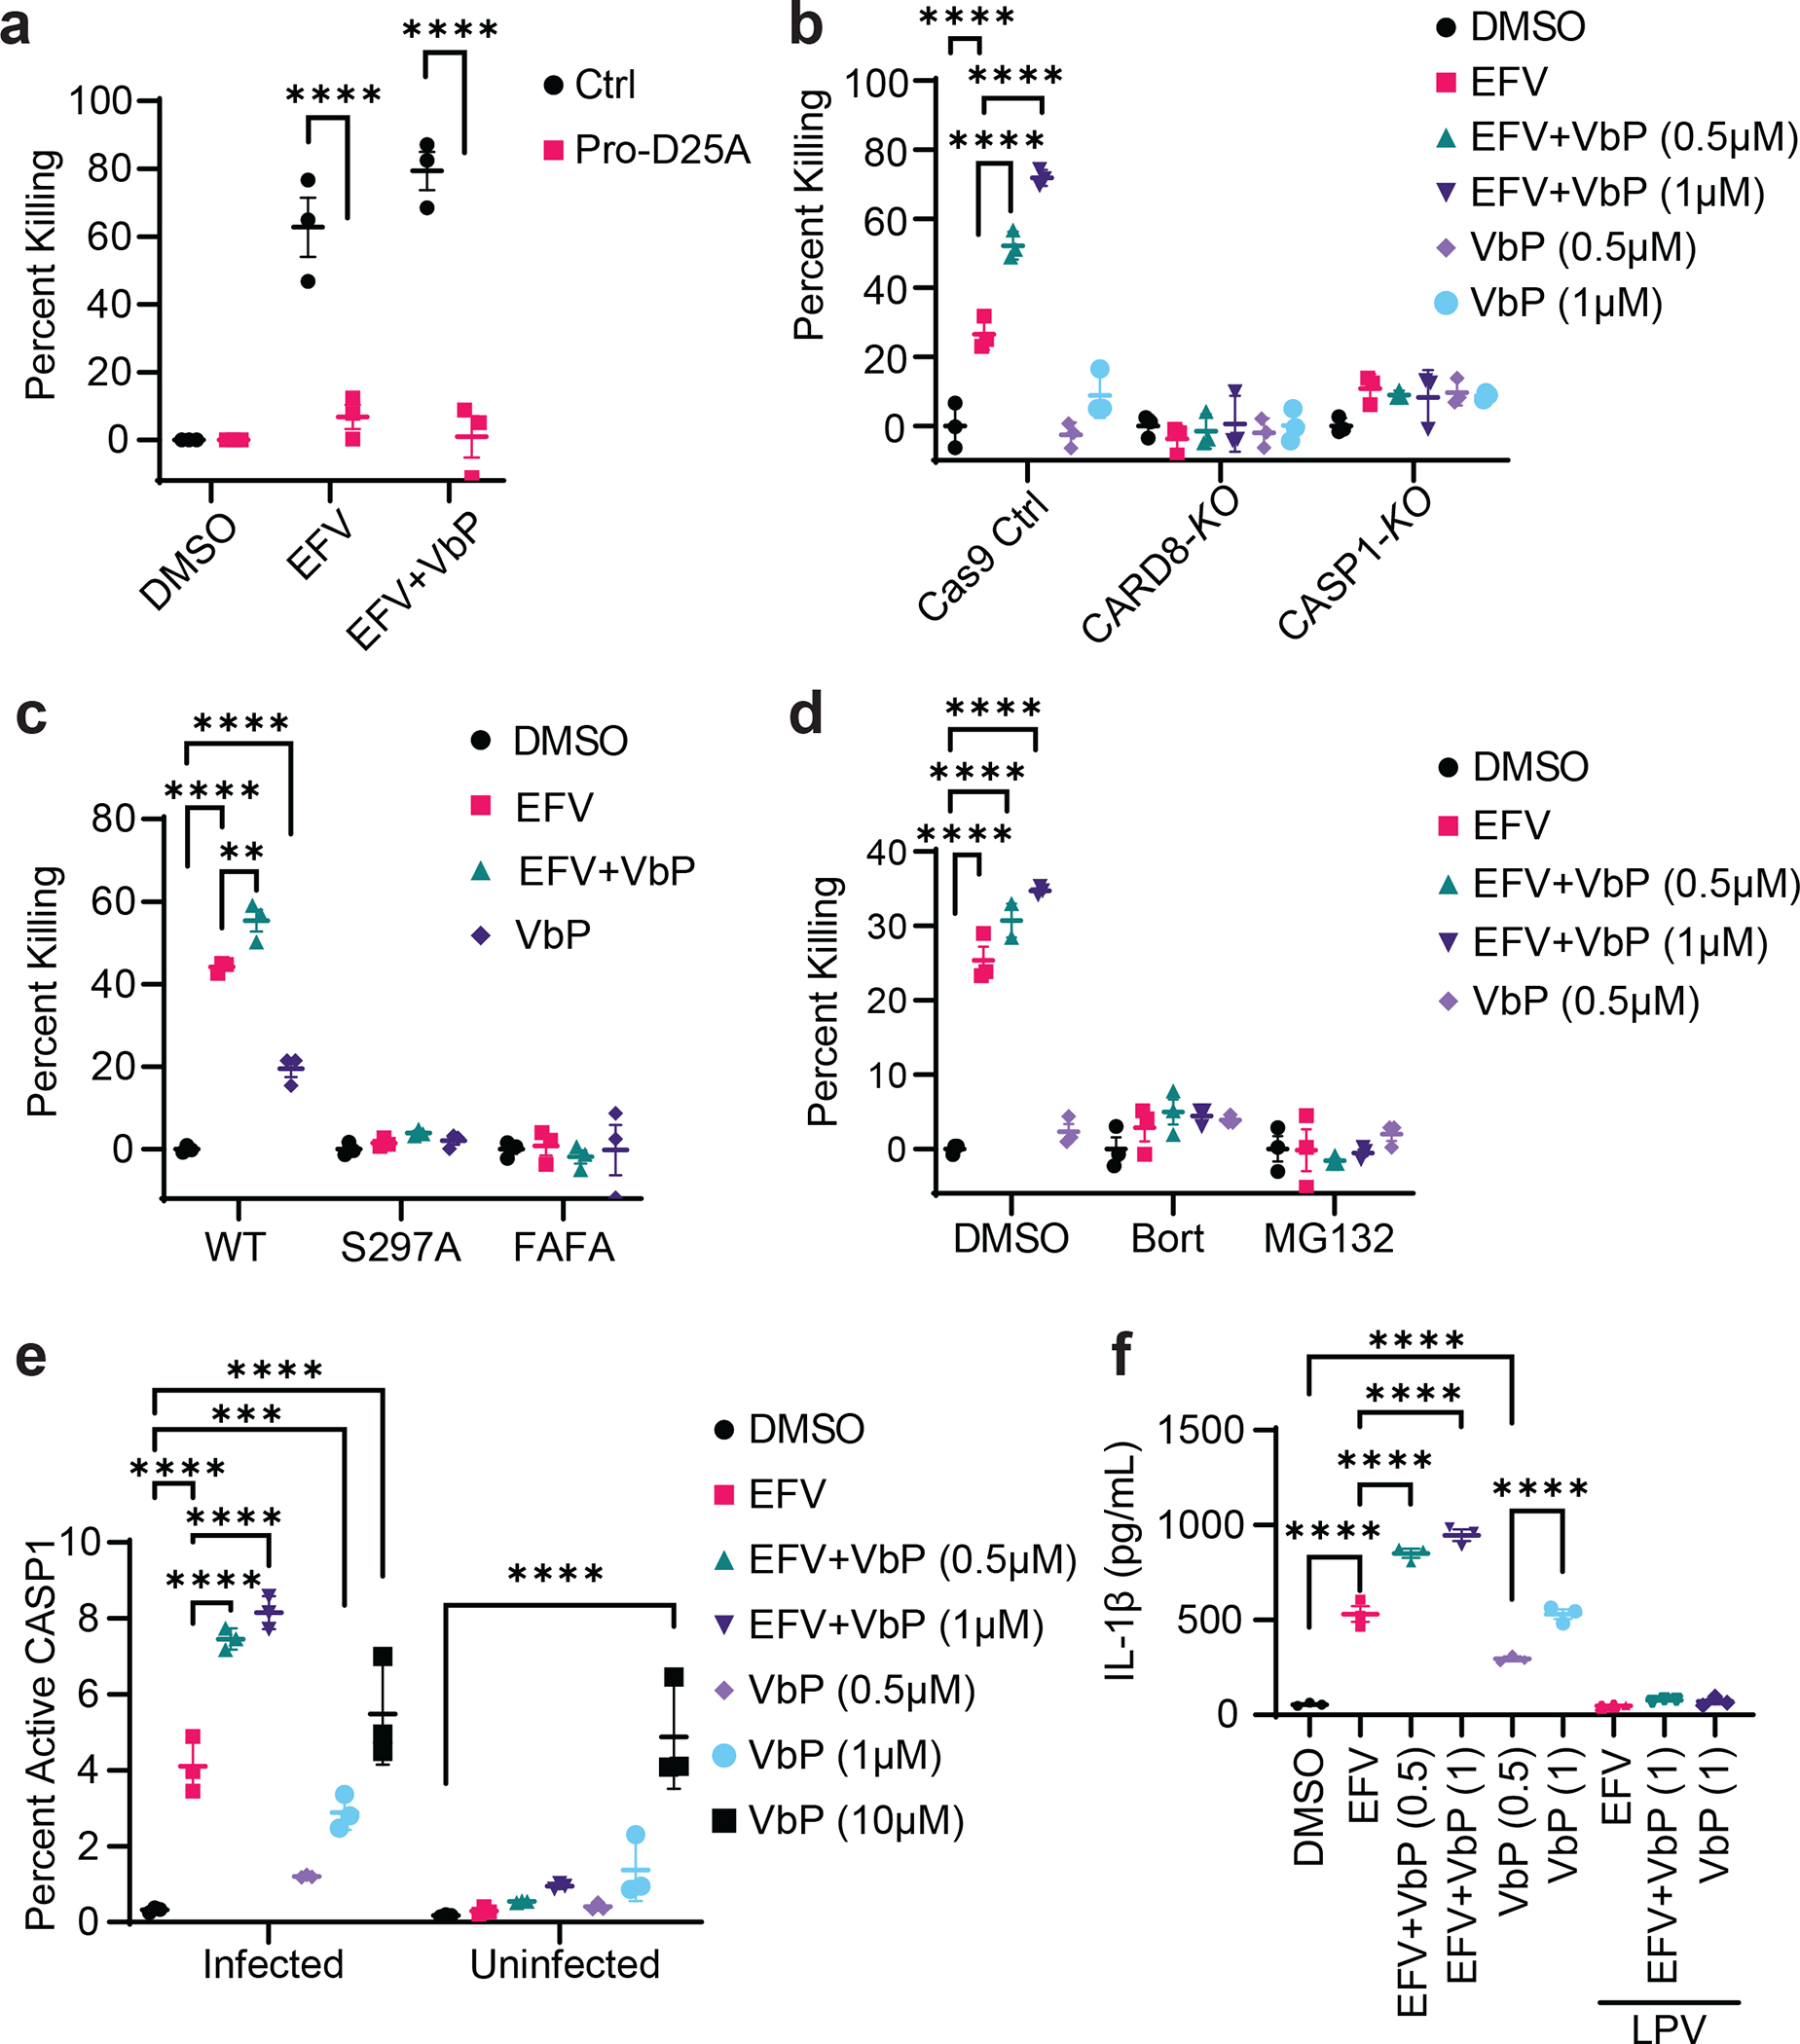
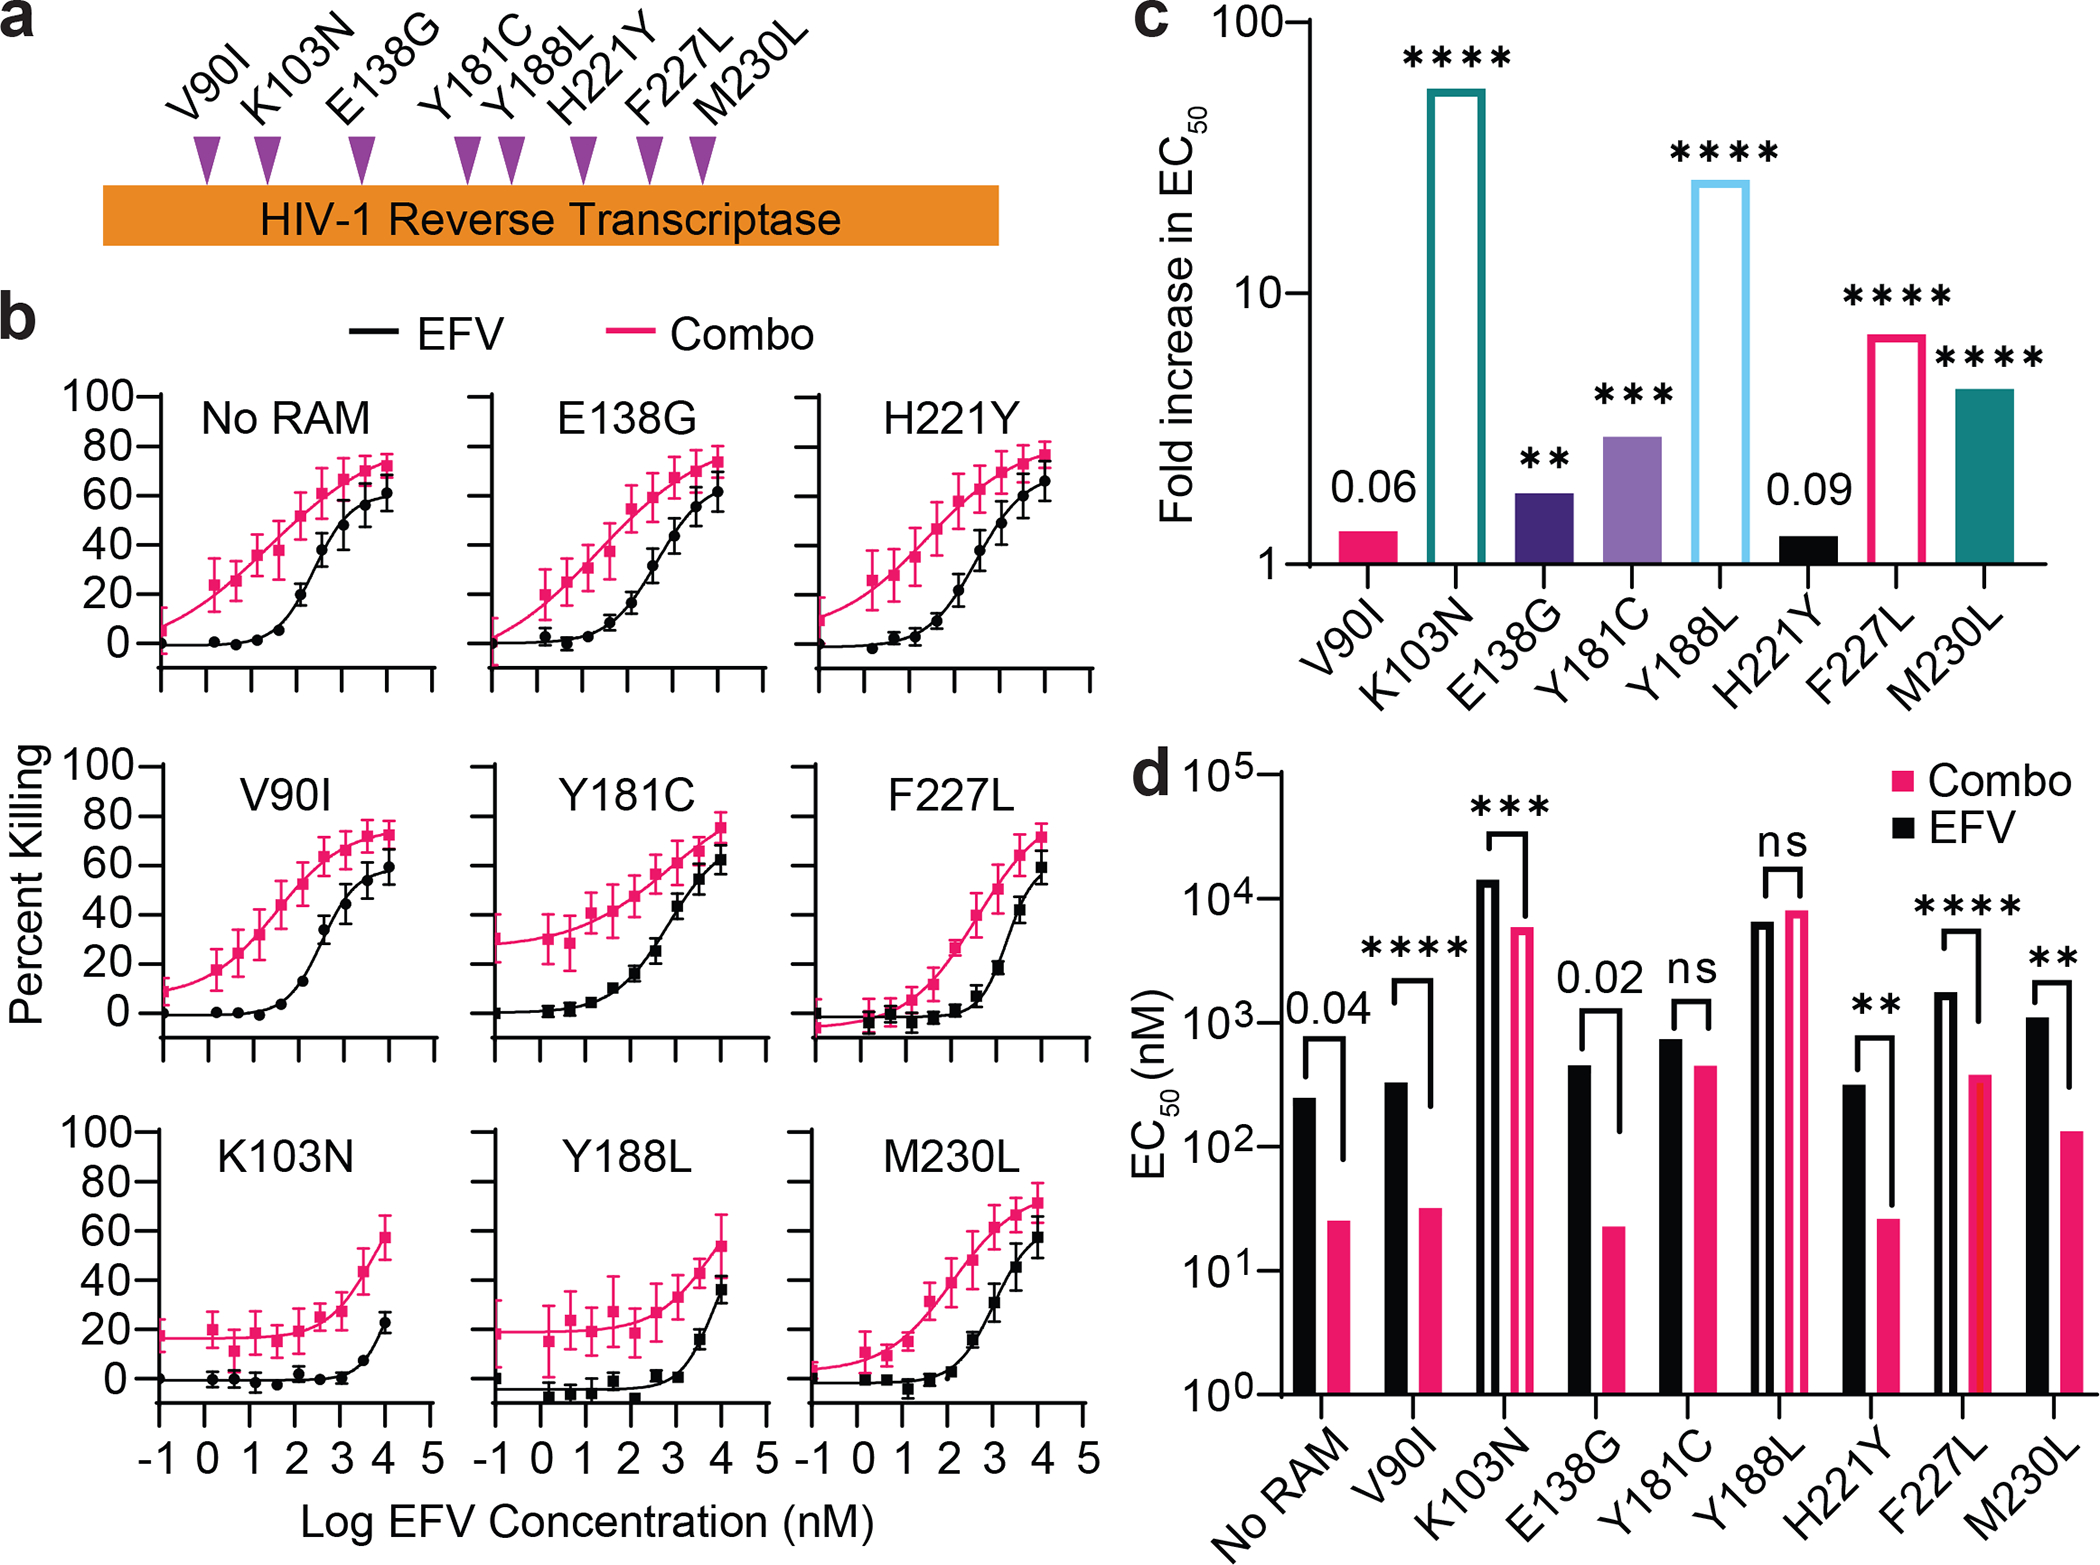
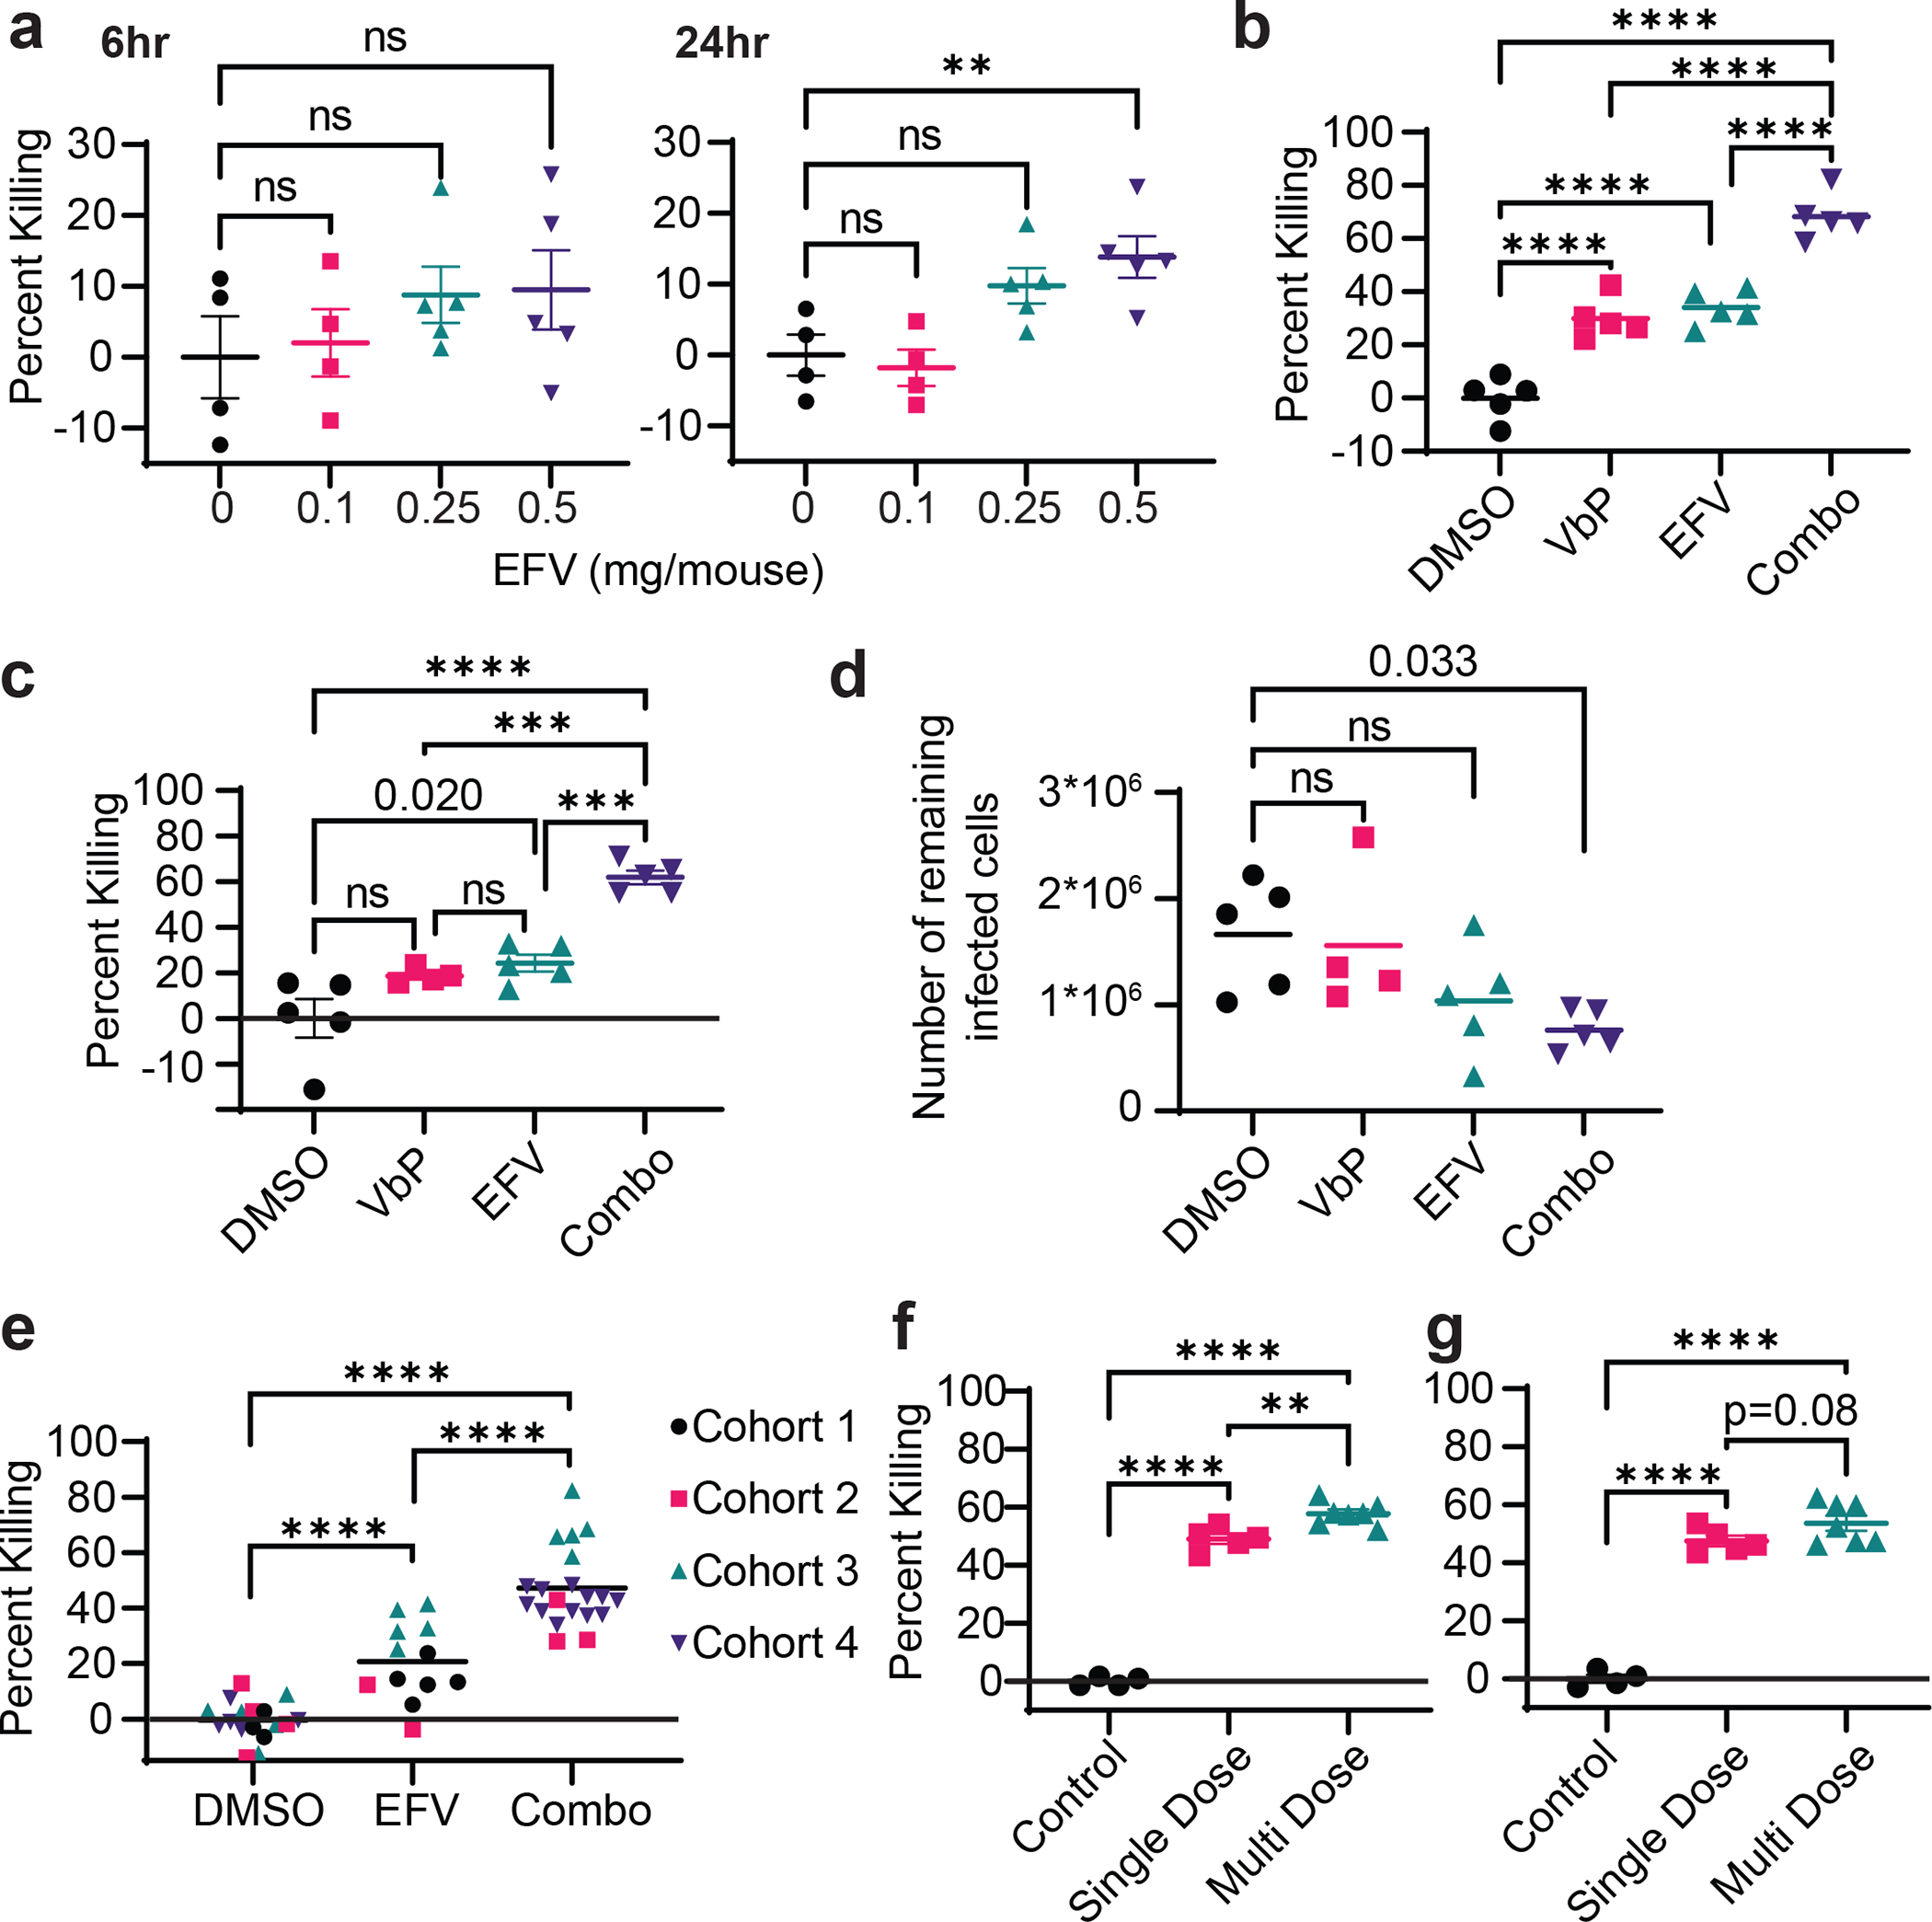
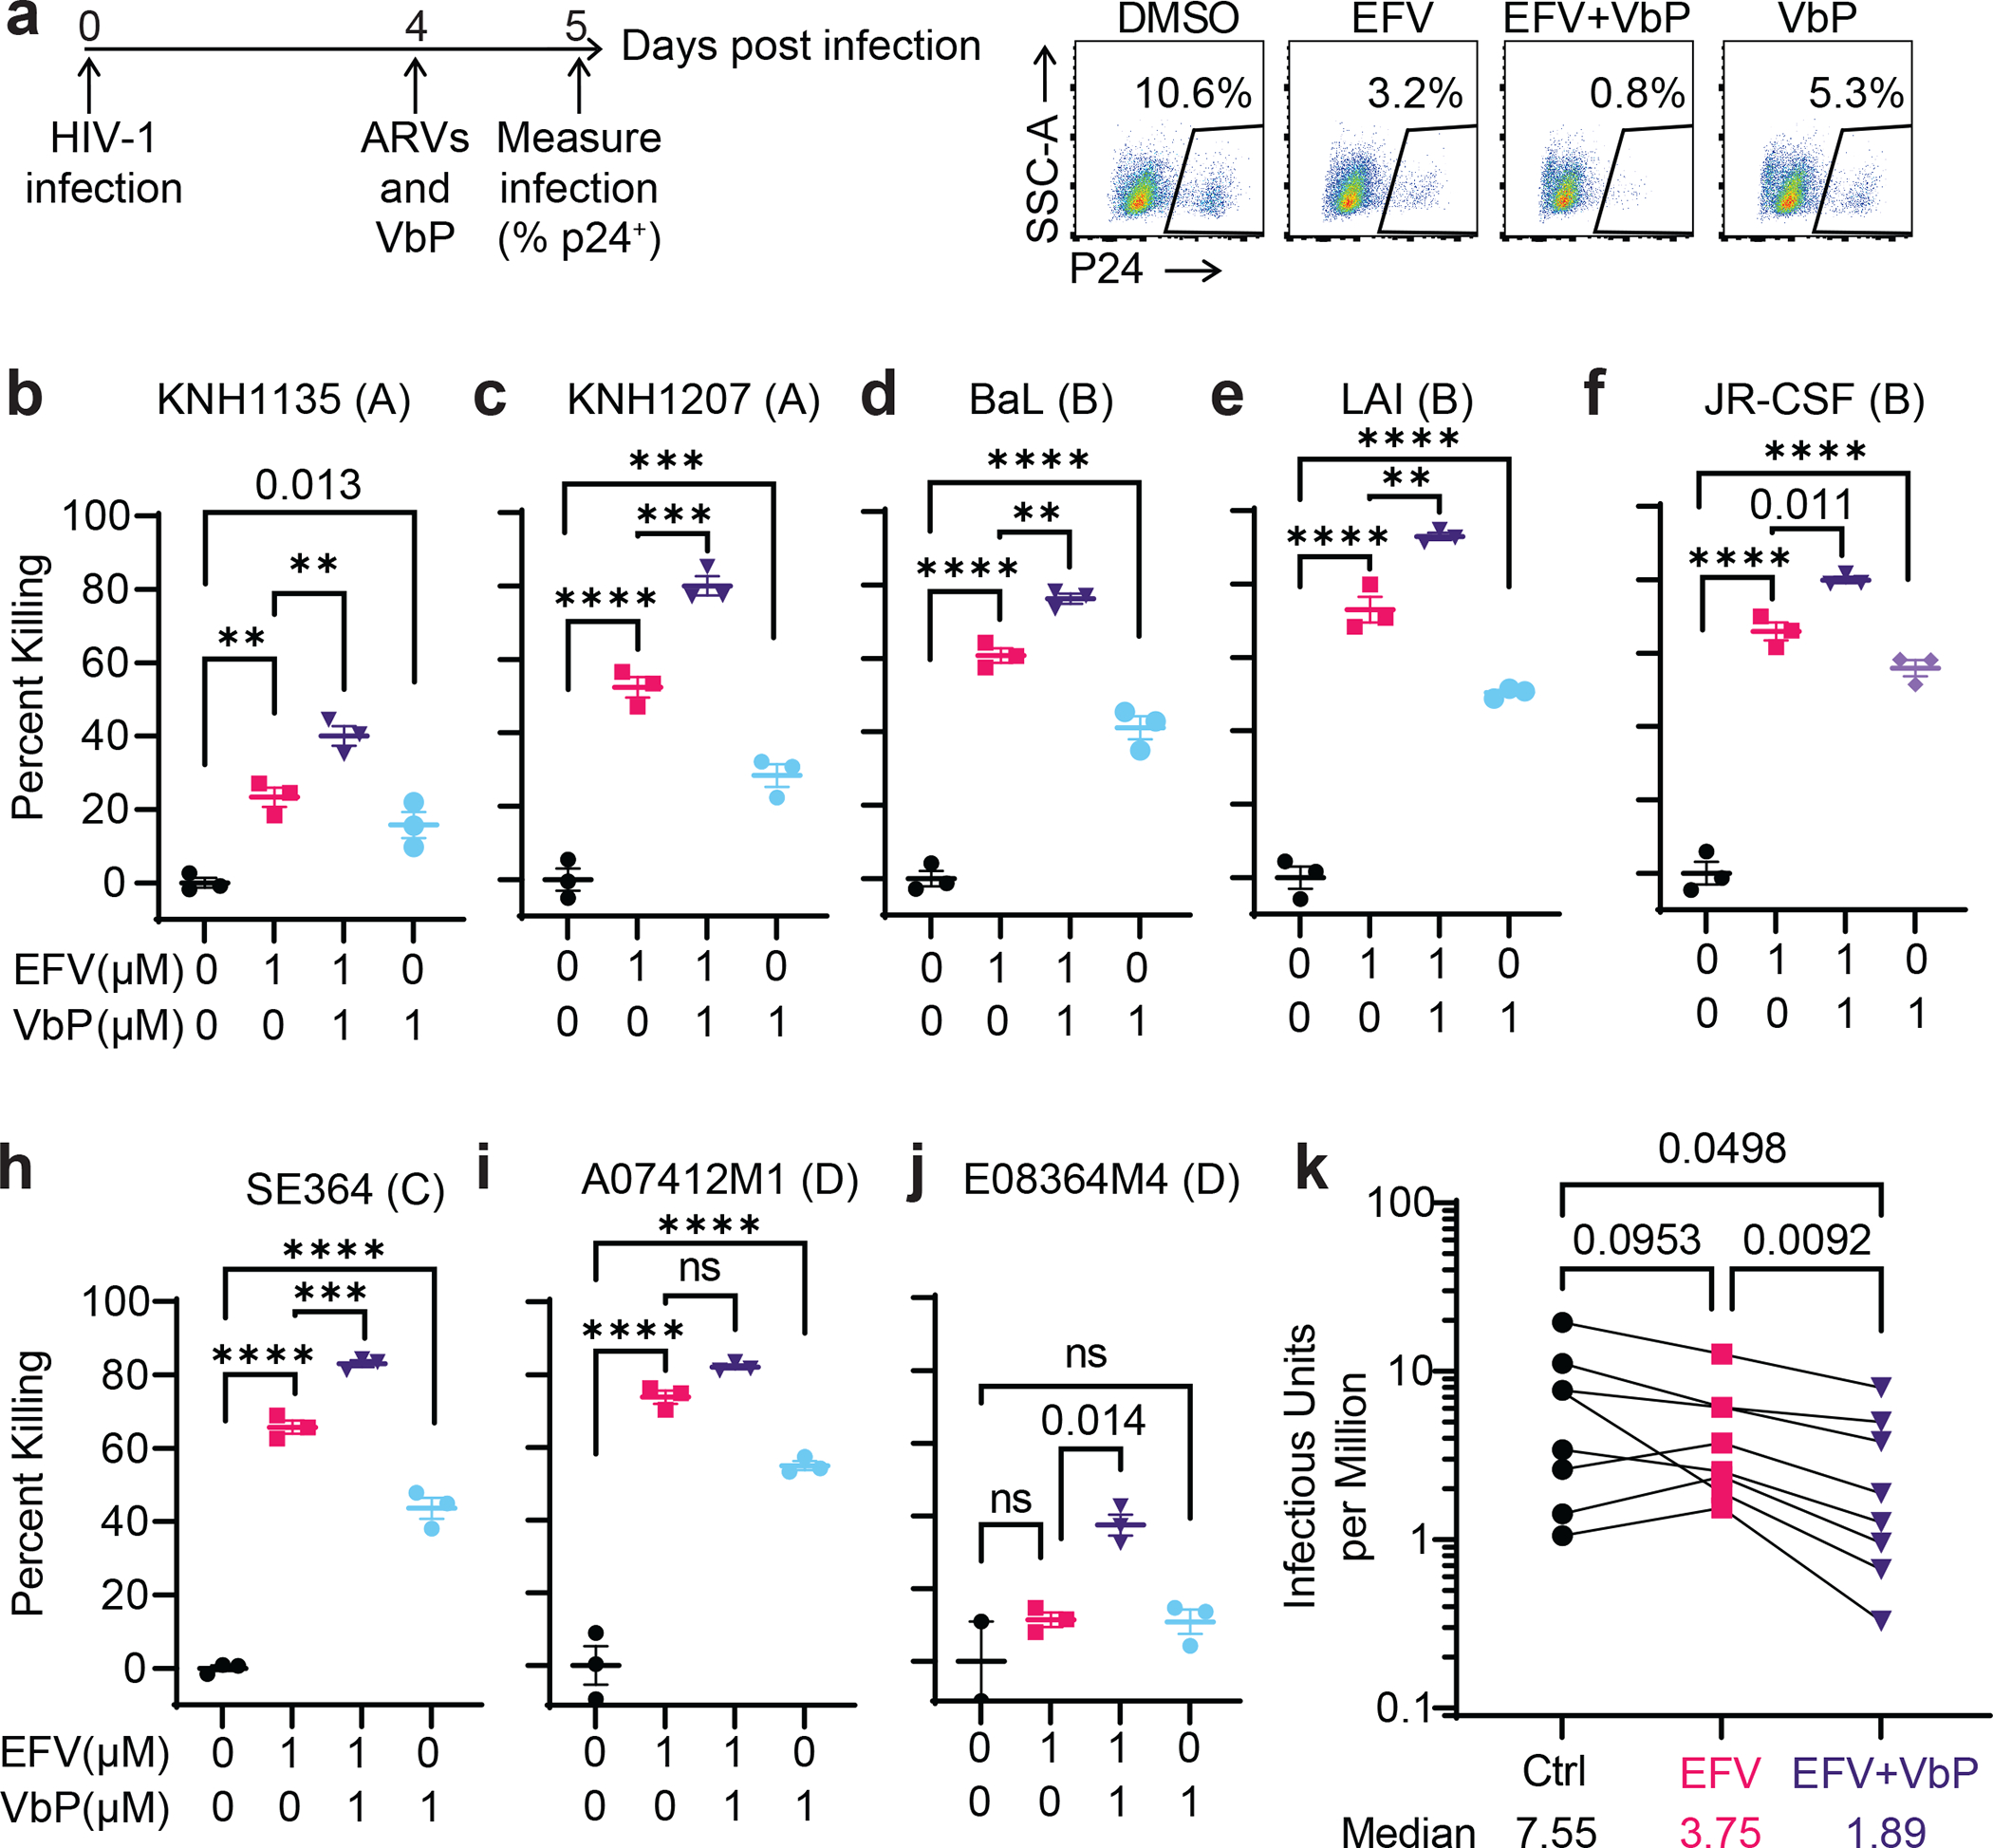
Non-nucleoside reverse transcriptase inhibitors (NNRTIs) induce pyroptosis of HIV-1-infected CD4+ T cells through induction of intracellular HIV-1 protease activity, which activates the CARD8 inflammasome. Because high concentrations of NNRTIs are required for efficient elimination of HIV-1-infected cells, it is important to elucidate ways to sensitize the CARD8 inflammasome to NNRTI-induced activation. We show that this sensitization can be achieved through chemical inhibition of the CARD8 negative regulator DPP9. The DPP9 inhibitor Val-boroPro (VbP) can kill HIV-1-infected cells without the presence of NNRTIs and act synergistically with NNRTIs to promote clearance of HIV-1-infected cells in vitro and in humanized mice. More importantly, VbP is able to enhance clearance of residual HIV-1 in CD4+ T cells isolated from people living with HIV (PLWH). We also show that VbP can partially overcome NNRTI resistance. This offers a promising strategy for enhancing NNRTI efficacy in the elimination of HIV-1 reservoirs in PLWH.


Conflict of interest statement

Competing interests

The authors declare no competing interests.

Figures

Extended Data Fig. 1:
Extended Data Fig. 1:. Cell killing measurement
a, Scheme of the killing assays for single-round HIV-1 reporter viruses. Primary CD4+ T cells were infected with HIV-1 reporter viruses for 3 days before NNRTI treatment for 2 days. b, c, Representative flow cytometry plots are shown for one replicate of one donor. Percent killing is calculated as the percent infection of the treatment condition divided by the percent infection of DMSO control. Percent infection was determined by GFP (b) or intracellular p24 (c). d, Percent killing calculated from c. Unpaired two-sided t test. **** p<0.0001. Error bars show mean values with SEM (n=3). e, The log fold increase in EC50 calculated from the treatment of three donors of CD4+ T cells with EFV, RPV, and ETR with or without the presence of 50% human serum (HS) in the culture media. Data from Figure 1f–h were used.
Extended Data Fig. 2:
Extended Data Fig. 2:. DPP9 inhibition enhances NNRTI-mediated killing in THP-1 cells
a, Two shRNA constructs delivered by lentiviral vectors for knockdown of DPP9 are onfirmed by immunoblotting. b, Killing of HIV-1-infected THP-1 cells by RPV. THP-1 cells were transduced with lentiviruses carrying DPP9-specific or scramble shRNA. Two-way ANOVA with Dunnett’s multiple comparison test (n=3). c, Killing of HIV infected THP-1 cells treated for two days with DMSO, EFV, 1g244, or combination (n=3). One-way ANOVA with Tukey’s multiple comparison test. * p<0.05 and **** p<0.0001. Error bars show mean values with SEM. d, Log fold changes in EC50 due to VbP. e, Combination treatment denotes a synergistic relationship as evidenced by Loewe’s additivity model calculated with SynergyFinder2.0. Areas in red denote increased synergy. In (d, e), data from Fig 2b were used for the analysis.
Extended Data Fig. 3:
Extended Data Fig. 3:. CARD8 inflammasome activation is dependent on Gag-Pol expression
a, Representative flow cytometry plots of CARD8-KO or Cas9 control THP-1 cells treated with DMSO, EFV (3μM), VbP (1μM), or combination. Heatmap plots are colored according to mean fluorescent intensity (MFI) of GFP with higher MFI colored in red and lower MFI in green. b, Mean fluorescent intensity of three replicates from (a). Two-way ANOVA with Dunnett’s multiple comparison test. c, Frequency of HIV-1 DNA+ cells measured by qPCR. CARD8-KO or Cas9 control THP-1 cells were infected with HIV-1 for 3 days and treated with DMSO, EFV (3μM), VbP (1μM), or combination for 2 days. HIV-1 gag levels were normalized to POLR2A to determine the frequency of HIV-1 DNA+ cells. The frequency in the treatment groups was measured as the percent of the DMSO control (n=3). Two-way ANOVA with Tukey’s multiple comparison test. * p<0.05, ** p<0.01, and **** p<0.0001. Error bars show mean values with SEM.
Extended Data Fig. 4:
Extended Data Fig. 4:. VbP cytotoxicity is CARD8 and HIV-1 specific
a, VbP cytotoxicity. THP-1 cells were treated for two days with EFV with or without VbP. Cell viability was determined by the MTS assay denoted by the heatmap. b, VbP toxicity is CARD8 dependent. CARD8-KO and Cas9 control THP-1 cells were treated with VbP for 4 days. Cell viability was determined by the MTS assay. Two-way ANOVA with Dunnett’s multiple comparison test. c, d, VbP killing of THP-1 cells is HIV-1 and CARD8 dependent. CARD8-KO or Cas9 control THP-1 cells were infected with HIV-1 reporter viruses. On day 3 post infection, GFP+ and GFP cells were purified by sorting before treatment with DMSO, EFV (3μM), VbP (1μM), or combination for 2 days. In c, representative flow cytometry plots of live dead staining. In (d), percent live cells normalized to DMSO control for Cas9 control (top) and CARD8-KO (bottom). One-way ANOVA with Tukey’s multiple comparison test. e, f, Time course of live/dead staining of CD4+ T cells treated with DMSO, EFV (3μM), VbP, or combinations. Primary CD4+ T cells were co-stimulated with CD3 and CD28 antibodies for 3 days before EFV and VbP treatment. Percent live were normalized to DMSO control. In (e), representative FACS plots for the 48hr time point. Error bars show mean values with SEM (n=3). * p<0.05, *** p<0.001, and **** p<0.0001.
Extended Data Fig. 5:
Extended Data Fig. 5:. VbP sensitizes the CARD8 inflammasome to HIV-1
a, VbP overcomes reduced RPV killing efficacy by human serum. Dose response curves for killing of HIV-1-infected CD4+ T cells treated with RPV or combo (VbP 1μM) with or without the presence of 50% human serum. Zero values of RPV were plotted at 0.1nM to allow for log transformation. Error bars show mean values with SEM (n=3). b-e, Time course treatment of three donors of HIV-1 infected primary CD4+ T cells (b, c) or THP-1 cells (d, e). Cells were treated with DMSO, EFV (0.5μM), VbP (1μM), or combo. Fold change enhancement of combination treatment in comparison to EFV alone treatment was shown in (c) and (e).
Extended Data Fig. 6:
Extended Data Fig. 6:. Characterization of VbP enhancement of CARD8 activation
a, VbP enhancement and killing is HIV-1 protease dependent. Percent killing of HIV-1-infected THP-1 cells treated for two days with DMSO, EFV, VbP, or combination with or without protease inhibitor LPV (1μM). One-way ANOVA with Tukey’s multiple comparison test. Error bars show mean values with SEM (n=3). b, CARD8 cleavage in transfected HEK293T cells. HEK293T cells were co-transfected with a CARD8-expressing plasmid and the HIV-1 plasmid pNL4-3-GFP with the presence of indicated drugs. EFV: 3μM. VbP: 1μM. LPV: 1μM. Cell lysates were collected 24hrs post transfection for western blot analysis. This experiment was repeated an additional two times and provided similar results. c, CARD8 cleavage in HIV-1-infected MT4 cells. MT4 cells were stably transduced with lentiviral vectors expressing WT or FAFA CARD8. Cells were infected for three days prior to treatment with DMSO, EFV (3μM), VbP (1μM), or EFV and VbP combination in the presence of a proteasome inhibitor MG132 (5μM) to block degradation of the neo-C-fragment. Cell lysates were collected six hours post treatment for western blot analysis. This experiment was repeated an additional two times and provided similar results. d, Percent killing of CARD8-KO THP-1 cells replete with Dox-inducible CARD8 constructs for WT, S297A, or FAFA. Conditions shown were treated as in Fig 3E but were not dox induced. One-way ANOVA with Dunnett’s multiple comparison test. **** p<0.0001.
Extended Data Fig. 7:
Extended Data Fig. 7:. VbP enhancement and killing is Caspase 8 independent
a, Two sgRNA constructs for knockout of Caspase 8 are confirmed by immunoblotting. b, Percent killing of Cas9 Control, Casp8-KO, or CARD8-KO THP-1 cells infected with HIV-1 reporter viruses. Infected cells were treated with EFV (3μM) with or without VbP for two days. Two-way ANOVA with Dunnett’s multiple comparison test. Error bars show mean values with SEM (n=3). **** p<0.0001.
Extended Data Fig. 8:
Extended Data Fig. 8:. Killing of cells infected with NNRTI RAMs by VbP
Primary CD4+ T cells were infected with HIV-1 reporter viruses carrying various NNRTI RAMs for 3 days before treatment with 1μM VbP for two days. Error bars show mean values with SEM (n=3). One-way ANOVA with Dunnett’s multiple comparison test. ** p<0.01 and **** p<0.0001.
Extended Data Fig. 9:
Extended Data Fig. 9:. Combination treatment effects in vivo
Primary CD4+ T cells were infected with the HIV-1 reporter virus NL4-3-Pol. Three days post infection, these cells were transfused into mice (5–10 million cells per mouse). EFV and VbP were provided by IV injection immediately after cell infusion. Remaining infected cells were measured by flow cytometry. a, Representative flow cytometry plots measuring remaining infected CD4+ T cells in blood 6hrs post treatment. b, c, blood samples were collected 6hrs and 24hr post EFV and VbP treatment (n=4) or control (n=3). d, Lung tissues were collected 24 hrs post EFV and VbP treatment. Two-way ANOVA with Sidak’s multiple hypothesis test. e, f, Comparison of killing between IV and IP injection of EFV and VbP. Blood samples were collected 6hrs and 24hr post EFV and VbP treatment. Two-way ANOVA with Sidak’s multiple hypothesis test. (IV sample sizes are the same as b-d, IP samples sizes are as follows: DMSO = 17, EFV = 12, combination = 20. g, CD4+ T cell counts from lung tissues of mice treated with control (n=5), EFV (n=4), VbP (n=5), or combination (n=5) after 24 hours. Two-way ANOVA with Dunnett’s multiple hypothesis test. h, CD4+ T cell counts from lung tissues from mice with control (n=5), single-dose (n=5), or multi-dose (n=7) combination treatment regimens. Two-way ANOVA with Dunnett’s multiple hypothesis test. Error bars show mean values with SEM. ** p<0.01, **** p<0.0001.
Extended Data Fig. 10:
Extended Data Fig. 10:. DPP9 inhibition enhances clearance of HIV-1 clinical isolates
a, b, CD4+ T cells were infected with HIV-LAI for four days and treated for one day with DMSO, EFV (1μM), VbP (1μM), or combination. In (a), representative flow cytometry plots. Heatmap plots are colored according to mean fluorescent intensity (MFI) of intracellular HIV-p24 (PE) with higher MFI colored in red and lower MFI in green. In (b), Mean fluorescent intensity of three replicates from (a). One-way ANOVA with Dunnett’s multiple hypothesis test. c-h, 1G244 enhances killing of primary CD4+ T cells infected with various HIV-1 clinical isolates. Cells were infected for 4–6 days before treated with DMSO, EFV, 1g244, or combination for one day prior to intracellular HIV-p24 staining. One-way ANOVA with Tukey’s multiple comparisons test. Error bars show mean values with SEM (n=3). * p<0.05, ** p<0.01, ** p<0.001, and **** p<0.0001.
Figure 1:
Figure 1:. NNRTIs induce dose-dependent death of HIV-1-infected cells
a, Representative flow cytometry plots of primary CD4+ T cells treated with 1.11 μM of various NNRTIs. b, Cell killing dose response curves for NNRTIs in successive three-fold dilutions in HIV-1-infected primary CD4+ T cells. Three healthy donor CD4+ T cells isolated from PBMC were included. EC50 values for EFV, RPV, and ETR, are as follows: 266.1 nM, 87.8 nM, and 786.6 nM respectively. NVP and DOR did not provide sufficient killing for EC50 calculation. c, Cell killing dose response curves for HIV-1-infected THP-1 cells treated with NNRTIs as in panel A. EC50 values for EFV, ETR, and RPV are as follows: 787.4 nM, 657.3nM and 443.1 nM. d, Cell killing dose response curves for HIV-1-infected CARD8-KO or Cas9 control THP-1 cells. e, Killing of HIV-1-infected CASP1-KO THP-1 cells. **** = p<.0001. Two-way ANOVA with Sidak’s multiple comparison test. f-h, Dose response curves of EFV, RPV, and ETR treatment with or without 50% human serum (HS). The green highlighted area denotes NNRTI plasma concentration range. EFV: 500–12,000 nM. RPV: 100–500 nM. ETR: 200–1,200 nM. Zero drug concentration values for dose response curves were plotted at 0.1 nM to allow log-transformation. Error bars show mean values with SEM (n=3).
Figure 2:
Figure 2:. DPP9 inhibition sensitizes the CARD8 inflammasome to HIV-1
a, Killing of HIV-1-infected CD4+ T cells by VbP (1μM). CD4+ T cells from eight healthy donors were infected with HIV-1 reporter viruses for 3 days before VbP treatment for 2 days. b, Dose response curves for three donors of CD4+ T cells treated with EFV or RPV in combination with VbP. The green highlighted area denotes NNRTI plasma concentration range. EFV: 500–12,000 nM. RPV: 100–500 nM. Extra sum-of-squares F test. c, Drug toxicity. MTS assays were performed to determine the viability of primary CD4+ T cells at indicated drug concentrations. Results were from three donors of CD4+ T cells. d, EFV dose response curves for CD4+ T cells cultured in the presence of human serum (HS) with or without 1μM VbP. e, Respective log fold changes in the EC50’s from (d) in comparison to EFV alone. Zero drug concentration values for dose response curves were plotted at 0.1 nM to allow log-transformation. In (a) and (d), error bars show mean values with SEM (n=3). * p<0.05 **** p<0.0001.
Figure 3:
Figure 3:. VbP enhancement is CARD8 and HIV-1 protease dependent
a, VbP enhancement and killing is HIV-1 protease dependent. Primary CD4+ T cells infected with NL4-3-Pol with or without the Pro-D25A mutation were treated with DMSO, EFV, or combo. b, NNRTI-based killing and VbP enhancement is specific to the CARD8 inflammasome. CARD8-KO, CASP1-KO, and Cas9 control THP-1 cells were infected with HIV-1 before treatment for two days with DMSO, EFV (3μM), VbP, or combo. Cell killing was determined 48 hrs post drug treatment. c, VbP enhancement and killing is dependent upon HIV-1 protease cleavage of CARD8. CARD8-KO cells replete with dox-inducible constructs for WT CARD8, S297A, or FAFA. Cells were infected and treated with doxycycline for one day before treatment with DMSO, EFV (3μM), VbP (0.5μM), or combo for one day. d, Proteasomal degradation is required for cell killing by NNRTIs and enhancement by VbP. Cells were treated with proteasome inhibitors Bortezomib (5μM) or MG132 (10μM), together with DMSO, EFV (3μM), VbP, or combination. Cell killing was determined 6 hours post treatment. e, CASP1 activation by NNRTIs and VbP. One donor of primary CD4+ T cells were infected and simultaneously treated with EFV (3μM) ± VbP and stained with CASP1 staining dye for 6 hours. f, IL-1β secretion. HIV-1-infected THP-1 cells were stimulated with LPS (20ng/μL) for three hours prior to treatment with DMSO, EFV (3μM), VbP, or combo for 24hrs. LPV (1μM) was included in some groups to block HIV-1 protease activity. Two-way ANOVA with Sidak’s multiple comparison test (a) or Tukey’s multiple comparison test (b-f). Error bars show mean values with SEM (n=3). **** p<0.0001.
Figure 4:
Figure 4:. CARD8 inflammasome sensitization overcomes NNRTI resistance
a, Graphical depiction of the location of NNRTI RAMS. b, Dose response curves for the selected NNRTI RAMs in three donors of CD4+ T cells treated with serial three-fold EFV dilutions with (red) or without (black) the presence of 1μM of VbP. Zero drug concentration values were plotted at 0.1 nM to allow log-transformation. Error bars show mean values with SEM (n=3). c, Fold change in EC50 values of mutant viruses in comparison to non-mutant control. d, EC50 values are shown for all viruses with or without the presence of VbP. In (c) and (d), hollow bars indicate EC50 values that were extrapolated due to inefficient killing by these mutants that lead to the lack of an ECmax. Significance was calculated using extra sum-of-squares F test. * p<0.05, ** p<0.01, *** p<0.001, **** p<0.0001.
Figure 5:
Figure 5:. VbP Enhances Clearance of HIV-1-infected cells in mice
Primary CD4+ T cells were infected with NL4-3-Pol. Three days post infection, these cells were transfused into mice (5–10 million cells per mouse). EFV and VbP were provided by IP and IV injection, respectively. a, Killing of HIV-1-infected human CD4+ T cells from blood of transfused mice at 6hr and 24hr post treatment with EFV. Mice were either treated with DMSO (n=4 mice) or varying doses of EFV (0.1mg: n=4, 0.25mg: n=5, or 0.5mg: n=5). b-d, Killing of infected human CD4+ T Cells in blood (b) and lung tissues (c and d) at 24hr post treatment with DMSO, 0.5mg EFV, 60 μg VbP, or combo. 4 or 5 mice were used per treatment condition. e, Cross cohort comparison of blood from four independent cohorts of mice treated with DMSO, EFV, or combo as described above. CD4+ T cells from four separate donors were used. f, g, Killing of infected human CD4+ T cells in blood (f) or lung (g) with DMSO control (n=4), single-dose (n=5), or mutli-dose (n=7) combination treatment regimens. The multi-dose regimen group received 0.5 mg EFV injections on days 0, 1, and 2, and 60 μg VbP injections on days 0 and 2. The single-dose regimen received both EFV and VbP only on day 0. Error bars show mean values with SEM. One-way ANOVA with Dunnett’s multiple comparison test (a, d), Tukey’s multiple comparison test (b, c, e, and f), or Holm-Šídák’s multiple comparisons test (g). * p<0.05, ** p<0.01, *** p<0.001, **** p<0.0001.
Figure 6:
Figure 6:. VbP Enhances Clearance of latent HIV-1
a, Scheme of the killing assays (left). Primary CD4+ T cells were infected with clinical isolates for 4–6 days until sufficient infection rate was obtained (p24>2%). Infected cells were then treated for one day with DMSO, EFV (1μM), VbP (1μM), or combo. Representative flow cytometry plots of CD4+ T cells HIV-LAI infected (right). b-j, Killing of primary CD4+ T cells infected with various HIV-1 clinical isolates. Treatment is described in (a). One-way ANOVA with Tukey’s multiple comparison test. k, Clearance of latent HIV-1. Frequency of latent HIV-1 was determined by QVOA. One-way ANOVA with Holm-Šídák’s multiple comparisons test. Error bars in (b-j) show mean values with SEM (n=3). * p<0.05, ** p<0.01, *** p<0.001, **** p<0.0001.

Similar articles

Cited by

References

    1. Gupta RK, et al. HIV-1 remission following CCR5Δ32/Δ32 haematopoietic stem-cell transplantation. Nature 568, 244–248 (2019). - PMC - PubMed
    1. Hütter G, et al. Long-term control of HIV by CCR5 Delta32/Delta32 stem-cell transplantation. N Engl J Med 360, 692–698 (2009). - PubMed
    1. Castro-Gonzalez S, Colomer-Lluch M & Serra-Moreno R Barriers for HIV Cure: The Latent Reservoir. AIDS Res Hum Retroviruses 34, 739–759 (2018). - PMC - PubMed
    1. Finzi D, et al. Identification of a reservoir for HIV-1 in patients on highly active antiretroviral therapy. Science 278, 1295–1300 (1997). - PubMed
    1. Ganor Y, et al. HIV-1 reservoirs in urethral macrophages of patients under suppressive antiretroviral therapy. Nat Microbiol 4, 633–644 (2019). - PubMed

Methods-only References

    1. Rosenbloom D, et al. Designing and interpreting limiting dilution assays: general principles and applications to the latent reservoir for HIV-1. bioRxiv doi: 10.1101/018911. - DOI - PMC - PubMed

Publication types

Substances