. 2022 Nov 10;5(1):1220.
doi: 10.1038/s42003-022-04192-0.

Immune and spermatogenesis-related loci are involved in the development of extreme patterns of male infertility

Affiliations

Immune and spermatogenesis-related loci are involved in the development of extreme patterns of male infertility

Miriam Cerván-Martín et al. Commun Biol. .

Abstract

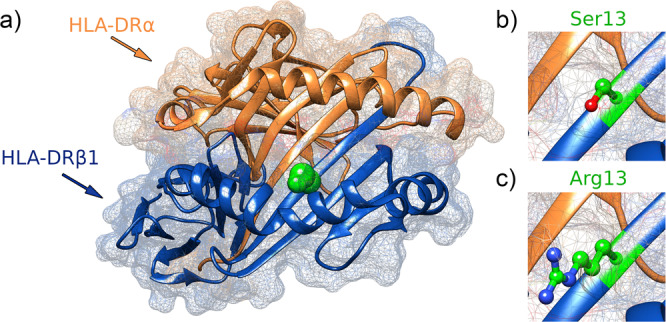
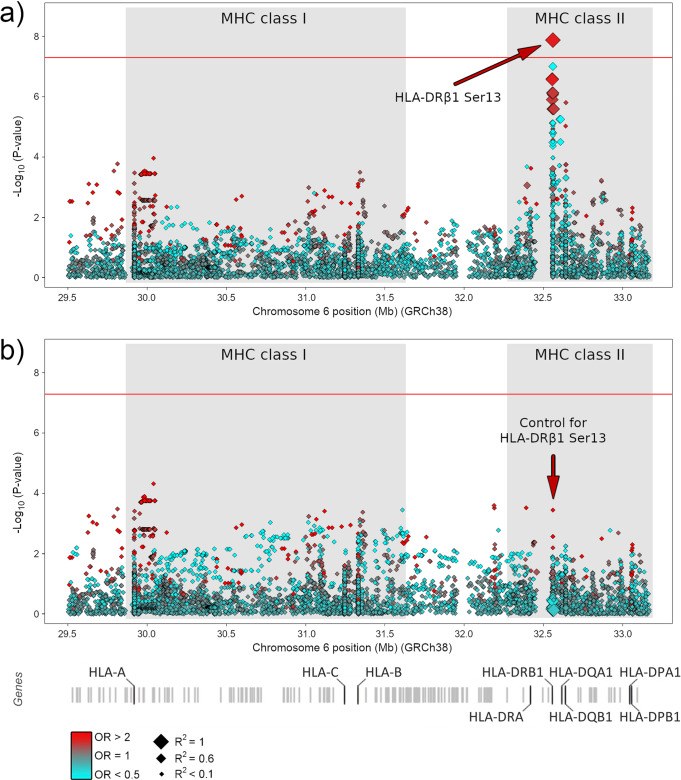
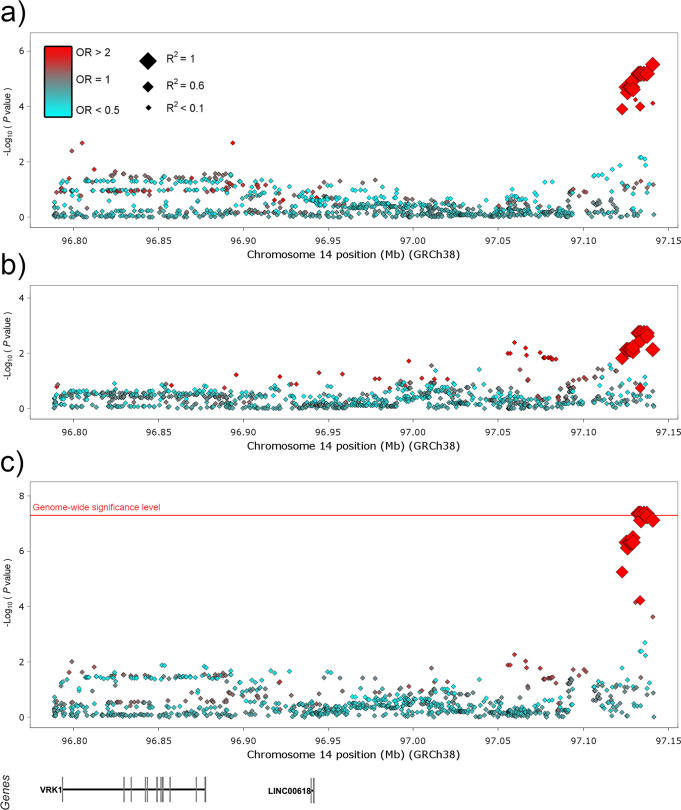
We conducted a genome-wide association study in a large population of infertile men due to unexplained spermatogenic failure (SPGF). More than seven million genetic variants were analysed in 1,274 SPGF cases and 1,951 unaffected controls from two independent European cohorts. Two genomic regions were associated with the most severe histological pattern of SPGF, defined by Sertoli cell-only (SCO) phenotype, namely the MHC class II gene HLA-DRB1 (rs1136759, P = 1.32E-08, OR = 1.80) and an upstream locus of VRK1 (rs115054029, P = 4.24E-08, OR = 3.14), which encodes a protein kinase involved in the regulation of spermatogenesis. The SCO-associated rs1136759 allele (G) determines a serine in the position 13 of the HLA-DRβ1 molecule located in the antigen-binding pocket. Overall, our data support the notion of unexplained SPGF as a complex trait influenced by common variation in the genome, with the SCO phenotype likely representing an immune-mediated condition.


Conflict of interest statement

The authors declare no competing interests.

Figures

Fig. 1
Fig. 1. Ribbon representation of the MHC class II molecule HLA-DR.
The position 13 of the HLA-DRβ1 subunit is highlighted in green (a). A magnified molecular representation of the residues conferring risk (serine) and protection (arginine) to Sertoli cell-only phenotype is also shown (b, c).
Fig. 2
Fig. 2. Manhattan plot representation of the logistic regression test of the MHC region accordingly with Sertoli cell-only phenotype.
a Unconditioned test of the MHC region. b Results of the MHC region after conditioning on HLA-DRβ1 Ser13. The −log10 of the combined logistic regression test P-values are plotted against their physical chromosomal position. A red/blue colour gradient was used to represent the effect size of each analysed variant (red for risk and blue for protection). The red line represents the genome-wide level of significance (P < E−08).
Fig. 3
Fig. 3. Manhattan plot representation of the logistic regression test for the VKR1 region accordingly with Sertoli cell-only phenotype.
Data for the Iberian discovery cohort (a), the German replication cohort (b), and the combined cohort (c) are shown. The −log10 of the P-values from the logistic regression tests and the inverse variance method are plotted against their physical chromosomal position. A red/blue colour gradient was used to represent the effect size of each analysed variant (red for risk and blue for protection). The red line represents the genome-wide level of significance (P < 5E−08).
Fig. 4
Fig. 4. GARFIELD functional enrichment analysis of the GWAS results accordingly with Sertoli cell-only phenotype.
The radial axis represents the enrichment (OR) for each of the analysed cell types that are sorted by tissue along the outside edge of the plot. Boxes forming the edge are coloured by tissue. Enrichment is calculated for the GWAS P-value threshold P <  1E−05. Dots in the inner ring of the outer circle denote significant GARFIELD enrichment after multiple-testing correction for the number of effective annotations and are coloured with respect to the tissue cell type tested (font size of tissue labels reflects the number of cell types from that tissue).

References

    1. Sun H, et al. Global, regional, and national prevalence and disability-adjusted life-years for infertility in 195 countries and territories, 1990–2017: results from a global burden of disease study, 2017. Aging. 2019;11:10952–10991. - PMC - PubMed
    1. Tournaye H, Krausz C, Oates RD. Novel concepts in the aetiology of male reproductive impairment. Lancet Diabetes Endocrinol. 2017;5:544–553. - PubMed
    1. Mascarenhas MN, Flaxman SR, Boerma T, Vanderpoel S, Stevens GA. National, regional, and global trends in infertility prevalence since 1990: a systematic analysis of 277 health surveys. PLoS Med. 2012;9:e1001356. - PMC - PubMed
    1. Krausz C, Riera-Escamilla A. Genetics of male infertility. Nat. Rev. Urol. 2018;15:369–384. - PubMed
    1. Palermo G, et al. Sperm characteristics and outcome of human assisted fertilization by subzonal insemination and intracytoplasmic sperm injection. Fertil. Steril. 1993;59:826–835. - PubMed

Publication types

Substances