. 2023 Feb;60(2):687-731.
doi: 10.1007/s12035-022-03043-7. Epub 2022 Nov 11.

Dorsoventral Arrangement of Lateral Hypothalamus Populations in the Mouse Hypothalamus: a Prosomeric Genoarchitectonic Analysis

Affiliations

Dorsoventral Arrangement of Lateral Hypothalamus Populations in the Mouse Hypothalamus: a Prosomeric Genoarchitectonic Analysis

Carmen Diaz et al. Mol Neurobiol. 2023 Feb.

Abstract

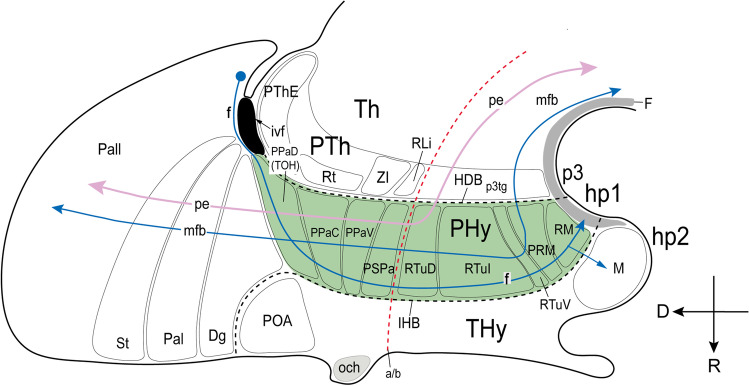
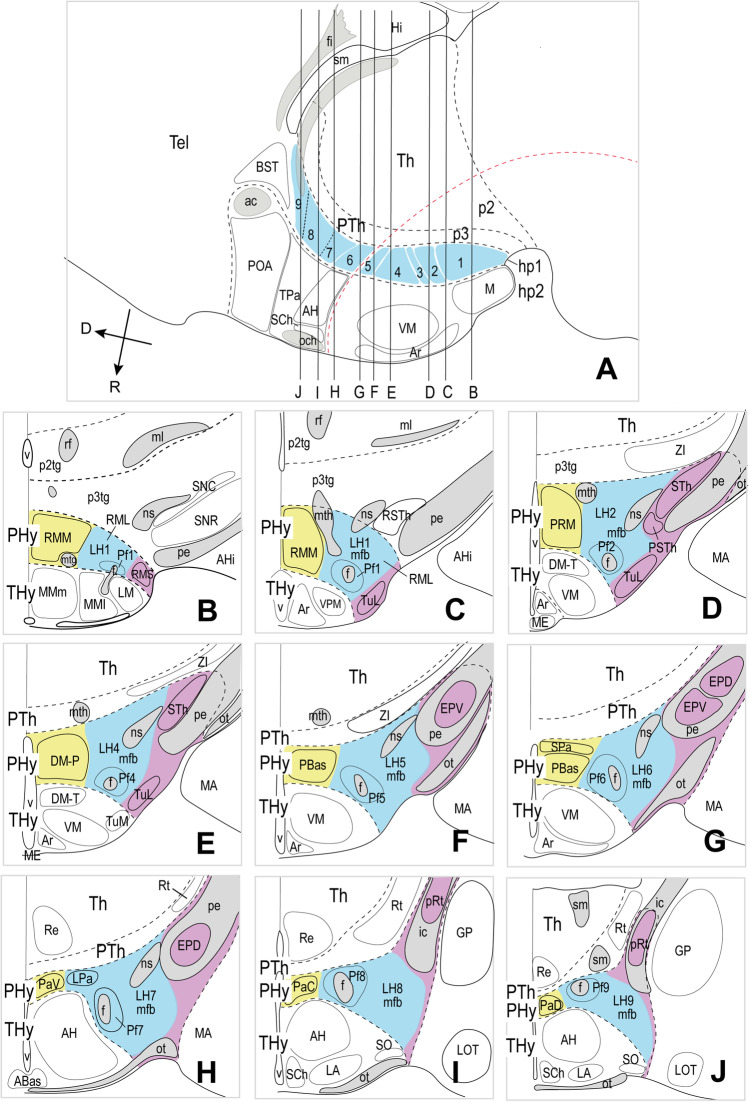
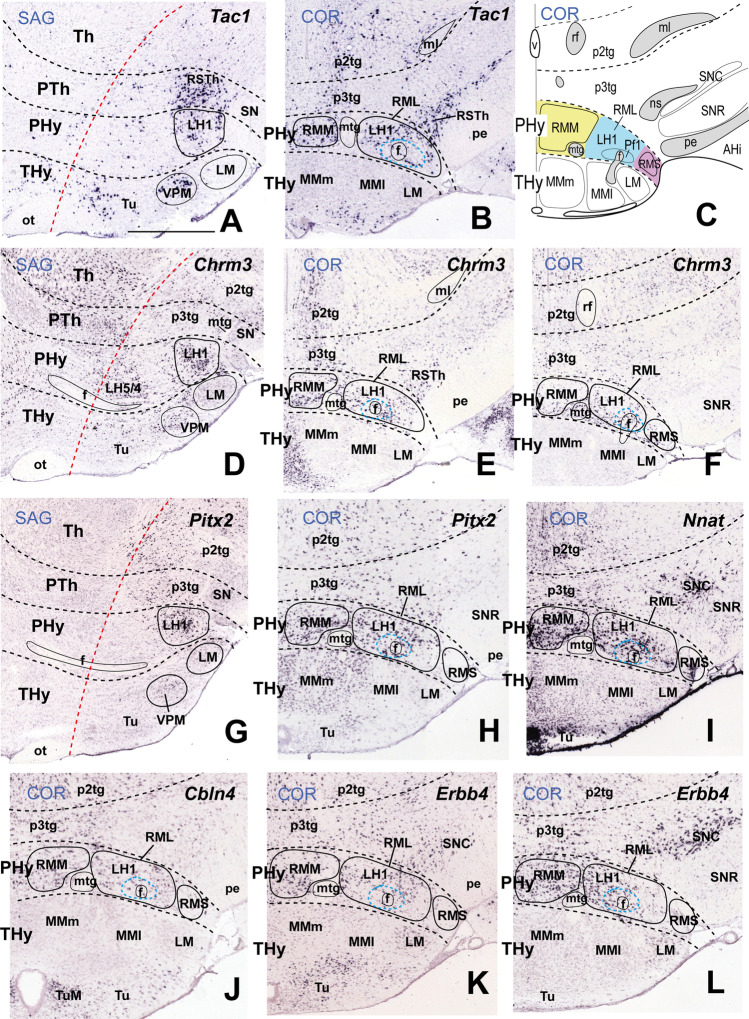
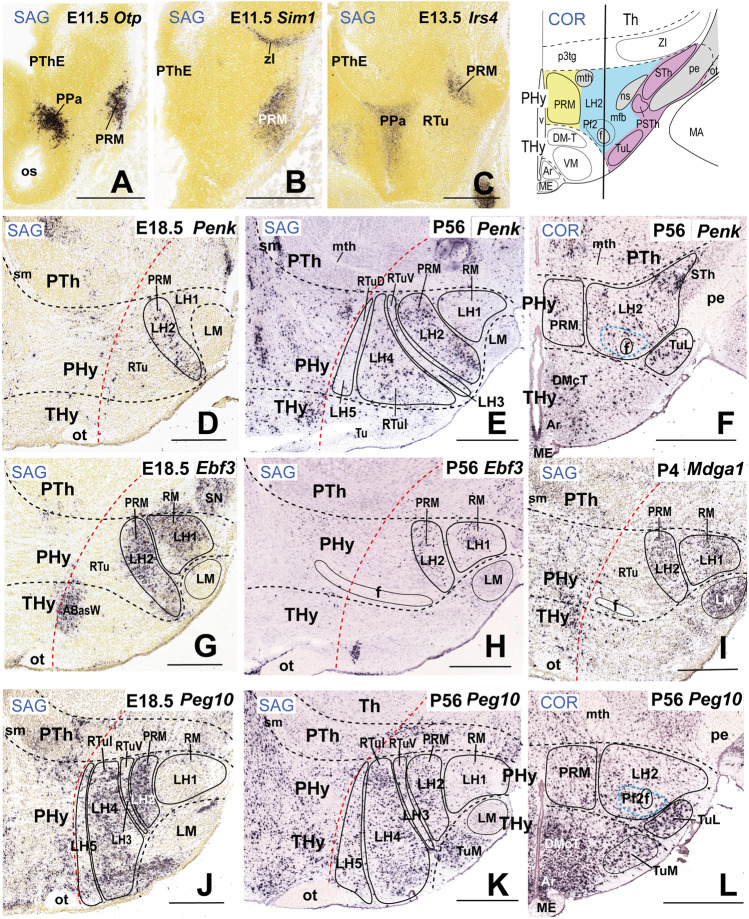
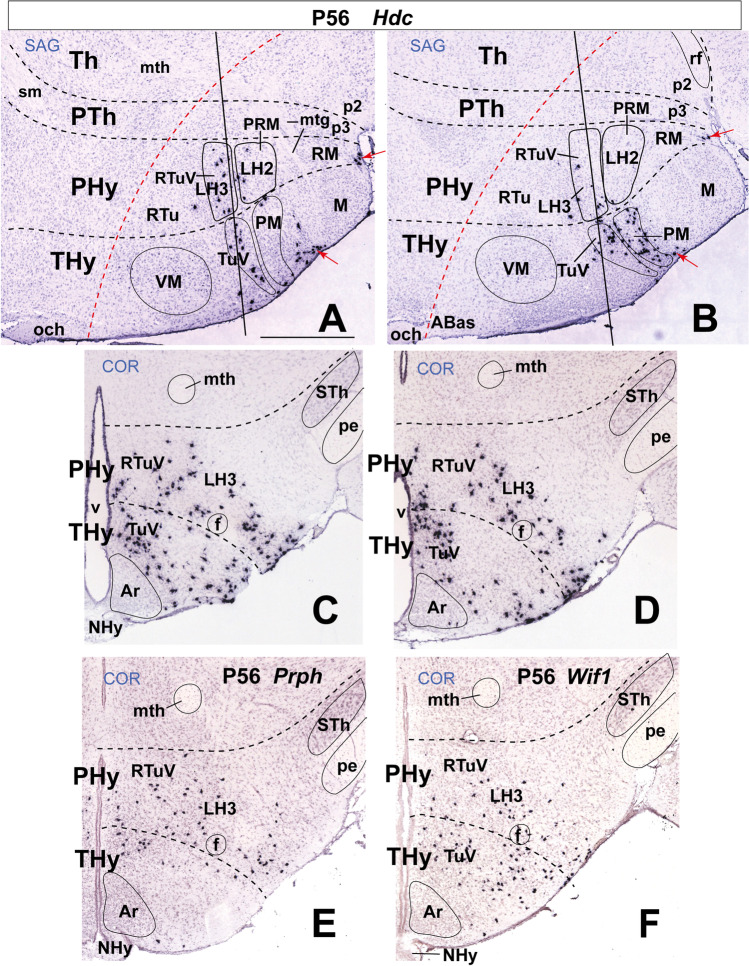
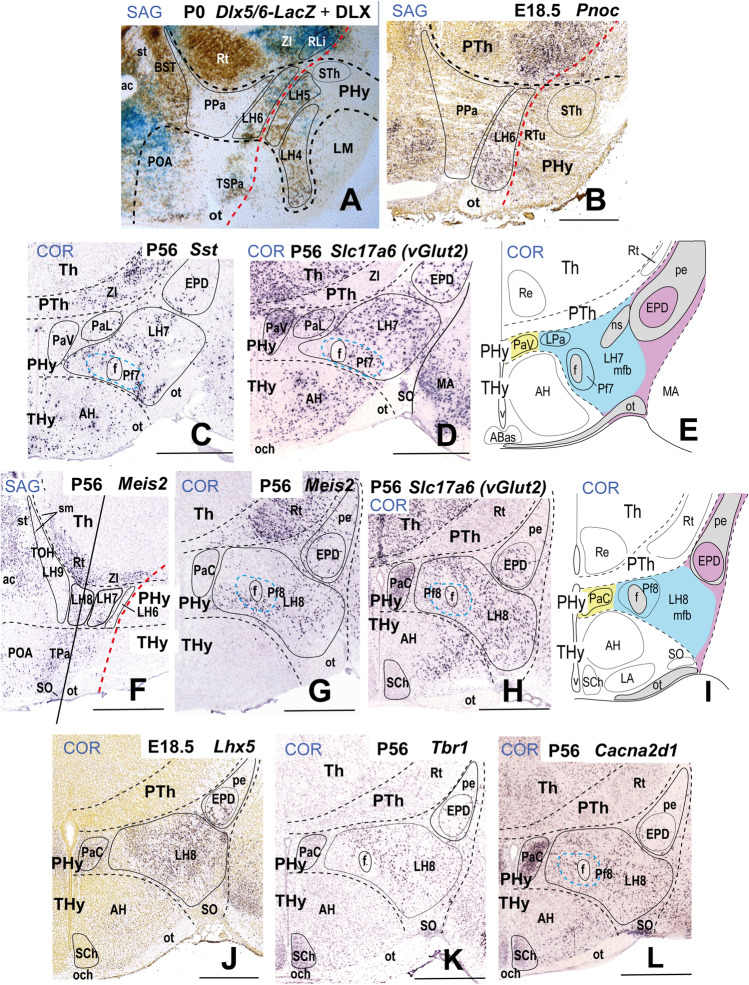
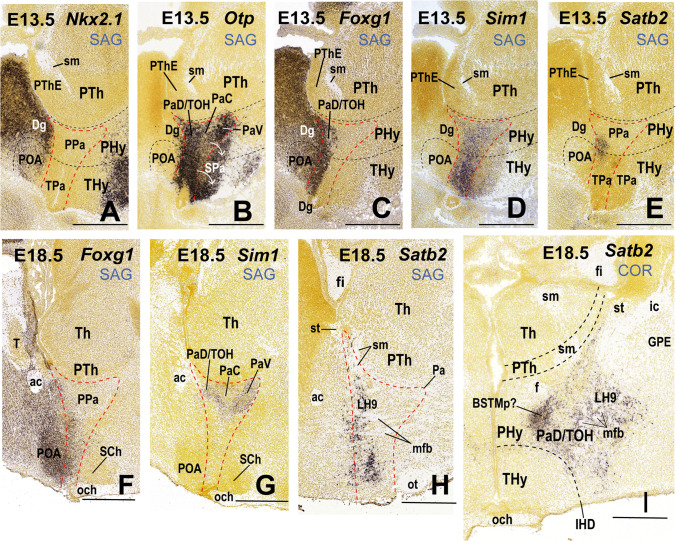
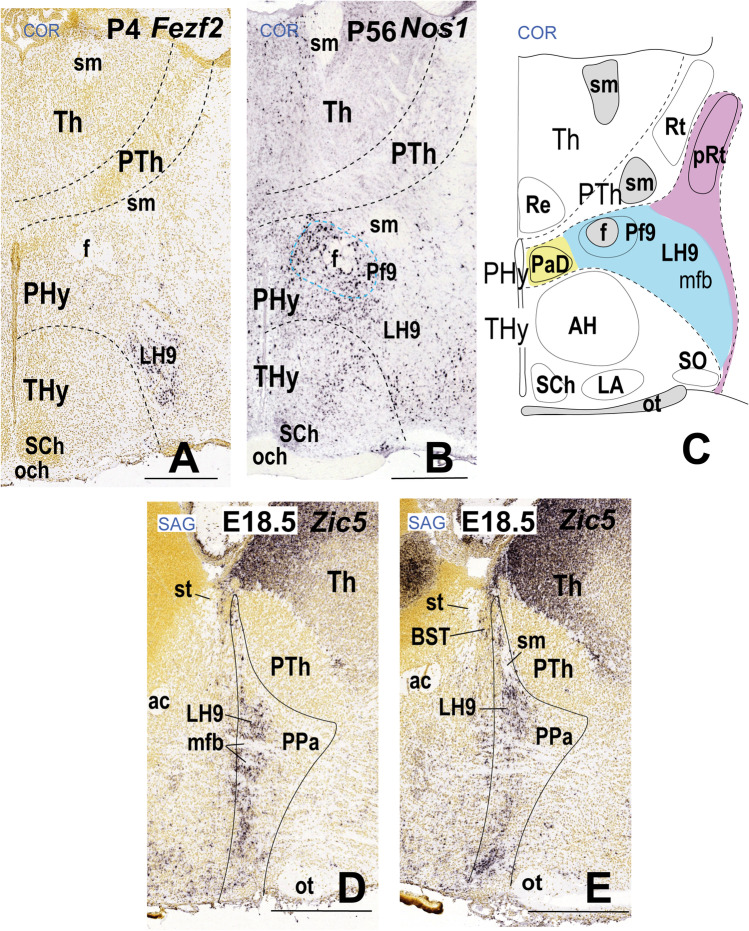
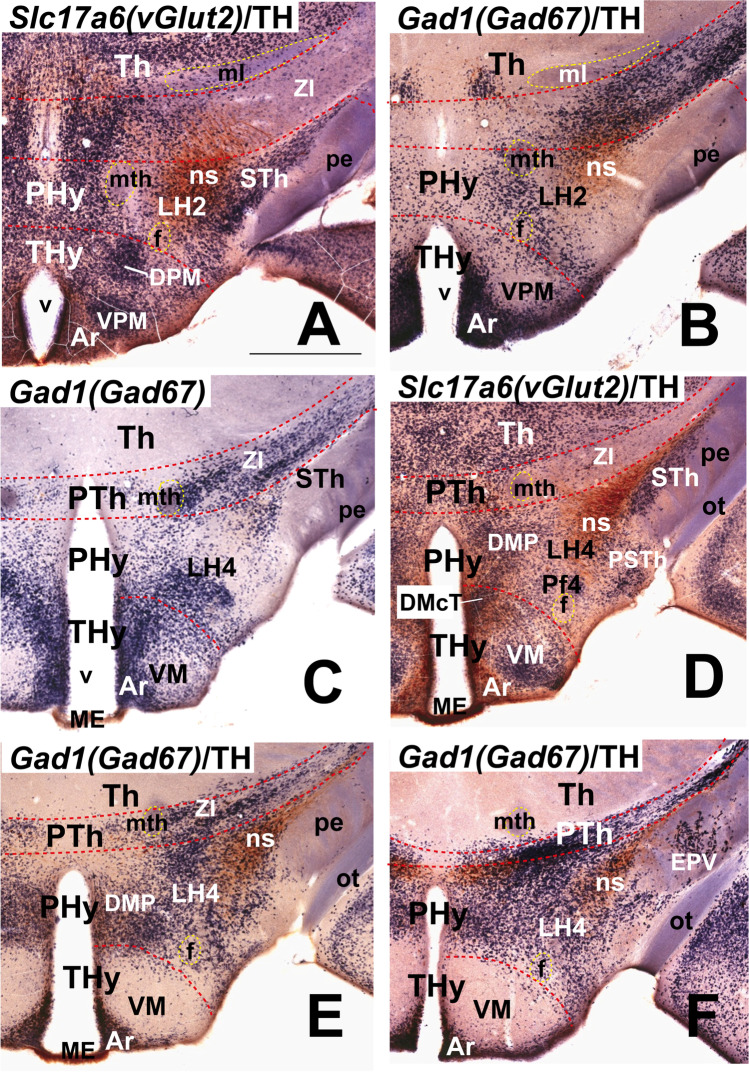
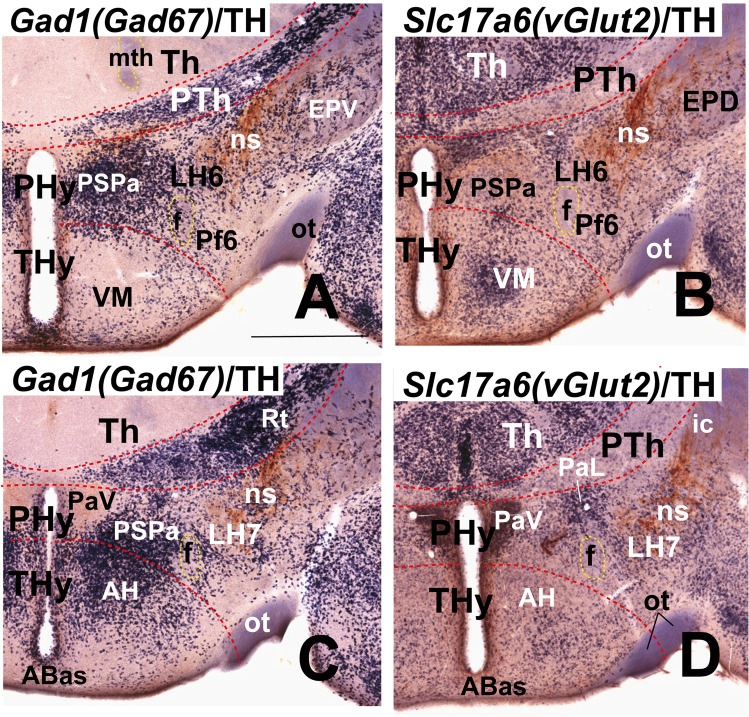
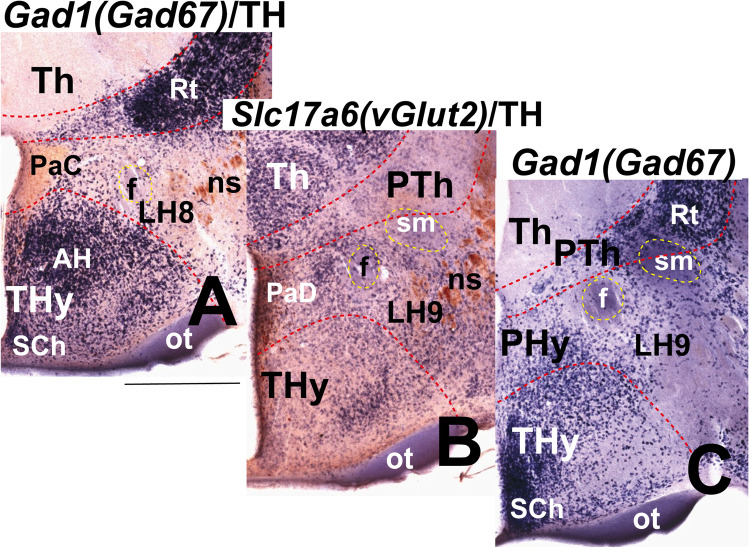
The lateral hypothalamus (LH) has a heterogeneous cytoarchitectonic organization that has not been elucidated in detail. In this work, we analyzed within the framework of the prosomeric model the differential expression pattern of 59 molecular markers along the ventrodorsal dimension of the medial forebrain bundle in the mouse, considering basal and alar plate subregions of the LH. We found five basal (LH1-LH5) and four alar (LH6-LH9) molecularly distinct sectors of the LH with neuronal cell groups that correlate in topography with previously postulated alar and basal hypothalamic progenitor domains. Most peptidergic populations were restricted to one of these LH sectors though some may have dispersed into a neighboring sector. For instance, histaminergic Hdc-positive neurons were mostly contained within the basal LH3, Nts (neurotensin)- and Tac2 (tachykinin 2)-expressing cells lie strictly within LH4, Hcrt (hypocretin/orexin)-positive and Pmch (pro-melanin-concentrating hormone)-positive neurons appeared within separate LH5 subdivisions, Pnoc (prepronociceptin)-expressing cells were mainly restricted to LH6, and Sst (somatostatin)-positive cells were identified within the LH7 sector. The alar LH9 sector, a component of the Foxg1-positive telencephalo-opto-hypothalamic border region, selectively contained Satb2-expressing cells. Published studies of rodent LH subdivisions have not described the observed pattern. Our genoarchitectonic map should aid in systematic approaches to elucidate LH connectivity and function.

Keywords: Genoarchitecture; Patterning; Peduncular hypothalamus; Prosomeres.


Conflict of interest statement

The authors declare no competing interests.

Figures

Fig. 1
Fig. 1
Prosomeric representation of the peduncular hypothalamus (PHy; background in light green) and its relationship with neighboring regions in a schematic sagittal view, following Puelles et al. [17]. The rostral (R) and dorsal (D) spatial directions are indicated. The red dash line indicates the alar/basal limit (a/b). Characteristically, the PHy is traversed dorsoventrally by the medial and lateral forebrain bundles (mfb in blue; lfb or peduncle, pe in pink), as well as by the fornix tract (f in blue). The ascending and descending trajectory of mfb/pe fibers is indicated with arrows. The PHy contacts caudally across the hypothalamic-diencephalic border (HDB) with the diencephalic prosomere p3, representing the prethalamus (PTh). Rostrally, it limits across the intrahypothalamic border (close in front of the fornix tract) with the terminal hypothalamus (IHB; THy). The HDB and IHB boundaries are indicated by black dash lines. The prosomere hp1 is formed jointly by the PHy and the evaginated telencephalon, of which we see subpallial and pallial parts (diagonal area [Dg], pallidum [Pal], striatum [St], pallium [Pall]). The PHy reaches dorsally up to the telencephalic diagonal area domain (Dg). The THy extends into the non-evaginated subpallial preoptic area (POA), representing jointly the prosomere hp2. The PHy is subdivided dorsoventrally in four alar and five basal longitudinal subdomains characterized as molecularly different progenitor areas (Puelles et al. [17]). The alar PHy contains dorsal, central, and ventral peduncular paraventricular (PPa) subregions (PPaD, PPaC, PPaV) as well as an underlying peduncular subparaventricular subdomain (PSPa). The peduncular and terminal parts of PaD have been recently identified as a transitional telencephalo-opto-hypothalamic region (TOH; Morales et al. [37]). The alar PHy subregions contact caudally prethalamic territories. The PPaD (or TOH) borders the prethalamic eminence (PThE), whereas the PPaC contacts the reticular nucleus (Rt), the PPaV limits with the zona incerta (ZI), and the PSPa contacts the rostral liminar area (RLi, [40]). The basal PHy is subdivided dorsoventrally in dorsal, intermediate, and ventral retrotuberal subdomains (RTuD, RTuI, RTuV), complemented more ventrally by the periretromamillary (PRM) and retromamillary (RM) subdomains; RM contacts the floor plate of PHy (F). These basal subdivisions are continuous caudally with the p3 tegmentum (p3tg)
Fig. 2
Fig. 2
Representative schemata extracted from atlas sagittal and coronal sections (and adapted to the prosomeric model boundaries) showing the location of the lateral hypothalamus in the peduncular hypothalamus. (A) Atlas sagittal section through the adult mouse hypothalamus copied and modified from Franklin and Paxinos´s Mouse Brain Atlas [39] (their Fig. 105), in which we entered the dorsoventral positions of the 9 lateral hypothalamic (LH) sectors identified in this work, as well as the coronal section levels shown both in panels B–J and in the coronal sections contained in Figs. 3–10. (B–J) Conventional coronal schemata in entrodorsal order (representing topologically horizontal sections in the prosomeric model; i.e., roughly parallel to the length axis) through the adult hypothalamus, modified from the cited atlas as regards the prosomeric boundaries. The section levels were selected according to characteristic alar or basal anatomic landmarks represented in the atlas (including the tag “mfb” definitory for the LH). Medial (the ventricle) is to the left and rostral at the bottom (the caudal diencephalon lies at the top; compare PTh and Th in A). The lateral hypothalamus (LH) forms by conventional definition the radial intermediate stratum (highlighted in blue) found between the superficial (purple) and medial (yellow) hypothalamic strata. Note that while the classical LH in principle reaches the brain surface, Puelles et al. [17] postulated a separate superficial stratum including diverse formations not participating in the LH features: we follow this analysis (see the purple elements). The fornix (f) and nigrostriatal (ns) tracts are identified in gray; other visible tracts except the mfb are also highlighted in gray. The superficial stratum is associated with the peduncle (pe; in gray). Various ventrodorsal LH subdivisions to be documented in the following plates are identified (basal LH1–LH5 and alar LH6–LH9). The main prethalamic and terminal hypothalamic neighboring regions are illustrated as reference landmarks. For additional abbreviations, see “Abbreviations”
Fig. 3
Fig. 3
In situ hybridization expression mapping at P56 of various markers in sector 1 of the basal lateral hypothalamus (LH1; also known as “lateral retromamillary nucleus,” RML). Chosen sagittal and coronal section images (identified according to characteristic landmarks consistent with Fig. 2 atlas data) were downloaded from the Allen Developing Mouse Brain Atlas. The sagittal sections indicate the restricted dorsoventral topography of the labeled LH cells, whereas the coronal sections demonstrate the corresponding either diffuse or restricted topography within the illustrated LH level as defined in Fig. 2. Some markers are shown only in coronal sections (with corresponding level landmarks). Sagittal (A, D, G) and horizontal (conventional coronal) (B, E, F, H–L) sections are shown (marked as SAG or COR at the upper left corner), while (C) illustrates a schematic coronal section through the hypothalamus taken across LH1 (in blue), extracted from Fig. 2; corresponding medial and superficial retromamillary strata relating to LH1 (yellow and purple, respectively) are also shown. In sagittal sections, dorsal direction points to the left, and rostral direction to the bottom; in horizontal/coronal sections, medial direction points to the left, and rostral direction to the bottom. LH1 is characterized by cells expressing Tac1 (A–C), Chrm3 (D–F), Pitx2 (G, H), and Nnat (I). The Cbln4 (J) and Erbb4 (K, L) markers also appear expressed in LH1 cells, though they are detected likewise in cells belonging to the overlying LH2 sector (Table 2). LH1 is part of the retromamillary basal hypothalamic domain (Fig. 1). Black dash lines indicate the thalamo-prethalamic, hypothalamo-prethalamic, and intrahypothalamic transversal interprosomeric boundaries. A red dash line denotes the alar-basal limit. The LH1 area is surrounded with a black line, similarly as neighboring structures of the same radial domain (medial and superficial retromamillary nuclei, RMM, RMS). The mamillo-tegmental tract (mtg) separates the LH1 and RMM areas. The fornix (f) courses dorsoventrally (transected) next to the intrahypothalamic boundary; the LH subpopulation identified as “perifornical 1” (Pf1) is surrounded by a blue dash line (due to the dorsoventral course of f, perifornical populations exist at all LH subdivisions, thus needing an alphanumeric identification). Scale bar for all images, indicated in (A): 730 µm. For additional abbreviations, see “Abbreviations”
Fig. 4
Fig. 4
Molecular characterization of sector 2 of the lateral hypothalamus (LH2). LH2 is part of the periretromamillary basal hypothalamic peduncular subdomain (PRM). All sagittal or coronal (topologically horizontal) section images (marked as SAG or COR at the upper left corner) were downloaded from the Allen Developing Mouse Brain Atlas. The sagittal sections indicate a restricted dorsoventral topography of the labeled LH2 cells, whereas the coronal sections demonstrate the corresponding either diffuse or restricted topography within the illustrated LH2 level as defined in Fig. 2. Some markers are shown only in coronal sections (with corresponding level landmarks). (A–C) Identification of the PRM/LH2 domain by selective expression of Otp, Sim1, and Irs4 in three sagittal sections at the indicated embryonic stages. A schematic horizontal/coronal section through the LH2 level (extracted from Fig. 2) is illustrated in the upper right inset. The LH2 area is in blue and the medial and superficial PRM strata in yellow and purple, respectively; the latter stratum contains the subthalamic and lateral tuberal nuclei (STh, TuL) besides the peduncle. The vertical black line in the inset indicates roughly the sagittal section levels shown in (D), (E), (G), (H), (J), and (K). The black dash lines in D–L indicate the thalamo-prethalamic, hypothalamo-prethalamic, and intrahypothalamic transverse interprosomeric boundaries, whereas the red dash line indicates the alar-basal limit. The black lines delimit LH2 and other basal LH subregions. Cells surrounding the fornix tract (f) within LH2 are classified as the perifornical subpopulation 2 (Pf2; blue dash line). There is restricted expression of Penk signal in LH2 cells at E18.5 (D; this cell population was slightly more distinct at this stage than at P56; E, F). Note adult Penk signal appears in basal LH2 as well as in LH4 cells, and in scattered alar LH cells (E). Ebf3 expression appears in LH2 cells and subjacent LH1 cells both at E18.5 (G) and at P56 (H; less intense signal). Mdga1 expression is present in the LH2 and LH1 sectors (I). Peg10 signal appears largely restricted to basal LH2 and LH4 cells at both E18.5 and P56 (J, K, L). Scale bars: (A–D, G, I, J) = 500 µm; (E, F, H, K, L) = 700 µm. For additional abbreviations, see the “Abbreviations”
Fig. 5
Fig. 5
Large-sized Hdc-positive histaminergic cells develop in the ventral retrotuberal (RTuV) domain of the basal peduncular hypothalamus at P56 (this feature also extends into terminal hypothalamus; TuV in AB). The RTuV contains as its intermediate stratum sector 3 of the lateral hypothalamus (LH3) which lies dorsal to the LH2 or periretromamillary domain (PRM). Sagittal and coronal (topologically horizontal) section images (marked as SAG or COR at the upper left corner) were downloaded from the Allen Developing Mouse Brain Atlas. The sagittal sections indicate a restricted dorsoventral topography of the labeled LH3 cells, whereas the coronal sections demonstrate the corresponding either diffuse or restricted topography within the illustrated LH3. The black dash lines indicate the thalamo-prethalamic, hypothalamo-prethalamic, and intrahypothalamic transverse prosomeric boundaries. The red dash line indicates the alar-basal limit. (A, B) Two sagittal sections (A lateral to B) showing Hdc expression in the RTuV (including positive LH3 cells). Note Hdc-positive cells appear in RTuV and TuV jointly to other positive cells in the premamillary area (PM) and scarce positive cells in subpial position (red arrows). The black lines indicate the coronal levels shown in (C) and (D). There is significant radial dispersion of Hdc cells from periventricular to superficial strata in both RTuV and TuV domains. (E) Coronal section through LH3 showing Prph-expressing cells mainly restricted to the RTuV area. (F) Coronal section through LH3 showing Wif1-positive cells. Note the distribution of Wif1 cells is analogous to that of Hdc cells (compare C, D to F). Prph and Wif1 are known markers expressed in Hdc cells (see text). Scale bars = 700 µm. For additional abbreviations, see “Abbreviations”
Fig. 6
Fig. 6
Expression of selected markers in sector 4 of the lateral hypothalamus (LH4) in sagittal and coronal (topologically horizontal) sections (marked as SAG or COR at the upper left corner) downloaded from the Allen Developing Mouse Brain Atlas at P56. LH4 is the intermediate stratum of the intermediate retrotuberal domain (RTuI) as shown in the section schema (D; LH4 in blue; schema extracted from Fig. 2). The sagittal sections reveal restricted dorsoventral topography of some labeled LH4 cells, whereas the coronal sections demonstrate the corresponding either diffuse or restricted topography within the illustrated LH4 level as defined in D. Some markers are shown only in coronal sections (with corresponding level landmarks). The black dash lines indicate the thalamo-prethalamic, hypothalamo-prethalamic, and intrahypothalamic transverse prosomeric boundaries. The red dash line indicates the alar-basal limit. The vertical black lines in the sagittal sections (A), (E), and (K) indicate coronal section levels in (B), (F), and (L), respectively. Cells around the fornix tract (f) comprise the perifornical subpopulation 4 (Pf4; blue dash line) inside the LH4 sector. (A, B) Sagittal and coronal sections, respectively, showing Nts (neurotensin) signal in LH4 neurons. Note Nts-positive cells are mainly restricted to LH4, though the migrated subthalamic nucleus (STh) seen in B also contains such cells. (C) A coronal section through LH4 showing localized Tac2 (tachykinin 2) neurons. Red asterisks in (B) and (C) indicate Tac2- and Nts-expressing cells in a similar distribution. (D) Schematic coronal section identifying LH4 (in blue) relative to local medial (e.g., the peduncular dorsomedial nucleus DM-P) and superficial (e.g. subthalamic and lateral tuberal nuclei) strata are in yellow and purple, respectively. Sagittal and coronal sections (E, F) show peptidergic Cartpt-positive cells restricted mainly to LH4. LH4 cells show restricted expression of Peg10 (G), Ecel1 (H), Nek7 (I), and Pdyn (J). Peptidergic Penk-expressing cells are also localized in LH4 (K). (L) Cbln2-expressing cells are present in the intermediate LH4 stratum as well as in the local medial stratum, the dorsomedial hypothalamic nucleus (DM-P). Scale bar for all images, indicated in (A): 700 µm. For additional abbreviations, see “Abbreviations”
Fig. 7
Fig. 7
Expression of selected markers in the basal sector 5 of the lateral hypothalamus (LH5) in sagittal (A, G, H, K) and coronal (topologically horizontal; DF, I, J, L, M) sections (marked as SAG or COR at the upper left corner) at indicated stages. The LH5 sector is the intermediate stratum of the dorsal retrotuberal domain (RTuD) of the basal peduncular hypothalamus. All these sections were downloaded from the Allen Developing Mouse Brain Atlas. The sagittal sections indicate a restricted dorsoventral topography of the labeled LH5 cells, whereas the coronal sections demonstrate the corresponding either diffuse or restricted topography within the illustrated LH5 level as defined in C. Some markers are shown only in coronal sections (with corresponding level landmarks). The black dash lines indicate the thalamo-prethalamic, hypothalamo-prethalamic, and intrahypothalamic transverse prosomeric boundaries. The red dash line indicates the alar-basal limit. A black vertical line indicates the approximate horizontal (conventional coronal) level in (L). Cells surrounding the fornix tract (f) comprise the perifornical subpopulation 5 (Pf5; blue dash line) within the LH5 sector. (A) Sagittal section showing hypocretin Hrct-expressing LH5 cells at P28; black arrows indicate some apparently displaced Hcrt-positive cells in the overlying alar hypothalamus. (B) Adult HCRT-immunoreactive cells in a coronal section through LH5. This image is modified from Peyron et al. ([75]; their Fig. 3C; Copyright [1998] Society for Neuroscience). (C) Schema representing LH5 (in blue) as an intermediate stratum intercalated between the medial (in yellow) and superficial (in purple) RTuD strata. Various characteristic anatomic landmarks are seen at this level, such as the hypothalamic peduncular ventral entopeduncular and posterobasal nuclei (EPV, PBas), the terminal ventromedial and arcuate nuclei (VM, Ar), and the prethalamic incertal complex (ZI). Cells expressing Irs4 (D), Nnat (E), and Gpx3 (F) appear within LH5. (G, H) Sagittal sections at P4 and P28 stages showing Pmch positive cells within LH5; the comparison suggests a progressive dispersion. (I) Coronal distribution of adult LH5 peptidergic Pmch-expressing cells. (J) Adult Gal cell subpopulation of LH5 in coronal section. Adult Pdyn-expressing cells in sagittal and coronal sections (K, L). (M) Penk signal in a coronal section through LH5. Scale bars: (A, E, F, H–M) = 700 µm; (B) = 275 µm; (D, G) = 500 µm. For additional abbreviations, see “Abbreviations”
Fig. 8
Fig. 8
This figure shows expression of selected markers in the LH6–8 sectors of the alar peduncular hypothalamus. The black dash lines indicate the thalamo-prethalamic, hypothalamo-prethalamic, and intrahypothalamic transverse prosomeric boundaries. The red dash line indicates the longitudinal alar-basal limit. Sagittal and coronal (topologically horizontal) sections are marked as SAG or COR at the upper left corner). The sagittal sections indicate a restricted dorsoventral topography of the labeled LH cells at indicated levels, whereas the coronal sections demonstrate the corresponding either diffuse or restricted topography within the illustrated LH levels as defined in Fig. 2 and panels 8 E, I. Some markers are shown only in coronal sections (with corresponding level landmarks). (B–D, F–H, J–L) Images of sections downloaded from the Allen Developing Mouse Brain Atlas. (A) A sagittal section through the P0 mouse hypothalamus showing β-galactosidase activity (blue) controlled by a Dlx5/6-LacZ transgenic construct and a pan-Distalless (DLX) immunoreaction (polyclonal antibody) that recognizes all forms of DLX (brown; modified from Puelles et al. [17]; their Fig. 8.15E). The alar sector 6 of the lateral hypothalamus (LH6) corresponds to the intermediate stratum of the peduncular subparaventricular area (PSPa) and contains a mixture of blue and brown Dlx-expressing cells. LH6 contacts caudally the equally strongly LacZ-labeled prethalamic rostral liminar band (RLi). (B) Sagittal section showing LH6 Pnoc-expressing cells at E18.5; note Pnoc cells appear intermingled with unlabeled medial forebrain tract fibers, particularly where the peduncular hypothalamus (PHy) bends laterally around the terminal hypothalamus (see Fig. 2G). (C) Sst expression in sector 7 of the lateral hypothalamus (LH7) in a coronal section at P56. The LH7 sector belongs to the ventral subdivision of the peduncular paraventricular area (PPaV) and contacts caudally the prethalamic incertal complex (ZI). (D) The whole peduncular paraventricular radial region contains glutamatergic Slc17a6 (vGlut2)-positive cells. The ventral and lateral paraventricular nuclei (PaV, PaL), as well as the dorsal entopeduncular nucleus (EPD) appear as landmarks at the LH7 level; the neighboring prethalamus (PTh) contains mainly Slc17a6 (vGlut2)-negative GABAergic cells. (E) Schema of a coronal section through LH7 (in blue) at the level of the ventral paraventricular subarea, comparable to the section illustrated in (D). Note the medial stratum comprises characteristically the ventral paraventricular nucleus (PaV; in yellow) whereas the superficial stratum contains the dorsal entopeduncular nucleus (EPD; in purple). (F-L) These figures illustrate expression of several markers in the sector 8 of the lateral hypothalamus (LH8). LH8 forms the intermediate stratum of the central subdivision of the peduncular paraventricular area (PPaC) and contacts caudally the prethalamic reticular complex (Rt), as illustrated in (I). LH8 Meis2-positive cells are shown in sagittal and coronal sections at P56 (F, G). (H) A coronal section through the peduncular paraventricular area showing widespread Slc17a6 (vGlut2)-positive glutamatergic cells; relatively abundant Slc17a6 (vGlut2)-positive cells are also observed in the thalamus (Th), contrasting with their absence in the PTh. (I) Schema of a coronal section through the LH8 sector with the same color-code as in (E). (J) Abundant Lhx5-expressing cells are present in the LH8 sector at E18.5; note the dorsal entopeduncular nucleus (EPD) and central paraventricular nucleus (PaC) contain Lhx5-positive populations. (K) Disperse Tbr1-positive cells also appear in LH8, as well as in EPD and PaC populations at P56. (L) A coronal section shows LH8 Cacna2d1-positive cells at P56. Scale bars: (B, I) = 500 µm; (C–H, K) = 900 µm. For additional abbreviations, see “Abbreviations”
Fig. 9
Fig. 9
Differential expression of characteristic subpallial (Nkx2.1, Foxg1) and alar hypothalamic (Sim1, Otp) markers, compared to LH9 Satb2 expression in the dorsal paraventricular hypothalamic subdomain (PaD), which apparently coincides with the transitional “telencephalo-opto-hypothalamic area” (TOH) of Morales et al. [37]. These images are presented to clarify this still little-understood forebrain region. Sagittal and coronal sections are marked as SAG or COR at the upper right corner. A red dashed line outlines the paraventricular domain (Pa). The black dash lines indicate the thalamo-prethalamic, hypothalamo-prethalamic, and intrahypothalamic transverse prosomeric boundaries. (A–E) Comparison of the expression of Nkx2.1, Otp, Foxg1, Sim-, and Satb2 in sagittal sections at approximately the same level at E13.5 (less morphogenetic deformation of the relevant boundaries). Note PaD/TOH is a narrow area at the hypothalamo-telencephalic border where Otp/Sim1 signals (B, D) overlap Foxg1 expression (C), in the absence of Nkx2.1 expression (A). White arrows indicate apparent Otp cells migrated to the subjacent subparaventricular domain (B; SPa). A Satb2-positive subpopulation correlates topographically with the PaD/TOH area (E). (F, G) Two mutually equivalent sagittal sections showing Foxg1 and Sim1expression in this area at E18.5. (H) A sagittal section lateral to sections (F) and (G) shows Satb2-expressing cells intermingled with unlabeled medial forebrain tract fibers (mfb) within LH9. (I) LH9 Satb2-positive cells in a coronal section at E18.5. Note the LH9 sector is the intermediate stratum of the PaD/TOH subdomain found at the peduncular alar hypothalamus. Medial periventricular Satb2-positive cells may correspond to the posterior subdivision of the bed nucleus of the stria medullaris (BSTMp; Morales et al. [37]). Scale bars: (B–E) = 500 µm; (F–I) = 600 µm. For additional abbreviations, see “Abbreviations”
Fig. 10
Fig. 10
Panel illustrating other markers expressed at the LH9 at various stages. LH9 is part of the dorsal peduncular paraventricular domain (PaD), which apparently coincides with the newly defined Foxg1-positive telencephalo-opto-hypothalamic area (TOH; Morales et al. [37]). Sagittal and coronal sections (marked as SAG or COR at the upper left corner) were downloaded from the Allen Developing Mouse Brain Atlas. The sagittal sections show a restricted dorsoventral topography of the labeled LH9 cells, whereas the coronal sections demonstrate the corresponding either diffuse or restricted topography within the LH9 level as defined in Fig. 2 and panel C. Some markers are shown only in coronal sections (with corresponding level landmarks). (A) Coronal section illustrating a Fezf2-positive LH9 subpopulation that lies adjacent to the intrahypothalamic boundary (PHy/THy) at P4. (B) Coronal section showing a perifornical Nos1-positive LH9 subpopulation at P56. (C) Schematic representation of the LH9 sector (in blue) in a coronal/horizontal section (extracted from Fig. 2) through the dorsalmost alar peduncular hypothalamus, transitional into telencephalon; the corresponding atlas section clearly was oblique, so that paraventricular structures are seen only in PHy, whereas underlying subparaventricular structures represent the THy. The local medial and superficial peduncular paraventricular components are highlighted in yellow and purple, respectively. (D, E) Two sagittal sections showing LH9 Zic5-positive cells at E18.5. Scale bars: (A) = 500 µm; (B, D, E) = 600 µm. For additional abbreviations, see “Abbreviations”
Fig. 11
Fig. 11
Nkx2.2 expression in the lateral hypothalamus (LH) and other hypothalamic regions in two P4 mouse brains sectioned either sagittally (A, B) or transversally to the hypothalamus (C–H; that is, parallel to the peduncle). The Nkx2.2 hybridization (dark blue) was followed by an immunoreaction with a tyrosine hydroxylase (TH) antibody (brown). The TH-positive dopaminergic fibers of the nigrostriatal tract (ns), a component of the medial forebrain bundle, contributes to the identification of LH subpopulations. The dash black lines indicate thalamo-prethalamic, prethalamo-hypothalamic, and intrahypothalamic transverse interprosomeric boundaries. The green dash line indicates the alar/basal limit. The black line marks the hypothalamo-telencephalic boundary. (A, B) Nkx2.2-positive cells appear in sagittal sections both in the alar paraventricular area (Pa) and the basal ventromedial nucleus (VM); in between these populations, there is a thin longitudinal periventricular Nkx2.2-positive population identified as the rostral liminar band (RLi; modified from Puelles et al. [40]; see their Fig. 8f, g). Reported embryonic observations suggest that both the alar and basal Nkx2.2-positive derivatives originate via early tangential migrations from the primary RLi locus, placed roughly along the alar-basal boundary (Puelles et al. [17]). (C–H) Selected transverse sections through the peduncular hypothalamus ordered from caudal to rostral. Nkx2.2-negative/TH-immunoreactive neurons appear in the alar LH6 subregion (C–E) whereas Nkx2.2-positive/TH-negative cells are present in the alar LH7 subregion (E–G); LH7 and LH6 are respectively components of the peduncular ventral paraventricular subarea (PPaV) and the peduncular subparaventricular area (PSPa). Note the basal TH-positive dopaminergic cells of the A13 group lie next to the alar/basal boundary (green dash line); Nkx2.2-expressing cells appear laterally to A13 within the basal LH5 (F, G); LH5 is a component of the dorsal retrotuberal area (RTuD). Disperse Nkx2.2-positive cells also appear in the basal LH4 subregion (H). Note there are also numerous Nkx2.2-positive cells in the dorsal and ventral paraventricular subnuclei (PaD, PaV; these are part of the medial hypothalamic stratum, not of LH). Scale bar for all images, indicated in (A): 500 µm. For additional abbreviations, see “Abbreviations”
Fig. 12
Fig. 12
First panel of a series of four, showing the distribution of either Slc17a6 (vGlut2) or Gad1 (Gad67) transcripts in adjacent coronal (topologically horizontal) sections through an adult mouse hypothalamus, ordered from ventral to dorsal levels; these mappings are useful to correlate positionally glutamatergic (Slc17a6-) and GABAergic (Gad1)-positive cell populations. All sections were counterstained with a tyrosine hydroxylase (TH) antibody (brown reaction). The red dashed lines indicate the thalamo-prethalamic, prethalamo-hypothalamic, and intrahypothalamic transverse interprosomeric boundaries. Yellow dash lines surround some identified tracts. (A–D) The lateral hypothalamic subregion 1 (LH1) is illustrated in coronal sections through the retromamillary domain (RM). LH1 comprises mostly Slc17a6-positive glutamatergic cells. Scale bar for all images, indicated in (A): 730 µm. For additional abbreviations, see “Abbreviations”
Fig. 13
Fig. 13
Second panel continuing a series of four, showing the distribution of either Slc17a6 (vGlut2) or Gad1 (Gad67) in adjacent coronal/horizontal sections through an adult mouse hypothalamus, ordered from ventral to dorsal levels. The sections were counterstained with a tyrosine hydroxylase (TH) antibody (brown reaction). Red dash lines indicate the thalamo-prethalamic, prethalamo-hypothalamic, and intrahypothalamic transverse interprosomeric boundaries. Yellow dash lines surround some identified tracts. (A, B) Coronal sections through the peduncular basal periretromamillary area, containing the lateral hypothalamic subregion 2 (LH2). LH2 cells mostly express Slc17a6, a glutamatergic cell marker. (C–F) Sections through the basal intermediate retrotuberal area, containing the lateral hypothalamic subregion 4 (LH4). Some LH4 cells in patches express Gad1 (a GABAergic cell marker; C, E, F) whereas disperse cells express Slc17a6 (a glutamatergic marker; D). Scale bar for all images, indicated in (A): 700 µm. For additional abbreviations, see “Abbreviations”
Fig. 14
Fig. 14
Third panel continuing a series of four, showing the distribution of either Slc17a6 (vGlut2) or Gad1 (Gad67) in adjacent coronal/horizontal sections through an adult mouse hypothalamus, ordered from ventral to dorsal. Sections were counterstained with a tyrosine hydroxylase (TH) antibody (brown). Red dash lines indicate the thalamo-prethalamic, prethalamo-hypothalamic, and intrahypothalamic transverse interprosomeric boundaries. Yellow dash lines surround some identified tracts. (A, B) Coronal sections through the alar subparaventricular area, containing the lateral hypothalamic subregion 6 (LH6). At this level, most cells express Gad1, a GABAergic cell marker. (C, D) Sections through the alar ventral paraventricular subarea, containing the lateral hypothalamic subregion 7 (LH7). Most cells at this level express Slc17a6, a glutamatergic cell marker, and are mixed with dispersed Gad1-positive GABAergic cells. Scale bar for all images, indicated in (A): 900 µm. For additional abbreviations, see “Abbreviations”
Fig. 15
Fig. 15
Fourth panel of a series of four, showing the distribution of either Slc17a6 (vGlut2) or Gad1 (Gad67) in adjacent coronal/horizontal sections through the adult mouse hypothalamus, ordered from ventral to dorsal levels. Sections were counterstained with a tyrosine hydroxylase (TH) antibody (brown reaction) except in (C). Red dash lines indicate the thalamo-prethalamic, prethalamo-hypothalamic, and intrahypothalamic transverse interprosomeric boundaries. Yellow dash lines surround some identified tracts. (A) Section reacted for Gad1 through the alar central paraventricular area, containing the lateral hypothalamic subregion 8 (LH8); there are very few GABAergic neurons in LH8, consistently with a majority of glutamatergic ones in the whole paraventricular area (see Fig. 8H; see also Puelles et al. [17]). (B, C) Sections through the alar dorsal paraventricular area, containing the lateral hypothalamic subregion 9 (LH9). Most cells in LH9 express Slc17a6, a glutamatergic cell marker, a few GABAergic Gad1-expressing cells appearing intermingled. Scale bar for all images, indicated in (A): 900 µm. For additional abbreviations, see “Abbreviations”
Fig. 16
Fig. 16
Color-coded prosomeric schema summarizing the postulated ventrodorsal subdivisions of the mouse lateral hypothalamus (LH) in five basal LH subregions (LH1-LH5) and four alar LH subregions (LH6–LH9), and their topographic correlations with neighboring terminal hypothalamic, diencephalic prethalamic, and telencephalic structures. The LH is traversed dorsoventrally by ascending and descending fibers of the medial forebrain bundle (mfb; blue line), and the fornix tract (f: blue line). A ventrodorsal series of perifornical cell subgroups (Pf1-9) is associated with the dorsoventral fornix course, mostly lying next to the intrahypothalamic interprosomeric border (IHB); they are each considered a component of the corresponding LH1-9 subregions. The basal LH1–LH5 sectors limit caudalwards with the nigral tegmentum of prosomere 3 (p3teg); the alar LH6–LH9 subregions contact caudally various prethalamic entities (identified in the schema). The dash black lines identify the prethalamo-hypothalamic and intrahypothalamic transverse interprosomeric boundaries. The red dash line indicates the alar/basal limit. The floorplate (F) is drawn in light gray. The rostral (R) and dorsal (D) spatial directions are indicated in the upper left corner

Similar articles

Cited by

References

    1. Shiraishi T. Noradrenergic neurons modulate lateral hypothalamic chemical and electrical stimulation-induced feeding by sated rats. Brain Res Bull. 1991;27:347–351. doi: 10.1016/0361-9230(91)90123-2. - DOI - PubMed
    1. Bernardis LL, Bellinger LL. The lateral hypothalamic area revisited: neuroanatomy, body weight regulation, neuroendocrinology and metabolism. Neurosci Biobehav Rev. 1993;17:141–193. doi: 10.1016/s0149-7634(05)80149-6. - DOI - PubMed
    1. Elmquist JK, Elias CF, Saper CB. From Lesions to Leptin: Hypothalamic Control of Food Intake and Body Weight. Neuron. 1999;22:221–232. doi: 10.1016/S0896-6273(00)81084-3. - DOI - PubMed
    1. Gerashchenko D, Shiromani PJ. Different neuronal phenotypes in the lateral hypothalamus and their role in sleep and wakefulness. Mol Neurobiol. 2004;29:41–59. doi: 10.1385/MN:29:1:41. - DOI - PubMed
    1. Saper CB. Staying awake for dinner: hypothalamic integration of sleep, feeding, and circadian rhythms. Prog Brain Res. 2006;153:243–252. doi: 10.1016/S0079-6123(06)53014-6. - DOI - PubMed

MeSH terms