. 2022 Nov 10;12(1):19267.
doi: 10.1038/s41598-022-23900-8.

Predicting health crises from early warning signs in patient medical records

Affiliations

Predicting health crises from early warning signs in patient medical records

Selin Gumustop et al. Sci Rep. .

Abstract

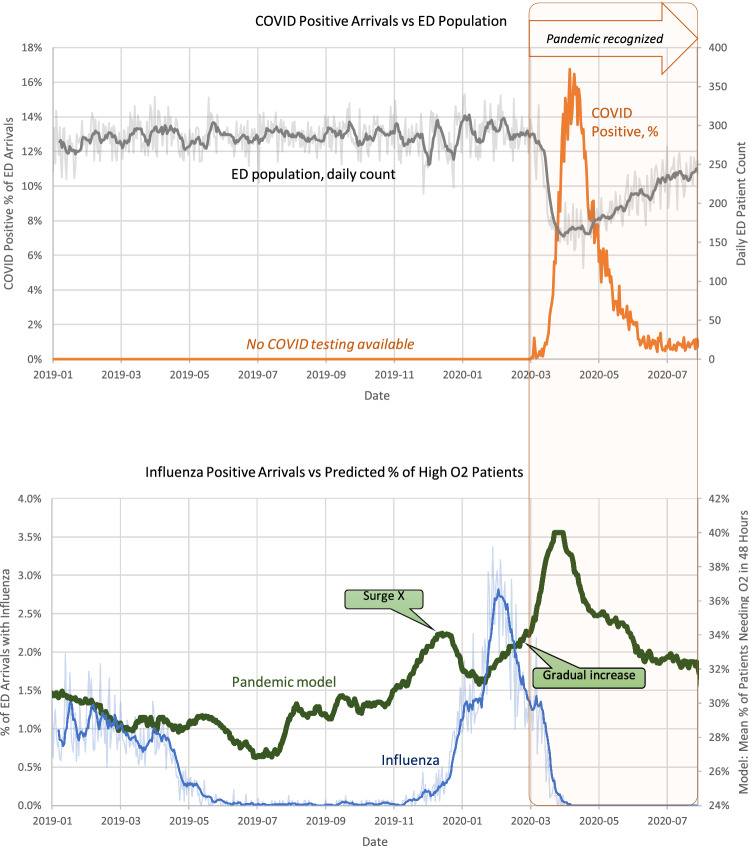
The COVID-19 global pandemic has caused unprecedented worldwide changes in healthcare delivery. While containment and mitigation approaches have been intensified, the progressive increase in the number of cases has overwhelmed health systems globally, highlighting the need for anticipation and prediction to be the basis of an efficient response system. This study demonstrates the role of population health metrics as early warning signs of future health crises. We retrospectively collected data from the emergency department of a large academic hospital in the northeastern United States from 01/01/2019 to 08/07/2021. A total of 377,694 patient records and 303 features were included for analysis. Departing from a multivariate artificial intelligence (AI) model initially developed to predict the risk of high-flow oxygen therapy or mechanical ventilation requirement during the COVID-19 pandemic, a total of 19 original variables and eight engineered features showing to be most predictive of the outcome were selected for further analysis. The temporal trends of the selected variables before and during the pandemic were characterized to determine their potential roles as early warning signs of future health crises. Temporal analysis of the individual variables included in the high-flow oxygen model showed that at a population level, the respiratory rate, temperature, low oxygen saturation, number of diagnoses during the first encounter, heart rate, BMI, age, sex, and neutrophil percentage demonstrated observable and traceable changes eight weeks before the first COVID-19 public health emergency declaration. Additionally, the engineered rule-based features built from the original variables also exhibited a pre-pandemic surge that preceded the first pandemic wave in spring 2020. Our findings suggest that the changes in routine population health metrics may serve as early warnings of future crises. This justifies the development of patient health surveillance systems, that can continuously monitor population health features, and alarm of new approaching public health crises before they become devastating.


Conflict of interest statement

The authors declare no competing interests.

Figures

Figure 1
Figure 1
Predicted fraction of patients requiring oxygen within 48 h of ED arrival plotted over time (from January 2019–August 2020). The circles represent the original data averaged over 6-h intervals (with 3-h increments). Lines represent the percentile curves: the 25th percentile (green line), median (black line), and 75th percentile (red line). The percentile trend curves exhibit temporal patterns despite the large data variability and noise.
Figure 2
Figure 2
Top: Percentage of ED patients who had positive COVID-19 test results versus the daily ED population count; regular COVID-19 tests became available in March 2020. Bottom: Percentage of ED arrivals who received a positive influenza test versus our pandemic model trend. Darker lines show 1-week moving averages, and lighter background lines—the actual daily values.
Figure 3
Figure 3
Respiratory rate, temperature, low O2 requirement, number of diagnoses at first encounter, and heart rate model features plotted through time (January 2019–August 2020). The circles represent the original data averaged over 6-h intervals, and the lines-moving percentile curves for 25%, 50%, and 75%.
Figure 4
Figure 4
BMI, age, sex, and neutrophil percentage model features plotted over time (January 2019–August 2020). The circles represent the original data averaged over 6-h intervals, and the lines-moving percentile curves for 25%, 50%, and 75%.
Figure 5
Figure 5
Decreasing trends: lymphocyte and monocyte percentages, MCHC, and O2 saturation over time (January 2019–August 2020). The circles represent the original data averaged over 6-h intervals, and the lines-moving percentile curves for 25%, 50%, and 75%.
Figure 6
Figure 6
Engineered feature (F1-F4): trends over time (January 2019–August 2020). The circles represent the original data averaged over 6-h intervals, and the lines—moving percentile curves for 25%, 50%, and 75%.
Figure 7
Figure 7
Engineered feature (F5-F8): trends over time (January 2019–August 2020). The circles represent the original data averaged over 6-h intervals, and the lines—moving percentile curves for 25%, 50%, and 75%.
Figure 8
Figure 8
Population surveillance model: major components.

References

    1. World Health Organization (WHO). Coronavirus (COVID-19) dashboard. In: https://covid19.who.int/. 2020.
    1. Schuchat A. Public health response to the initiation and spread of pandemic COVID-19 in the United States, February 24–April 21, 2020. MMWR Morb. Mortal Wkly. Rep. 2020;69:551–556. doi: 10.15585/mmwr.mm6918e2. - DOI - PMC - PubMed
    1. Woolhandler S, Himmelstein DU, Ahmed S, Bailey Z, Bassett MT, Bird M, et al. Public policy and health in the Trump era. The Lancet. 2021;397:705–753. doi: 10.1016/S0140-6736(20)32545-9. - DOI - PubMed
    1. Redlener, I., Sachs, J.D., Hansen, S., & Hupert, N. 130,000 – 210,000 Avoidable COVID-19 Deaths – and Counting – in the U.S. New Yor, NY; 2020.
    1. Weinberger DM, Chen J, Cohen T, Crawford FW, Mostashari F, Olson D, et al. Estimation of excess deaths associated with the COVID-19 pandemic in the United States, March to May 2020. JAMA Intern. Med. 2020;180:1336. doi: 10.1001/jamainternmed.2020.3391. - DOI - PMC - PubMed