. 2022 Nov;28(11):2321-2332.
doi: 10.1038/s41591-022-02046-0. Epub 2022 Nov 10.

Rare and common genetic determinants of metabolic individuality and their effects on human health

Affiliations

Rare and common genetic determinants of metabolic individuality and their effects on human health

Praveen Surendran et al. Nat Med. 2022 Nov.

Abstract

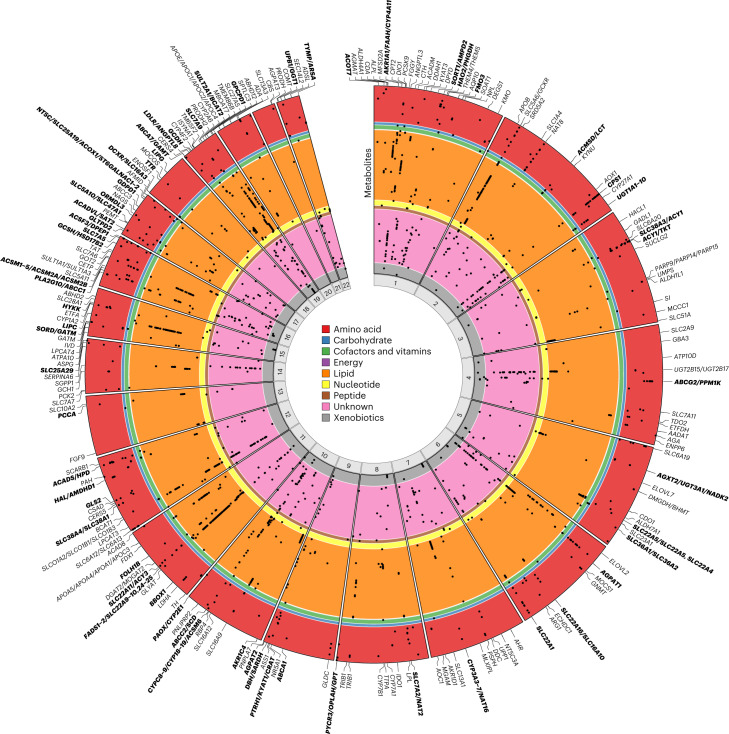
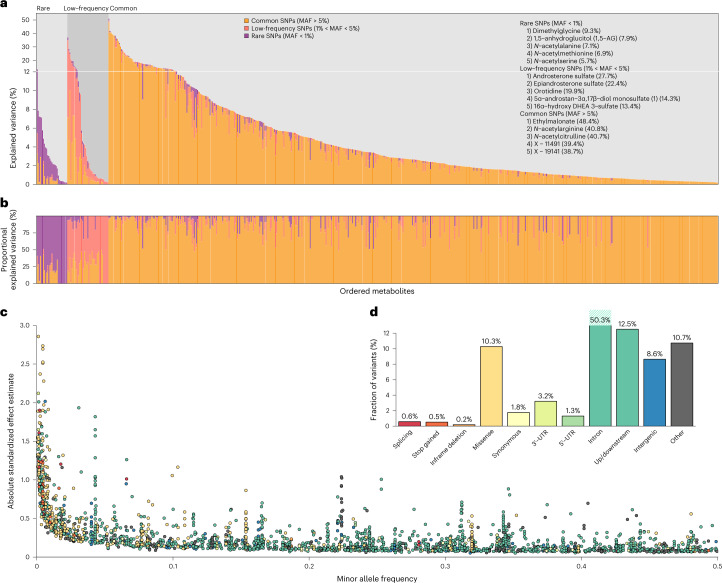
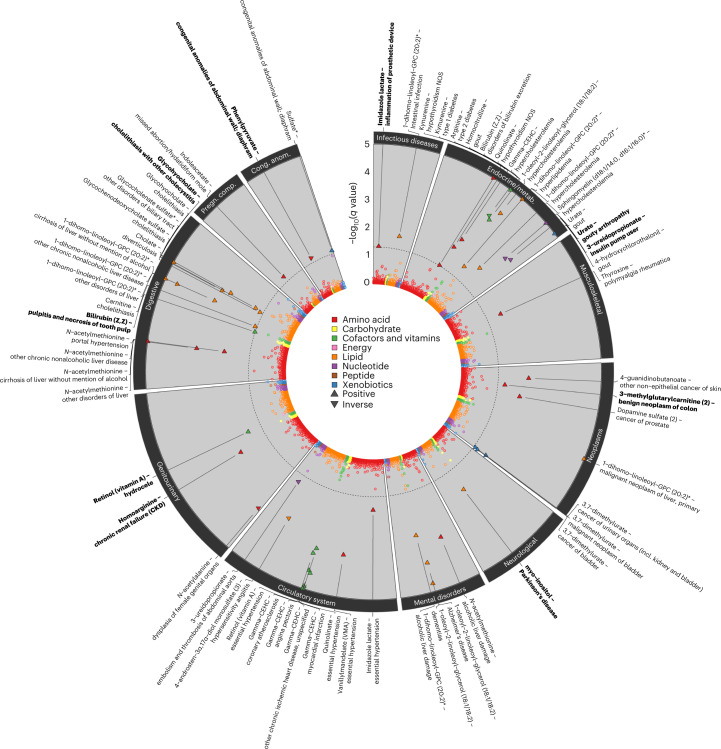
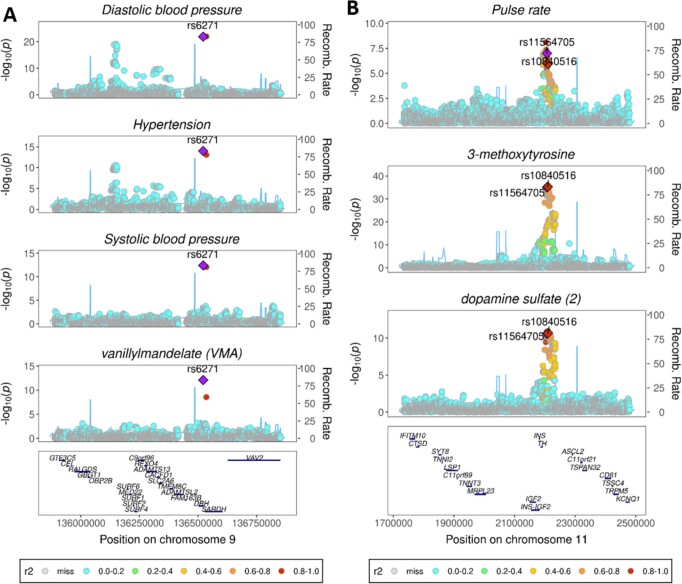
Garrod's concept of 'chemical individuality' has contributed to comprehension of the molecular origins of human diseases. Untargeted high-throughput metabolomic technologies provide an in-depth snapshot of human metabolism at scale. We studied the genetic architecture of the human plasma metabolome using 913 metabolites assayed in 19,994 individuals and identified 2,599 variant-metabolite associations (P < 1.25 × 10⁻¹¹) within 330 genomic regions, with rare variants (minor allele frequency ≤ 1%) explaining 9.4% of associations. Jointly modeling metabolites in each region, we identified 423 regional, co-regulated, variant-metabolite clusters called genetically influenced metabotypes. We assigned causal genes for 62.4% of these genetically influenced metabotypes, providing new insights into fundamental metabolite physiology and clinical relevance, including metabolite-guided discovery of potential adverse drug effects (DPYD and SRD5A2). We show strong enrichment of inborn errors of metabolism-causing genes, with examples of metabolite associations and clinical phenotypes of non-pathogenic variant carriers matching characteristics of the inborn errors of metabolism. Systematic, phenotypic follow-up of metabolite-specific genetic scores revealed multiple potential etiological relationships.


Conflict of interest statement

During the course of the project, P.S. became a full-time employee of GlaxoSmithKline, V.P.W.A. became a full-time employee of AstraZeneca, L.B. became a full-time employee of BioMarin, J.Z. became a full-time employee of Novartis, J.M.M.H. became a full-time employee of Novo Nordisk Ltd. and L.A.L. is presently an employee and owns stocks and stock options of Regeneron Pharmaceuticals Inc. E.R.G. receives an honorarium from the journal Circulation Research of the American Heart Association, as a member of the Editorial Board. P.A.S. and G.A.M. are employees of Metabolon. T.D.S. is co-founder of Zoe Global Ltd. E.B.F. is an employee of Pfizer. J.D. reports grants, personal fees and non-financial support from Merck Sharp & Dohme (MSD), grants, personal fees and non-financial support from Novartis, grants from Pfizer and grants from AstraZeneca outside the submitted work. J.D. sits on the International Cardiovascular and Metabolic Advisory Board for Novartis (since 2010); the Steering Committee of UK Biobank (since 2011); the MRC International Advisory Group (ING), member, London (since 2013); the MRC High Throughput Science ‘Omics, panel member, London (since 2013); the Scientific Advisory Committee for Sanofi (since 2013); the International Cardiovascular and Metabolism Research and Development Portfolio Committee for Novartis; and the AstraZeneca Genomics Advisory Board (2018). A.S.B. has received grants unrelated to this work from AstraZeneca, Biogen, BioMarin, Bioverativ, Merck, Novartis and Sanofi. The remaining authors declare no competing interests.

Figures

Fig. 1
Fig. 1. An established map of metabolic pathways.
Map of metabolic pathways highlighting 204 of the 632 annotated metabolites analyzed in this study (dark gray and red circles), including 154 with genetic associations (red circles). We also mapped 51 metabolites to class nodes (indicated by star symbols). Of the 46 class nodes, 22 are red, indicating that they contain at least one metabolite with a genetic association. Genes (grey and lime green squares) and causal genes regulating associations discovered in the study (lime green squares; as explained in the section ‘Identification of genetically influenced metabotypes’) are illustrated. Downward-pointing arrowheads indicate a process and upward-pointing triangles indicate a source. The inset focuses on the tryptophan metabolism pathway. An interactive version is available on the accompanying webserver at https://omicscience.org/apps/mgwas.
Fig. 2
Fig. 2. Circular plot illustrating the genomic location of regional associations with metabolites.
Metabolites occupy circular bands, within colored sections for each of the assigned metabolic classes: amino acid (n = 124), carbohydrate (n = 10), cofactors and vitamins (n = 15), energy (n = 2), lipid (n = 241), nucleotide (n = 19), peptide (n = 12), unannotated compounds (n = 185) and xenobiotics (n = 38). Metabolite-region associations are indicated by black points. All 646 metabolites with associations are shown. Causal genes are labeled; those in bold indicate regions with more than one GIM (as explained in the section ‘Identification of genetically influenced metabotypes’).
Fig. 3
Fig. 3. Variance explained, MAF versus effect size and functional annotation.
a, The percentage of phenotypic variance of each metabolite explained by conditionally independent associations. The variance explained is partitioned into that explained by variants within each MAF bin, and indicated by color: rare (purple), low-frequency (pink) and common (orange). Three groups of metabolites are defined, with rare, low-frequency or common variants explaining the greatest percentage of phenotypic variance of the metabolite. The five metabolites with the greatest percentage of phenotypic variance explained by rare, low-frequency or common variants are listed, with the total percentage of variance explained by all variants in that MAF bin shown in parentheses. b, The phenotypic variance of each metabolite explained by variants within each MAF bin as a percentage of the variance explained by all conditionally independent associations. c, MAF versus association effect size for conditionally independent associations, with variants colored by functional annotation class as indicated in d. d, A bar plot of the frequency of variants in each functional class.
Fig. 4
Fig. 4. Example of defining GIMs within a genomic region.
At a 2.55-Mb region on chromosome 8 (region 512), metabolite associations fall into four sets (GIMs) acting through three genes (PYCR3, OPLAH or GPT) with known roles in metabolism. a, Four GIMs defined by overlap in the genetic regulation of metabolite sets. Matrices display the −log10(P) (capped at 50) and direction of effect (higher, red; lower, blue) for associations from stepwise conditional models, fitting the variants in the following order: rs3935209, rs2242090, rs11777194, rs10094377, rs35975875, rs10108836, rs11986259, rs34121654. GIM 1: two variants associating with 6-oxopiperidine-2-carboxylic acid and 5-oxoproline; the causal gene is OPLAH, encoding 5-oxoprolinase, which catalyzes the ATP-dependent hydrolysis of 5-oxoproline to glutamic acid (5-oxoproline and the structurally closely related 6-oxopiperidine-2-carboxylic acid associated in this cluster). GIM 2: four variants associating with S-1-pyrroline-5-carboxylate and the unannotated metabolites X-11315 and X-11334; the causal gene is PYCR3, a pyrroline-5-carboxylate reductase that generates proline from S-1-pyrroline-5-carboxylate (the strongest associated metabolite in this cluster). GIM 3: a single variant associating with aspartate; the causal gene is GPT, encoding alanine aminotransferase, which takes alanine as a substrate and produces glutamate, which is one step removed from the associated metabolite aspartate. GIM 4: a single variant associating with the unannotated metabolite X-23639. b, Regional association indicating genomic positions of the associated variants (black lines) and causal genes (in red). c, Manhattan plot of chromosome eight, with the y axis capped at 120 for clarity. All P values presented were derived from linear mixed models.
Fig. 5
Fig. 5. Clinical implications of genetic variation at the SRD5A2 locus.
a, Stacked regional association plots for eight steroid metabolites, the risk of male-pattern baldness and depression in a 2-Mb window around the most likely causal gene, SRD5A2. Association statistics (P values from linear mixed models) for levels of plasma metabolites were derived from linear regression models as described in the text, and summary statistics for male-pattern baldness and depression were extracted from the literature,. The two-color gradients indicate the LD (r2) with the candidate causal variants identified using multi-trait colocalization: rs112881196 (blue, lead signal for male-pattern baldness) and rs62142080 (orange, lead signal for depression). b, Forest plot showing effect estimates (box) and 95% confidence intervals for rs112881196 (top panel) and rs62142080 (lower panel) across all traits considered. Effects for depression are given as odds ratios, because logistic regression models were used for association testing, whereas effects for all other traits were estimated using linear regression models. Effect estimates and corresponding standard errors for male-pattern baldness and depression were obtained from the same studies as described in the text. Sample sizes for metabolites are described in Supplementary Table 8. Open symbols indicate non-significant effects (P > 0.05). c, Scheme describing the putative mechanism by which the two genetic variants nearby SRD5A2 alter steroid metabolism. Lower plasma levels of metabolites downstream of 5α-reduction of androgenic steroids but higher levels of the main 5β-reduced androgen metabolite etiocholanolone indicate lower activity of steroid 5α-reductase 2 (SRD5A2) conferred by variants associated with a lower risk for male-pattern baldness (via rs112881196) but increased risk for depression (via rs62142080). Parts of this figure were created with BioRender.com.
Fig. 6
Fig. 6. Summary of phenome-wide associations with metabolite scores.
The circos plot displays adjusted P values (q value) from logistic regression models testing for pairwise associations between 155 genetically predicted metabolite levels (scores) and 1,457 phecodes in the UK Biobank. Each dot represents one metabolite–phecode association, and colors reflect metabolite classes. Associations passing the multiple testing correction cutoff (q < 0.05) are indicated by larger triangles, the orientation of which indicates the association direction, and are annotated at the outer margins of the plot. Metabolite score–phecode associations with robust evidence for a dose–response relationship are indicated in bold (see text). Effect estimates, standard errors and P values are provided in Supplementary Table 14.
Extended Data Fig. 1
Extended Data Fig. 1. Study design and method of defining genetically influenced metabotypes.
Following the discovery meta-analyses (INTERVAL + EPIC-Norfolk), validation of sentinel variants and metabolite specific conditional analysis, we identified 2,599 independent variant-metabolite associations. In the next step, we performed a joint variant-metabolite refinement within each region that contained more than one metabolite to group metabolites influenced by at least one shared genetic signal. We defined these co-regulated metabolite sets by identifying the minimal set of variants from all metabolite-specific conditionally independent lead and secondary metabolite associated variants that explained all regional metabolite associations. The 422 metabotypes identified through this method were manually curated to identify the causal genes associated with these GIMs.
Extended Data Fig. 2
Extended Data Fig. 2. Comparison of rare variant effect sizes with WES results.
Comparison of rare variant effect sizes between the discovery meta-analysis, and the WES analysis in a subset of 3,924 samples from the INTERVAL study (R2 = 98.33). 122 (46.2%) of all rare variant associations were testable using WES analysis. All 122 were directionally consistent and 118 were at least nominally significant (P-value < 0.05).
Extended Data Fig. 3
Extended Data Fig. 3. Common variants at IEM genes have metabolic and phenotypic consequences mimicking those observed in corresponding IEM.
a) Rare mutations at the DBH and TH genes are known to cause the IEMs orthostatic hypotension (OMIM #223360, coloured in orange) and Segawa syndrome (OMIM #605407, coloured in blue). b) In this study, we found common variants at these genes that are associated with metabolic and phenotypic consequences mimicking those observed in the corresponding IEMs.
Extended Data Fig. 4
Extended Data Fig. 4. Colocalisation of metabolic and phenotypic associations at DBH and TH.
a) At GIM547.3, the DBH variant rs6271 is a strong likely-causal candidate variant for shared signals between decreased plasma vanillylmandelate levels, decreases in automated readings of systolic and diastolic blood pressure (N = 436,424), and a decrease in self-reported hypertension in UK Biobank (N = 462,933). b) At GIM604.1, the TH variant rs11564705 (MAF = 24%, r2 = 0.98 with the variant rs10840516 identified in this study) is a strong likely-causal candidate variant for shared signals between increased plasma levels of 3-methoxytyrosine and dopamine sulfate (2) and an increase in automated readings of pulse rate in UK Biobank (N = 436,424).
Extended Data Fig. 5
Extended Data Fig. 5. Sensitivity analyses heatmaps for colocalisation analyses at DBH and TH.
Sensitivity analyses heatmaps for colocalisation at a) DBH and b) TH. Heatmaps showing the proportion of clusters that traits share across tested configurations of prior2 values (0.99, 0.999) and regional and alignment thresholds (0.6, 0.7, 0.8, 0.9).
Extended Data Fig. 6
Extended Data Fig. 6. Colocalisation between PPM1K and BCAA-catabolites.
Stacked regional plots showing colocalization between breast cancer and BCAA-catabolites, 2-aminobutyrate, isobutyrylcarnitine and gamma-glutamyl-2-aminobutyrate colocalise (PP = 0.98) within PPM1K.
Extended Data Fig. 7
Extended Data Fig. 7. Dosage plot for homoarginine and chronic renal failure variant associations.
Dosage plot showing, for each variant in the homoarginine metabolite score, the estimated risk of chronic renal failure (log(OR per allele) versus the estimated effect on homoarginine levels (per 1 s.d. change per allele). Each dot represents the point estimates from the respective linear/logistic regression models using the genetic variant as exposure and either the metabolite or disease status as outcome (n = 334577, n cases=16389; for metabolite, n = 14295 cases for chronic renal failure). Lines indicate 95%-confidence intervals.

Comment in

Similar articles

Cited by

References

    1. Lotta, L. A. et al. A cross-platform approach identifies genetic regulators of human metabolism and health. Nat. Genet. 10.1038/s41588-020-00751-5 (2021). - PMC - PubMed
    1. Kettunen, J. et al. Genome-wide study for circulating metabolites identifies 62 loci and reveals novel systemic effects of LPA. Nat. Commun. 10.1038/ncomms11122 (2016). - PMC - PubMed
    1. Nag, A. et al. Assessing the contribution of rare-to-common protein-coding variants to circulating metabolic biomarker levels via 412,394 UK Biobank exome sequences. Preprint at medRxiv10.1101/2021.12.24.21268381 (2021).
    1. Long, T. et al. Whole-genome sequencing identifies common-to-rare variants associated with human blood metabolites. Nat. Genet. 10.1038/ng.3809 (2017). - PubMed
    1. Shin, S. Y. et al. An atlas of genetic influences on human blood metabolites. Nat. Genet. 10.1038/ng.2982 (2014). - PMC - PubMed

Publication types

MeSH terms

Substances

Grants and funding