

Amyloid and tau PET-positive cognitively unimpaired individuals are at high risk for future cognitive decline
- PMID: 36357681
- PMCID: PMC9671808
- DOI: 10.1038/s41591-022-02049-x
Amyloid and tau PET-positive cognitively unimpaired individuals are at high risk for future cognitive decline
Abstract
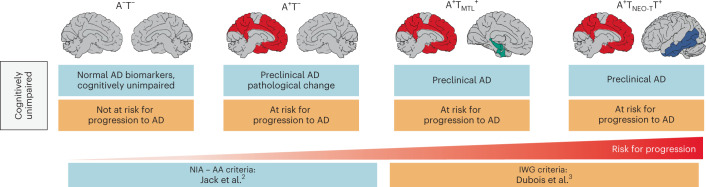
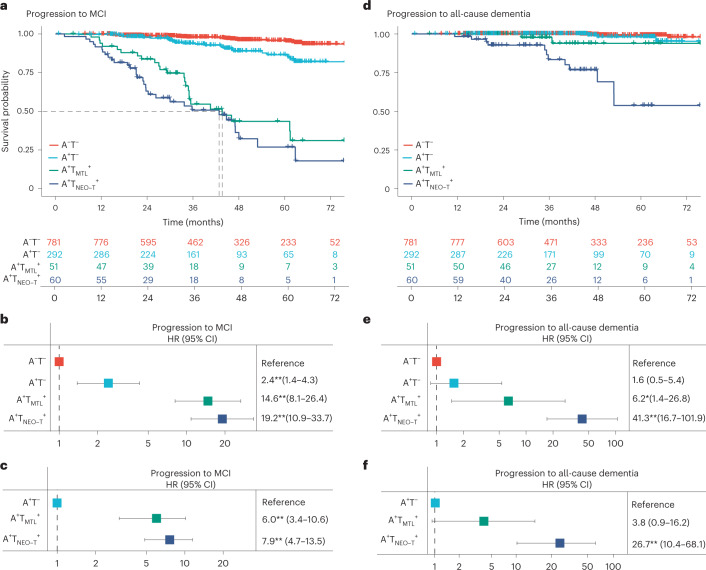
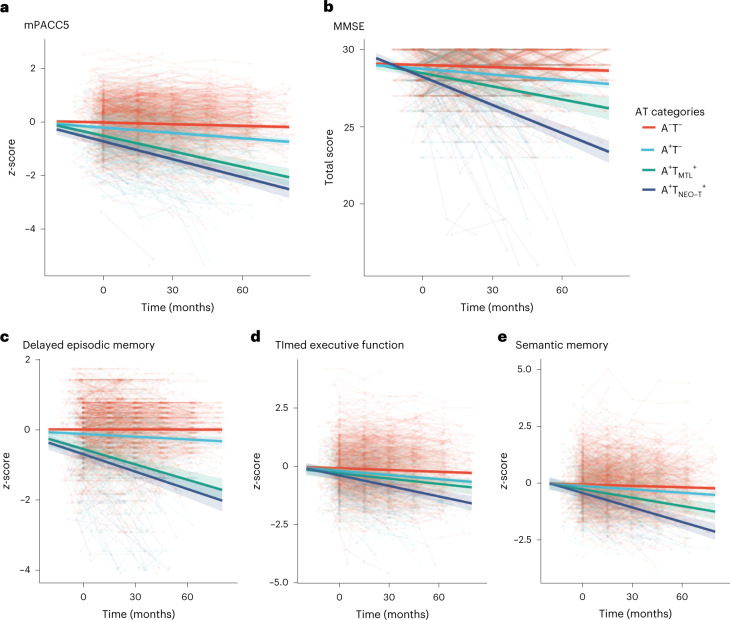
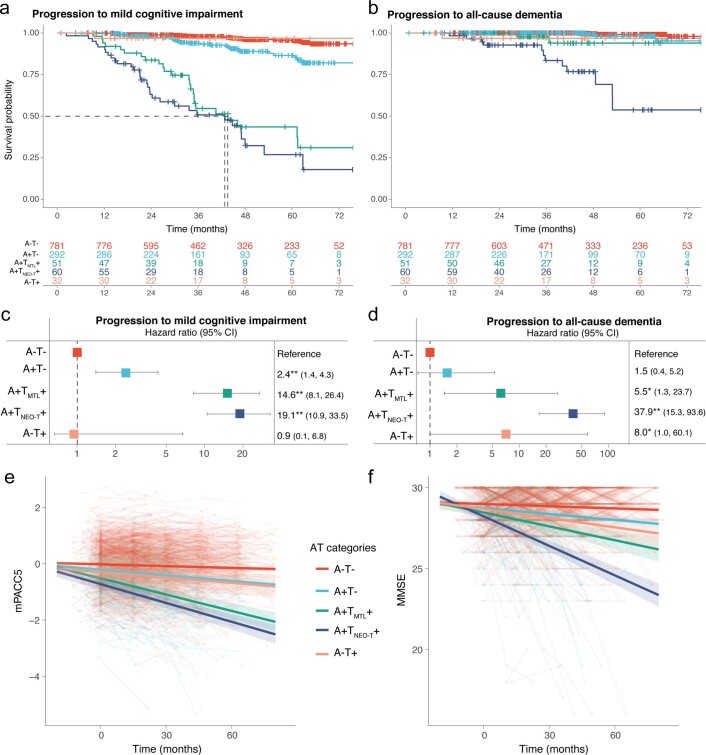
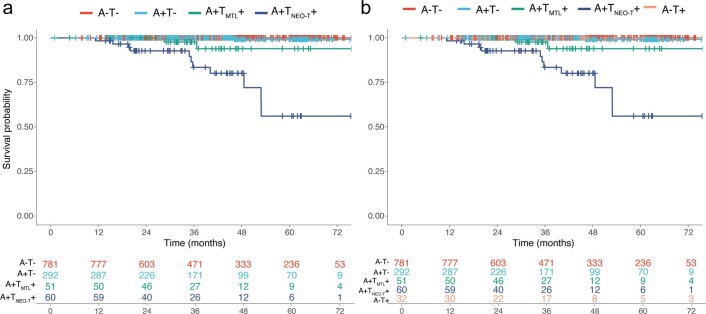
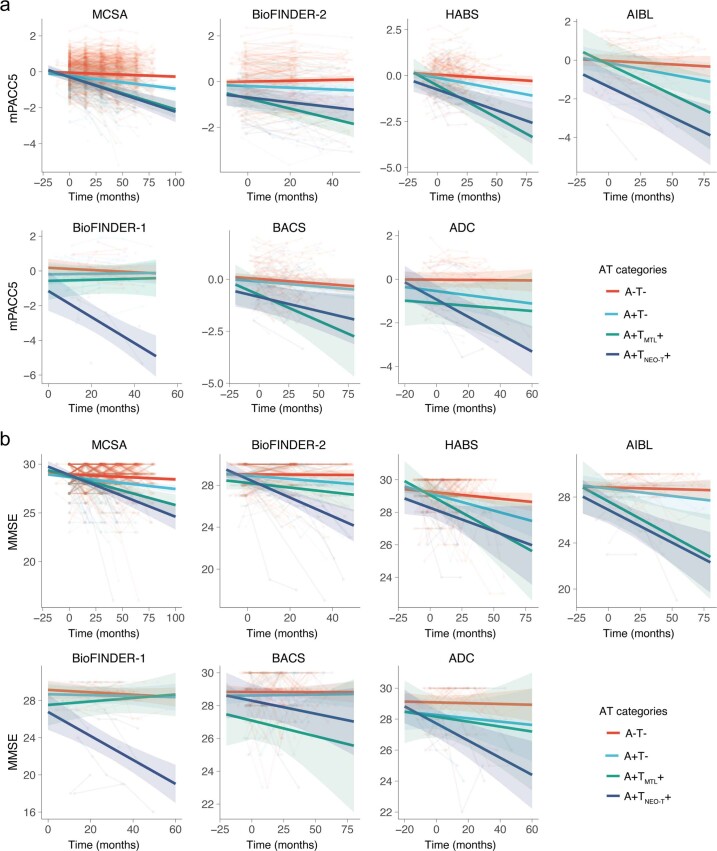
A major unanswered question in the dementia field is whether cognitively unimpaired individuals who harbor both Alzheimer's disease neuropathological hallmarks (that is, amyloid-β plaques and tau neurofibrillary tangles) can preserve their cognition over time or are destined to decline. In this large multicenter amyloid and tau positron emission tomography (PET) study (n = 1,325), we examined the risk for future progression to mild cognitive impairment and the rate of cognitive decline over time among cognitively unimpaired individuals who were amyloid PET-positive (A+) and tau PET-positive (T+) in the medial temporal lobe (A+TMTL+) and/or in the temporal neocortex (A+TNEO-T+) and compared them with A+T- and A-T- groups. Cox proportional-hazards models showed a substantially increased risk for progression to mild cognitive impairment in the A+TNEO-T+ (hazard ratio (HR) = 19.2, 95% confidence interval (CI) = 10.9-33.7), A+TMTL+ (HR = 14.6, 95% CI = 8.1-26.4) and A+T- (HR = 2.4, 95% CI = 1.4-4.3) groups versus the A-T- (reference) group. Both A+TMTL+ (HR = 6.0, 95% CI = 3.4-10.6) and A+TNEO-T+ (HR = 7.9, 95% CI = 4.7-13.5) groups also showed faster clinical progression to mild cognitive impairment than the A+T- group. Linear mixed-effect models indicated that the A+TNEO-T+ (β = -0.056 ± 0.005, T = -11.55, P < 0.001), A+TMTL+ (β = -0.024 ± 0.005, T = -4.72, P < 0.001) and A+T- (β = -0.008 ± 0.002, T = -3.46, P < 0.001) groups showed significantly faster longitudinal global cognitive decline compared to the A-T- (reference) group (all P < 0.001). Both A+TNEO-T+ (P < 0.001) and A+TMTL+ (P = 0.002) groups also progressed faster than the A+T- group. In summary, evidence of advanced Alzheimer's disease pathological changes provided by a combination of abnormal amyloid and tau PET examinations is strongly associated with short-term (that is, 3-5 years) cognitive decline in cognitively unimpaired individuals and is therefore of high clinical relevance.
© 2022. The Author(s).
Conflict of interest statement
O.H. has acquired research support (for the institution) from ADx, AVID Radiopharmaceuticals, Biogen, Eli Lilly, Eisai, Fujirebio, GE Healthcare, Pfizer and Roche. In the past 2 years, he received consultancy/speaker fees from AC Immune, Amylyx Pharmaceuticals, ALZpath, BioArctic, Biogen, Cerveau Technologies, Fujirebio, Genentech, Novartis, Roche and Siemens. R.O. gave a lecture in a symposium sponsored by GE Healthcare (fee paid to the institution). S.P. has served on scientific advisory boards and/or given lectures in symposia sponsored by Biogen, Eli Lilly, Geras Solutions and Roche. W.J.J. consults for Eli Lilly, Eisai, Bioclinica and Prothena. C.R. is a scientific advisor to Cerveau Technologies, Prothena, Roche and has received research grants (paid to the institution) from Biogen, Eisai and Cerveau Technologies. R.C.P. has consulted for Roche, Merck, Biogen, Eisai, Genentech and Nestle and receives research funding from the National Institutes of Health (NIH). W.F. has performed contract research for Biogen and Boehringer Ingelheim, has been an invited speaker at Boehringer Ingelheim, Biogen, Danone, Eisai, WebMD Neurology (Medscape) and Springer Healthcare, is consultant to the Oxford Health Policy Forum CIC, Roche and Biogen, participated in the advisory boards of Biogen and Roche and is a member of the steering committee of PAVE and Think Brain Health (all funding/fees were paid to the institution). C.R.J. serves on an independent data monitoring board for Roche, has served as a speaker for Eisai and consulted for Biogen but receives no personal compensation from any commercial entity. C.R.J. receives research support from the NIH and the Alexander Family Alzheimer’s Disease Research Professorship of the Mayo Clinic. The other authors declare no competing interests.
Figures
Comment in
-
Biomarker-based diagnosis of preclinical Alzheimer disease: time for the clinic?Nat Rev Neurol. 2023 Feb;19(2):71-72. doi: 10.1038/s41582-022-00767-x. Nat Rev Neurol. 2023. PMID: 36627511 Free PMC article. No abstract available.
-
Beyond the AJR: Alzheimer Disease and Cognitive Decline-Confirmation of the Prognostic Value of Amyloid and Tau PET in a Large Multicentric Study.AJR Am J Roentgenol. 2023 Oct;221(4):554. doi: 10.2214/AJR.23.29113. Epub 2023 Feb 15. AJR Am J Roentgenol. 2023. PMID: 36790112 No abstract available.
References
-
- Dubois B, et al. Cognitive and neuroimaging features and brain β-amyloidosis in individuals at risk of Alzheimer’s disease (INSIGHT-preAD): a longitudinal observational study. Lancet Neurol. 2018;17:335–346. - PubMed
Publication types
MeSH terms
Substances
Grants and funding
LinkOut - more resources
Full Text Sources
Other Literature Sources
Medical
