Clinical Trial
. 2022 Dec;7(12):1996-2010.
doi: 10.1038/s41564-022-01262-1. Epub 2022 Nov 10.

Immune correlates analysis of the ENSEMBLE single Ad26.COV2.S dose vaccine efficacy clinical trial

Youyi Fong  1   2 Adrian B McDermott  3 David Benkeser  4 Sanne Roels  5 Daniel J Stieh  6 An Vandebosch  5 Mathieu Le Gars  6 Griet A Van Roey  6 Christopher R Houchens  7 Karen Martins  7 Lakshmi Jayashankar  7 Flora Castellino  7 Obrimpong Amoa-Awua  3 Manjula Basappa  3 Britta Flach  3 Bob C Lin  3 Christopher Moore  3 Mursal Naisan  3 Muhammed Naqvi  3 Sandeep Narpala  3 Sarah O'Connell  3 Allen Mueller  3 Leo Serebryannyy  3 Mike Castro  3 Jennifer Wang  3 Christos J Petropoulos  8 Alex Luedtke  9 Ollivier Hyrien  1   2 Yiwen Lu  1 Chenchen Yu  1 Bhavesh Borate  1 Lars W P van der Laan  1   9 Nima S Hejazi  1   10 Avi Kenny  11 Marco Carone  11 Daniel N Wolfe  7 Jerald Sadoff  6 Glenda E Gray  12   13 Beatriz Grinsztejn  14 Paul A Goepfert  15 Susan J Little  16 Leonardo Paiva de Sousa  14 Rebone Maboa  17 April K Randhawa  1 Michele P Andrasik  1 Jenny Hendriks  6 Carla Truyers  5 Frank Struyf  5 Hanneke Schuitemaker  6 Macaya Douoguih  6 James G Kublin  1 Lawrence Corey  1   18 Kathleen M Neuzil  19 Lindsay N Carpp  1 Dean Follmann  20 Peter B Gilbert #  21   22   23 Richard A Koup #  3 Ruben O Donis #  7 Immune Assays TeamCoronavirus Vaccine Prevention Network (CoVPN)/ENSEMBLE Teamand the United States Government (USG)/CoVPN Biostatistics Team
Affiliations
Clinical Trial

Immune correlates analysis of the ENSEMBLE single Ad26.COV2.S dose vaccine efficacy clinical trial

Youyi Fong et al. Nat Microbiol. 2022 Dec.

Abstract

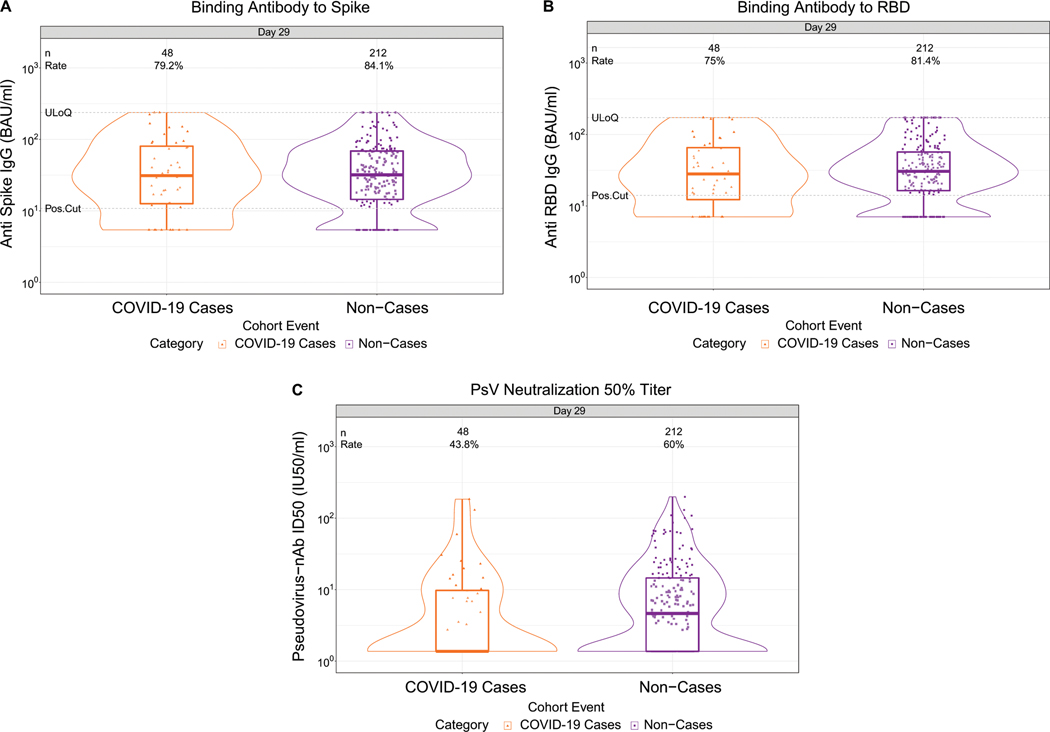
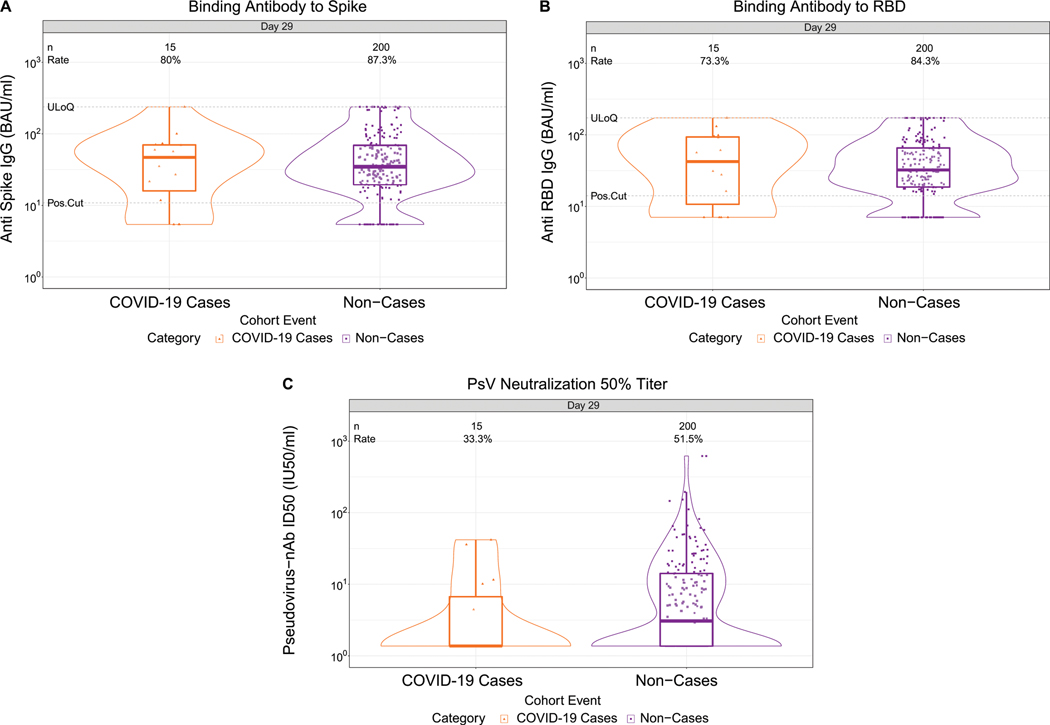
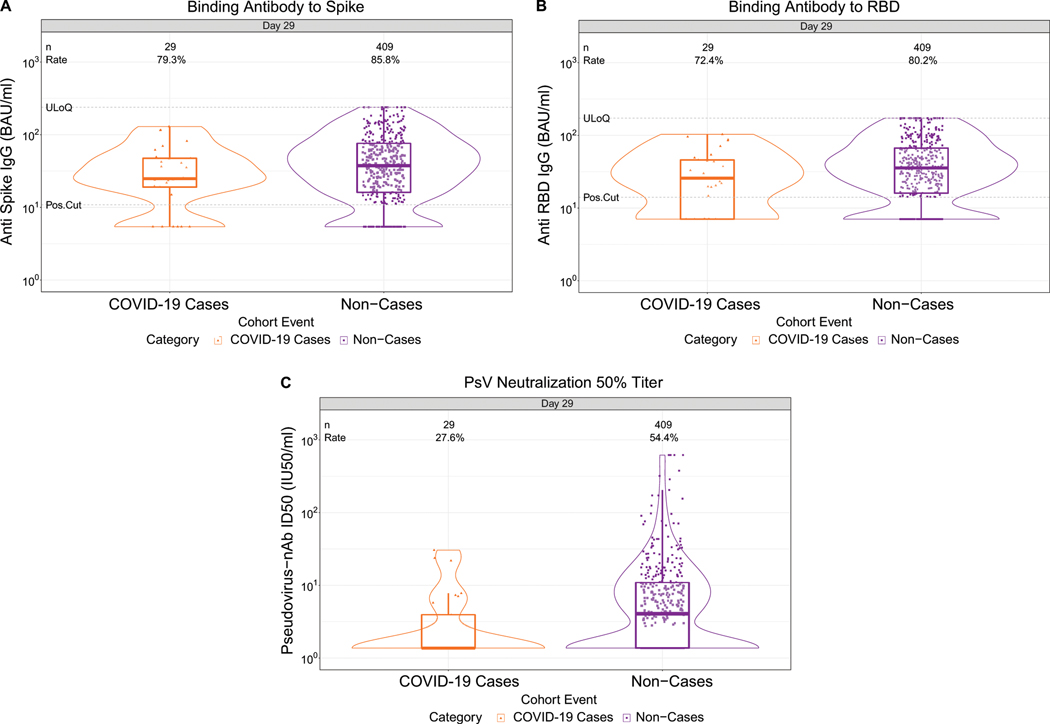
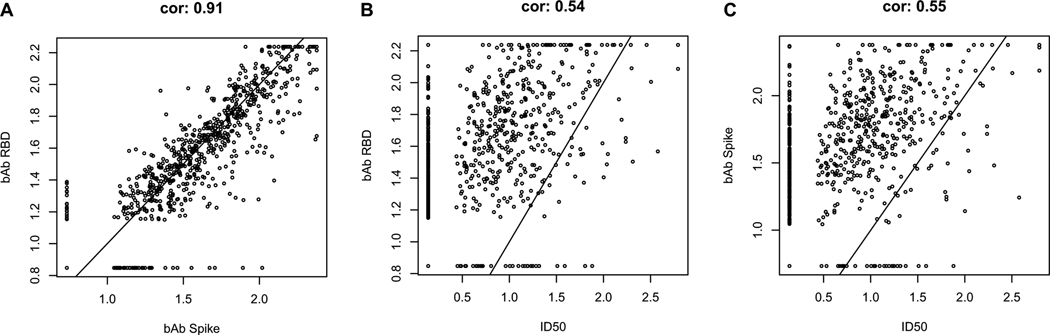
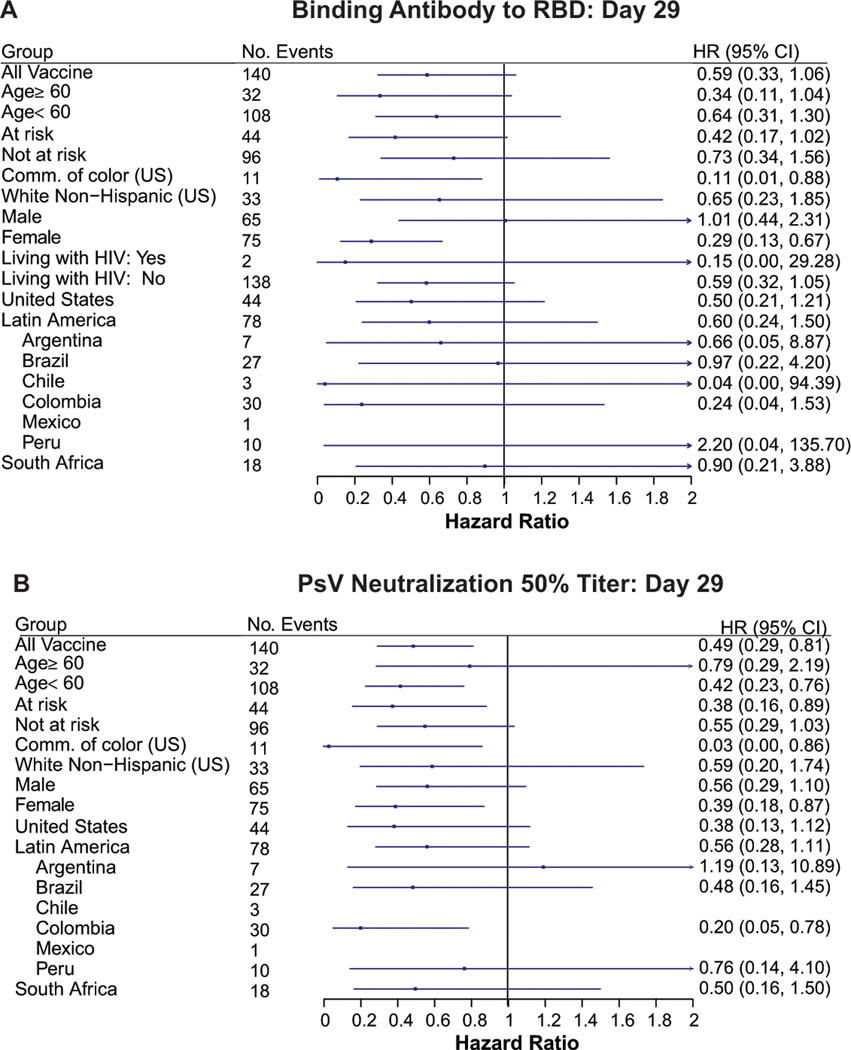
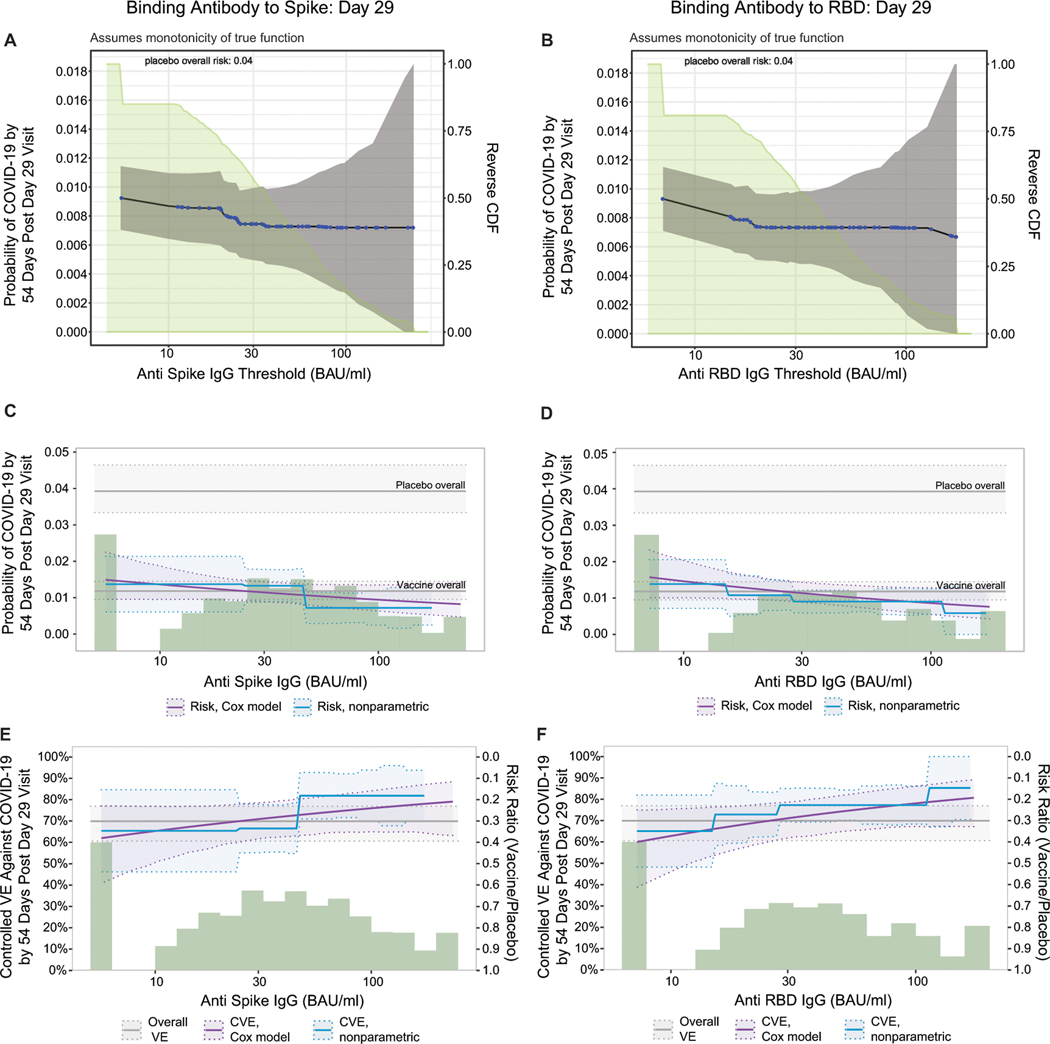
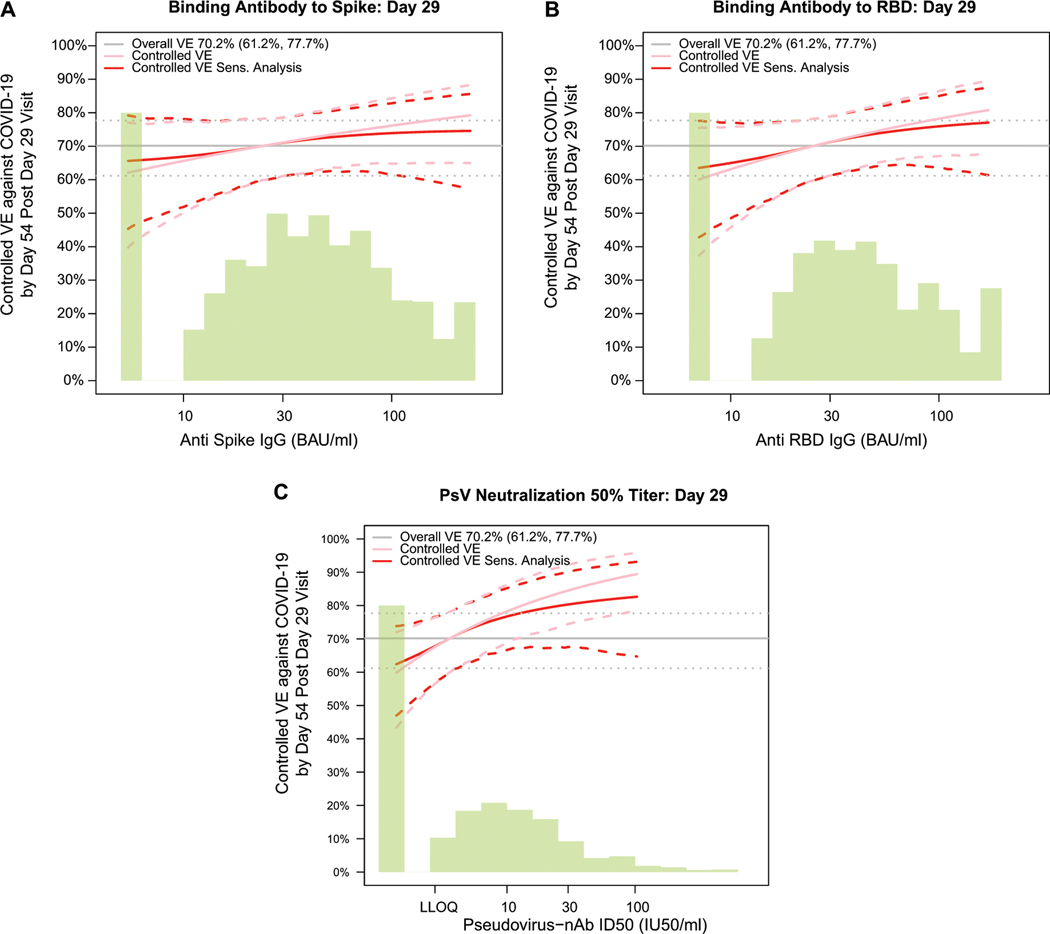
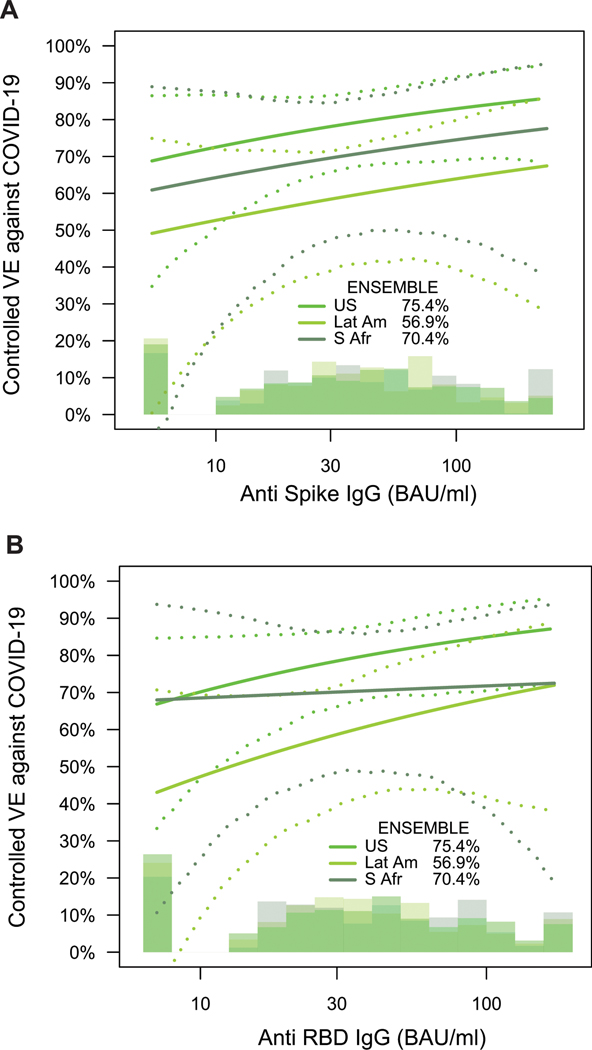
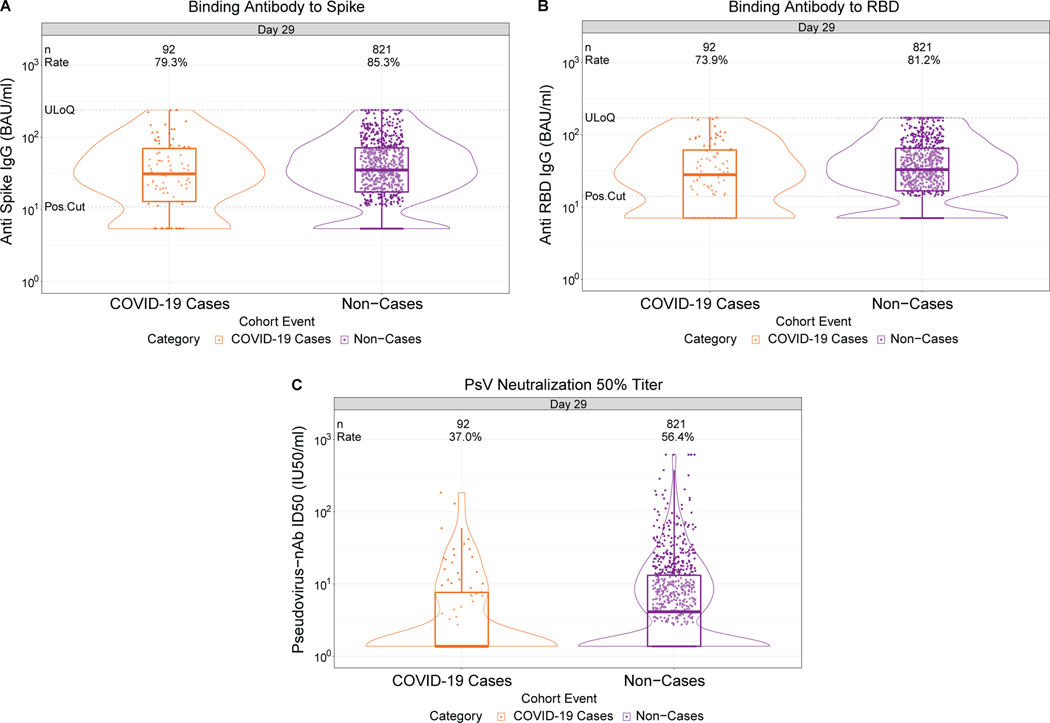
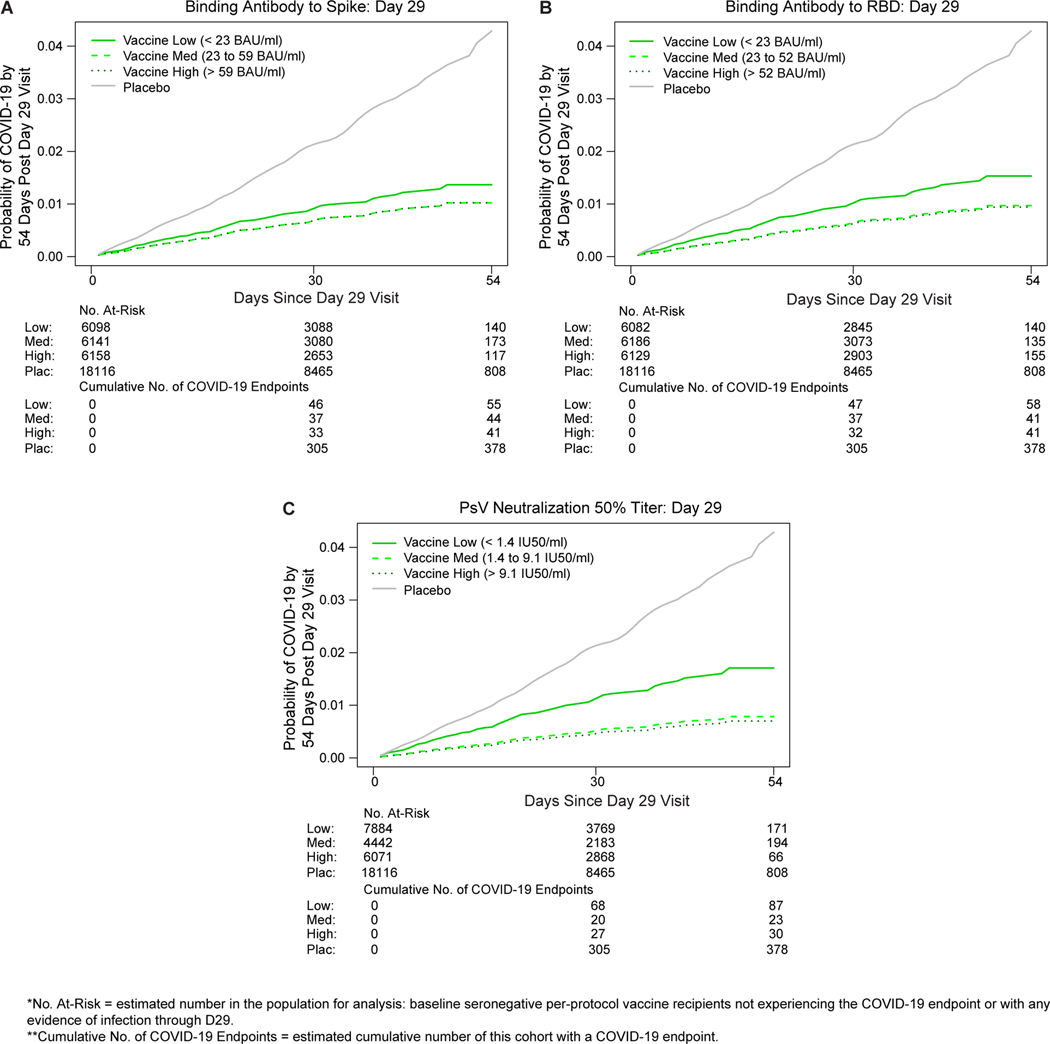
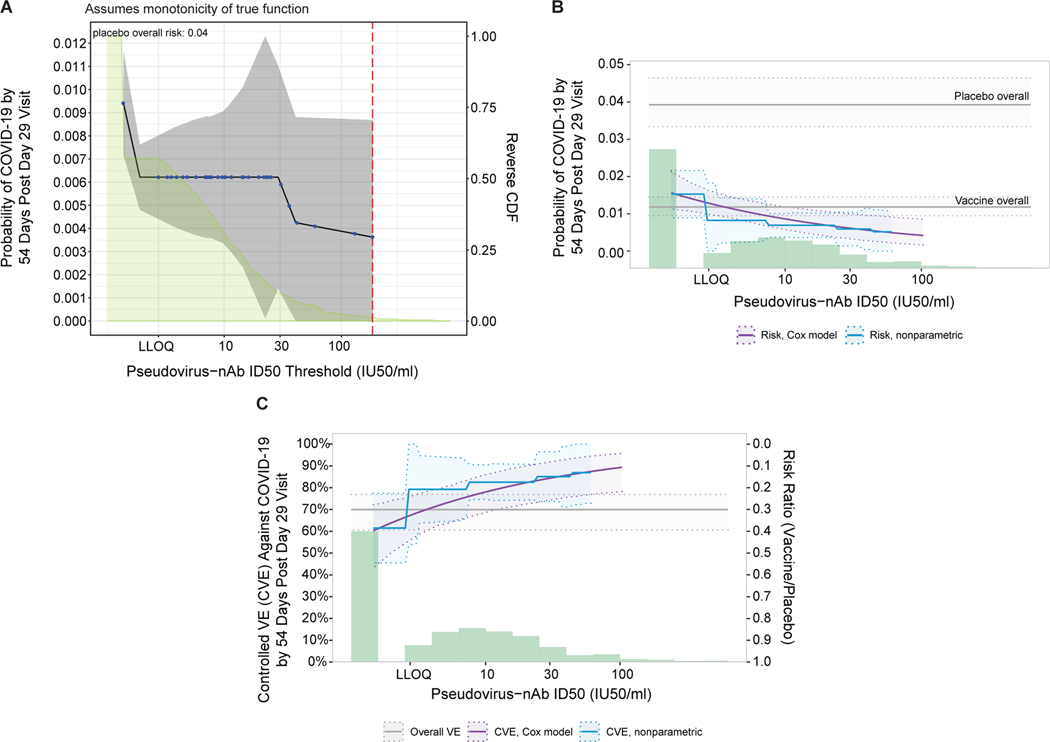
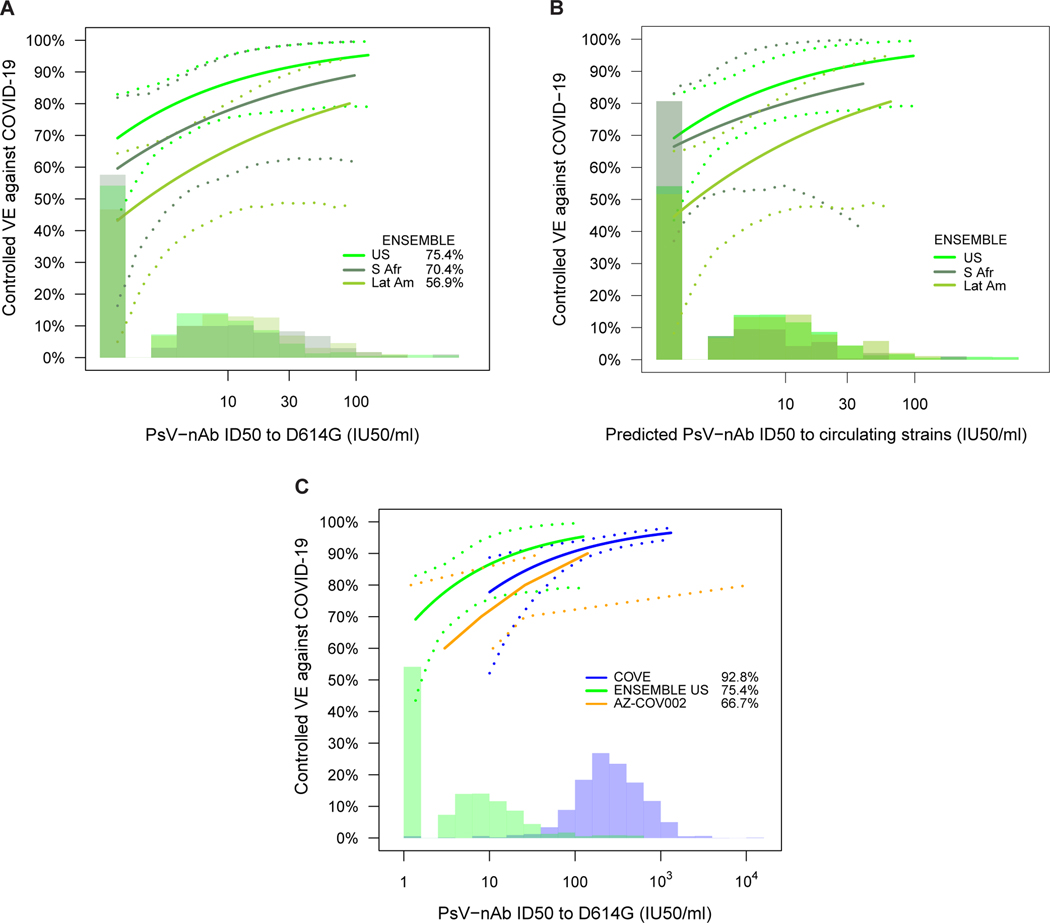
Measuring immune correlates of disease acquisition and protection in the context of a clinical trial is a prerequisite for improved vaccine design. We analysed binding and neutralizing antibody measurements 4 weeks post vaccination as correlates of risk of moderate to severe-critical COVID-19 through 83 d post vaccination in the phase 3, double-blind placebo-controlled phase of ENSEMBLE, an international randomized efficacy trial of a single dose of Ad26.COV2.S. We also evaluated correlates of protection in the trial cohort. Of the three antibody immune markers we measured, we found most support for 50% inhibitory dilution (ID50) neutralizing antibody titre as a correlate of risk and of protection. The outcome hazard ratio was 0.49 (95% confidence interval 0.29, 0.81; P = 0.006) per 10-fold increase in ID50; vaccine efficacy was 60% (43%, 72%) at non-quantifiable ID50 (<2.7 IU50 ml-1) and increased to 89% (78%, 96%) at ID50 = 96.3 IU50 ml-1. Comparison of the vaccine efficacy by ID50 titre curves for ENSEMBLE-US, the COVE trial of the mRNA-1273 vaccine and the COV002-UK trial of the AZD1222 vaccine supported the ID50 titre as a correlate of protection across trials and vaccine types.

Trial registration: ClinicalTrials.gov NCT04505722.


Figures

Extended Data Fig. 1:
Case-cohort set and trial timeline.
Extended Data Fig. 2:
Flowchart of study participants.
Extended Data Fig. 3:
D29 antibody marker level in participants in Latin America by COVID-19 outcome status.
Extended Data Fig. 4:
D29 antibody marker level in participants in South Africa by COVID-19 outcome status.
Extended Data Fig. 5:
D29 antibody marker level in participants in the United States by COVID-19 outcome status.
Extended Data Fig. 6:
Correlations of D29 antibody markers in baseline SARS-CoV-2 seronegative per-protocol vaccine recipients in the immunogenicity subcohort.
Extended Data Fig. 7:
Covariate-adjusted hazard ratios of COVID-19 per 10-fold increase in each Day 29 antibody marker in baseline SARS-CoV-2 seronegative per-protocol vaccine recipients in subgroups.
Extended Data Fig. 8:
Analyses of spike IgG and receptor binding domain (RBD) IgG as correlates of risk and as correlates of protection.
Extended Data Fig. 9:
Vaccine efficacy with sensitivity analysis by D29 (A) anti-spike IgG concentration, (B) anti-receptor binding domain (RBD) IgG concentration, or (C) pseudovirus (PsV) neutralization ID50 titer.
Extended Data Fig. 10:
Vaccine efficacy (solid lines) in baseline SARS-CoV-2 seronegative per-protocol vaccine recipients by A) D29 spike IgG or B) D29 receptor binding domain (RBD) IgG in ENSEMBLE by geographic region (US, United States; Lat Am, Latin America; S Afr, South Africa), estimated using the Cox proportional hazards implementation of Gilbert et al.44
Fig. 1.
Fig. 1.. D29 antibody marker level by COVID-19 outcome status.
(A) Anti-spike IgG concentration, (B) anti-receptor binding domain (RBD) IgG concentration, and (C) pseudovirus (PsV) neutralization ID50 titer. Data points are from baseline SARS-CoV-2 seronegative per-protocol vaccine recipients in the set [(A-C): N=92 cases, 821 non-cases]. The violin plots contain interior box plots with upper and lower horizontal edges the 25th and 75th percentiles of antibody level and middle line the 50th percentile, and vertical bars the distance from the 25th (or 75th) percentile of antibody level and the minimum (or maximum) antibody level within the 25th (or 75th) percentile of antibody level minus (or plus) 1.5 times the interquartile range. At both sides of the box, a rotated probability density curve estimated by a kernel density estimator with a default Gaussian kernel is plotted. Frequencies of participants with detectable responses were computed with inverse probability of sampling weighting. Pos.Cut, Dectectability/Positivity cut-off. Detectable response for spike IgG was defined by IgG > 10.8424 BAU/ml and for RBD IgG was defined by IgG > 14.0858 BAU/ml. ULoQ, upper limit of quantitation. ULoQ = 238.1165 BAU/ml for spike IgG and 172.5755 BAU/ml for RBD IgG. LLoQ, lower limit of quantitation. Seroresponse for ID50 was defined by a quantifiable value > LLoQ (2.7426 IU50/ml). ULoQ = 619.3052 IU50/ml for ID50. Cases are baseline SARS-CoV-2 seronegative per-protocol vaccine recipients with the primary COVID-19 endpoint (moderate to severe-critical COVID-19 with onset both ≥ 1 day post D29 and ≥ 28 days post-vaccination) up to 54 days post D29 but no later than January 22, 2021.
Fig. 2.
Fig. 2.. COVID-19 risk by D29 antibody marker level.
The plots show covariate-adjusted cumulative incidence of COVID-19 by Low, Medium, High tertile of D29 antibody marker level in baseline SARS-CoV-2 seronegative per-protocol participants. (A) Anti-spike IgG concentration; (B) anti-receptor binding domain (RBD) IgG concentration; (C) pseudovirus (PsV) neutralization ID50 titer. Baseline covariates adjusted for were baseline risk score and geographic region.
Fig. 3.
Fig. 3.. Analyses of D29 ID50 titer as a correlate of risk and as a correlate of protection.
Analyses were performed in baseline SARS-CoV-2 seronegative per-protocol vaccine recipients. (A) Covariate-adjusted cumulative incidence of COVID-19 by 54 days post D29 by D29 ID50 titer above a threshold. The blue dots are point estimates at each COVID-19 primary endpoint linearly interpolated by solid black lines; the gray shaded area is pointwise 95% confidence intervals (CIs). The estimates and CIs were adjusted using the assumption that the true threshold-response is nonincreasing. The upper boundary of the green shaded area is the estimate of the reverse cumulative distribution function (CDF) of D29 ID50 titer. The vertical red dashed line is the D29 ID50 threshold above which no COVID-19 endpoints occurred (in the time frame of 1 to 54 days post D29). (B) Covariate-adjusted cumulative incidence of COVID-19 by 54 days post D29 by D29 ID50 titer, estimated using (solid purple line) a Cox model or (solid blue line) a nonparametric method. Each point on the curve represents the covariate-adjusted cumulative COVID-19 incidence at the given D29 ID50 titer value. The dotted black lines indicate bootstrap point-wise 95% CIs. The upper and lower horizontal gray lines are the overall cumulative incidence of COVID-19 from 1 to 54 days post D29 in placebo and vaccine recipients, respectively. (C) Vaccine efficacy (solid purple line) by D29 ID50 titer, estimated using a Cox proportional hazards implementation of Gilbert et al. Each point on the curve represents the vaccine efficacy at the given D29 ID50 titer value. The dashed black lines indicate bootstrap point-wise 95% CIs. Vaccine efficacy (solid blue line) by Day 29 ID50 titer, estimated using a nonparametric implementation of Gilbert et al. (described in the SAP). The blue shaded area represents the 95% CIs. In (B) and (C), the green histogram is an estimate of the density of Day 29 ID50 titer and the horizontal gray line is the overall vaccine efficacy from 1 to 54 days post D29, with the dotted gray lines indicating the 95% CIs. Baseline covariates adjusted for were baseline risk score and geographic region. LLOQ, limit of quantitation. In (B, C), curves are plotted over the range from LLOQ/2 to the 97.5th percentile = 96.3 IU50/ml.
Fig. 4.
Fig. 4.. Vaccine efficacy (solid lines) in baseline SARS-CoV-2 seronegative per-protocol vaccine recipients by A) D29 pseudovirus (PsV)-nAb ID50 titer to D614G in ENSEMBLE by geographic region (US, United States; Lat Am, Latin America; S Afr, South Africa); B) D29 predicted geometric mean PsV-nAb ID50 titer to strains that circulated during follow-up in each designated geographic region (see Supplementary Note 2); and C), D57 ID50 titer to D614G in COVE, D29 ID50 titer to D614G in ENSEMBLE (US), D56 ID50 titer to D614G in COV002, all estimated using the Cox proportional hazards implementation of Gilbert et al.
The dashed lines indicate bootstrap point-wise 95% CIs. The follow-up periods for the VE assessment were: A) ENSEMBLE-US, 1 to 53 days post D29; ENSEMBLE-Lat Am, 1 to 48 days post D29; ENSEMBLE-S Afr, 1 to 40 days post D29; B) COVE (doses D1, D29), 7 to 100 days post D57; ENSEMBLE-US, 1 to 53 days post D29; COV002 (doses D0, D28; VE defined as 1-relative risk of whether or not an event occurred = 28 days post-D28 till the end of the study period). The histograms are an estimate of the density of D29 ID50 titer in ENSEMBLE (including by geographic region in A, B). The blue histograms are an estimate of the density of ID50 titer in baseline SARS-CoV-2 negative per-protocol vaccine recipients in COVE. Curves are plotted over the range from 10 IU50/ml to 97.5th percentile of marker for COVE and from 2.5th percentile to 97.5th percentile for ENSEMBLE. Baseline covariates adjusted for were: ENSEMBLE, baseline risk score and geographic region; COVE: baseline risk score, comorbidity status, and Community of color status; COV002: baseline risk score.

Update of

  • Immune Correlates Analysis of a Single Ad26.COV2.S Dose in the ENSEMBLE COVID-19 Vaccine Efficacy Clinical Trial.
    Fong Y, McDermott AB, Benkeser D, Roels S, Stieh DJ, Vandebosch A, Gars ML, Van Roey GA, Houchens CR, Martins K, Jayashankar L, Castellino F, Amoa-Awua O, Basappa M, Flach B, Lin BC, Moore C, Naisan M, Naqvi M, Narpala S, O'Connell S, Mueller A, Serebryannyy L, Castro M, Wang J, Petropoulos CJ, Luedtke A, Hyrien O, Lu Y, Yu C, Borate B, van der Laan LWP, Hejazi NS, Kenny A, Carone M, Wolfe DN, Sadoff J, Gray GE, Grinsztejn B, Goepfert PA, Little SJ, de Sousa LP, Maboa R, Randhawa AK, Andrasik MP, Hendriks J, Truyers C, Struyf F, Schuitemaker H, Douoguih M, Kublin JG, Corey L, Neuzil KM, Carpp LN, Follmann D, Gilbert PB, Koup RA, Donis RO; Janssen Team; Coronavirus Vaccine Prevention Network (CoVPN)/ENSEMBLE Team; United States Government (USG)/CoVPN Biostatistics Team. Fong Y, et al. medRxiv [Preprint]. 2022 Apr 12:2022.04.06.22272763. doi: 10.1101/2022.04.06.22272763. medRxiv. 2022. Update in: Nat Microbiol. 2022 Dec;7(12):1996-2010. doi: 10.1038/s41564-022-01262-1. PMID: 35441174 Free PMC article. Updated. Preprint.

References

    1. Sadoff J, Gray G, Vandebosch A, et al. Safety and Efficacy of Single-Dose Ad26.COV2.S Vaccine against Covid-19. N Engl J Med 2021; 384(23): 2187–201. - PMC - PubMed
    1. Sadoff J, Gray G, Vandebosch A, et al. Final Analysis of Efficacy and Safety of Single-Dose Ad26.COV2.S. N Engl J Med 2022; 386(9): 847–60. - PMC - PubMed
    1. US Food and Drug Administration. Janssen COVID-19 Vaccine. https://www.fda.gov/emergency-preparedness-and-response/coronavirus-dise... Last updated 19 Jan, 2022. Access date 23 Jan, 2022.
    1. World Health Organization. COVID-19 vaccines WHO EUL issued. https://extranet.who.int/pqweb/vaccines/vaccinescovid-19-vaccine-eul-issued Access date 24 Jan, 2022.
    1. European Commission. European Commission authorises fourth safe and effective vaccine against COVID-19. Press release. 11 March 2021. https://ec.europa.eu/commission/presscorner/detail/en/ip_21_1085 Access date 24 Jan, 2022.

Publication types

Associated data