. 2022 Dec;7(12):2011-2024.
doi: 10.1038/s41564-022-01268-9. Epub 2022 Nov 10.

Divergent SARS-CoV-2 variant emerges in white-tailed deer with deer-to-human transmission

Affiliations

Divergent SARS-CoV-2 variant emerges in white-tailed deer with deer-to-human transmission

Bradley Pickering et al. Nat Microbiol. 2022 Dec.

Erratum in

  • Publisher Correction: Divergent SARS-CoV-2 variant emerges in white-tailed deer with deer-to-human transmission.
    Pickering B, Lung O, Maguire F, Kruczkiewicz P, Kotwa JD, Buchanan T, Gagnier M, Guthrie JL, Jardine CM, Marchand-Austin A, Massé A, McClinchey H, Nirmalarajah K, Aftanas P, Blais-Savoie J, Chee HY, Chien E, Yim W, Banete A, Griffin BD, Yip L, Goolia M, Suderman M, Pinette M, Smith G, Sullivan D, Rudar J, Vernygora O, Adey E, Nebroski M, Goyette G, Finzi A, Laroche G, Ariana A, Vahkal B, Côté M, McGeer AJ, Nituch L, Mubareka S, Bowman J. Pickering B, et al. Nat Microbiol. 2023 Jan;8(1):188. doi: 10.1038/s41564-022-01298-3. Nat Microbiol. 2023. PMID: 36509933 Free PMC article. No abstract available.

Abstract

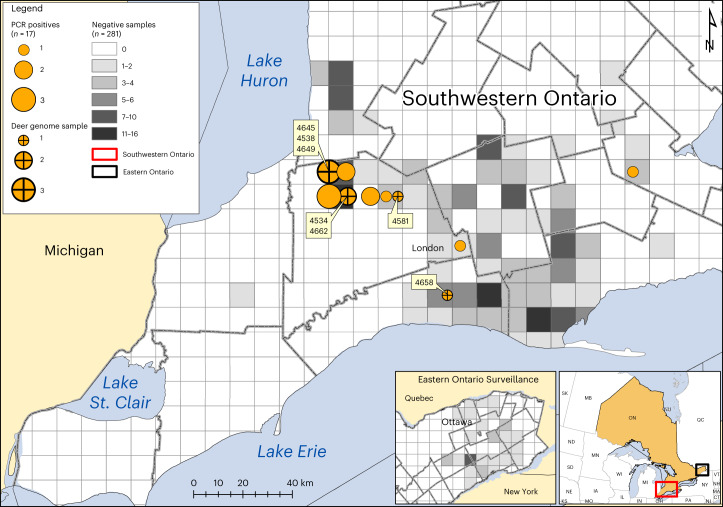
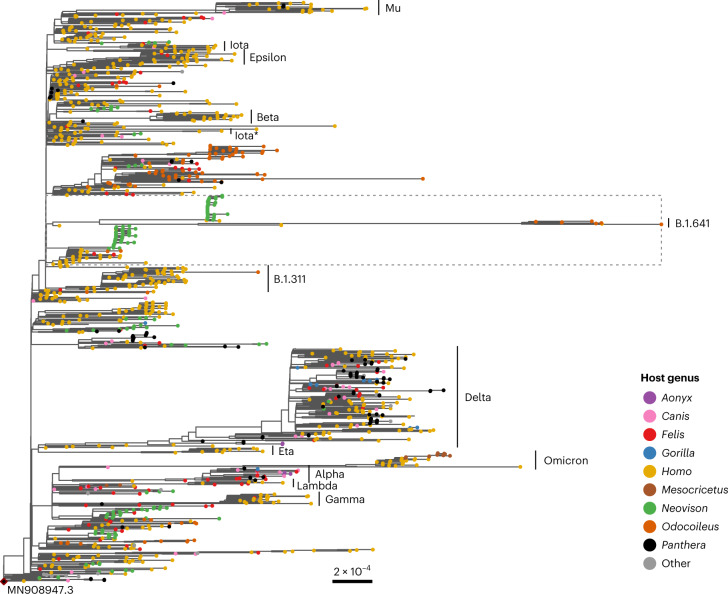
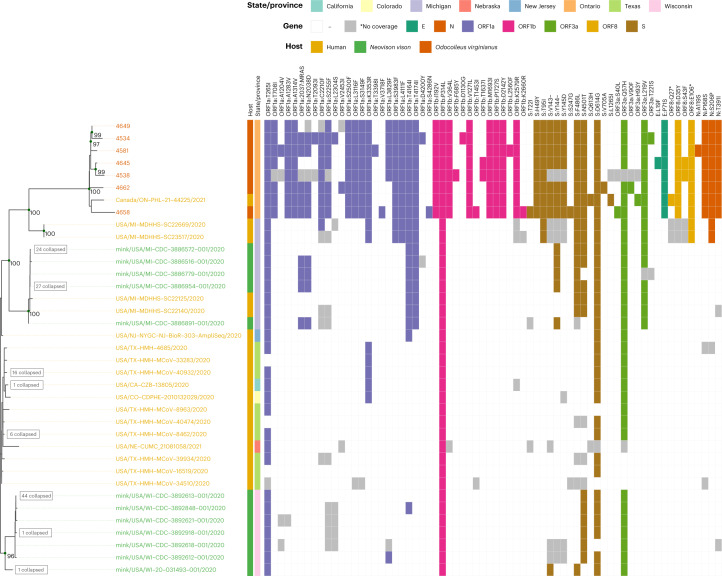
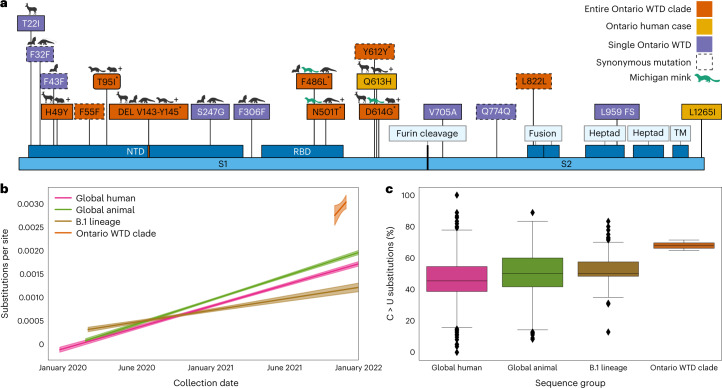
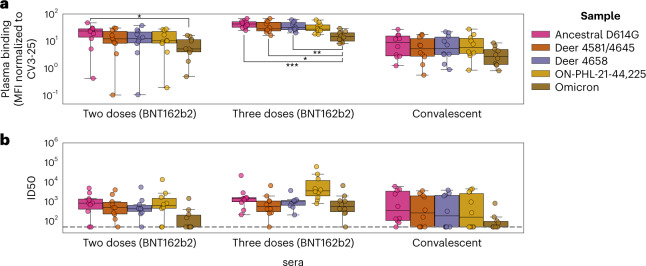
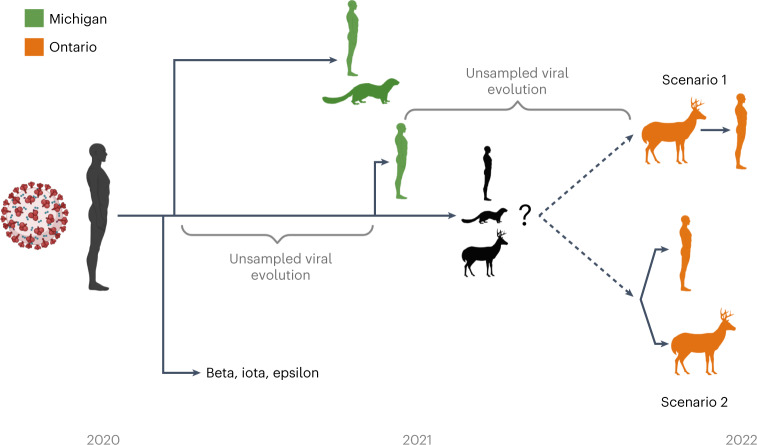
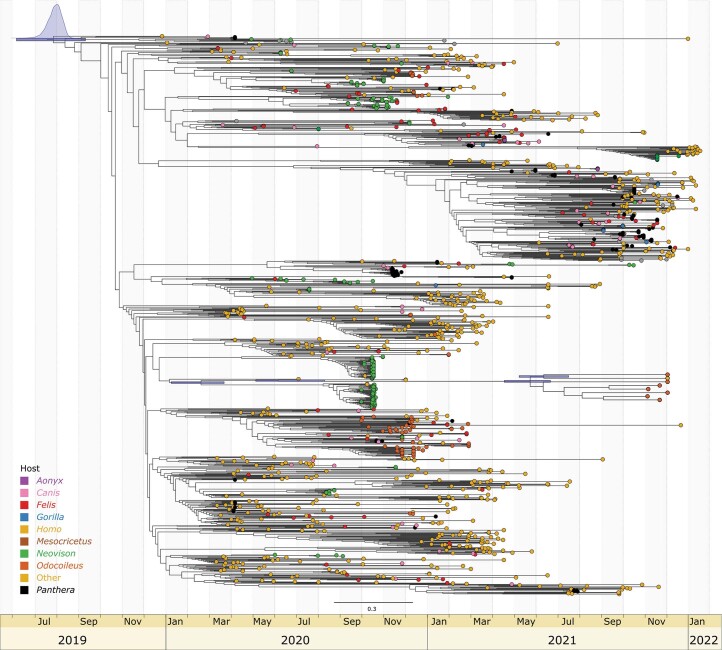
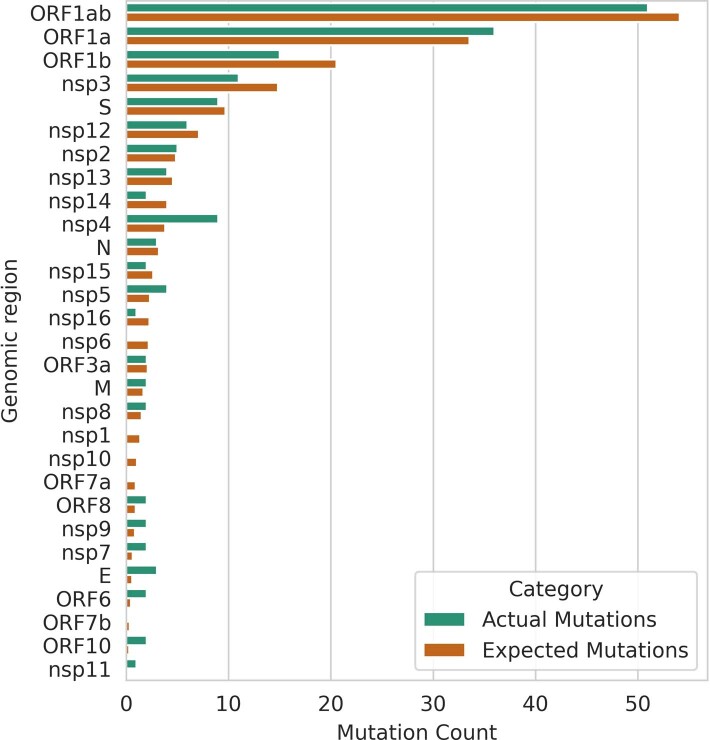
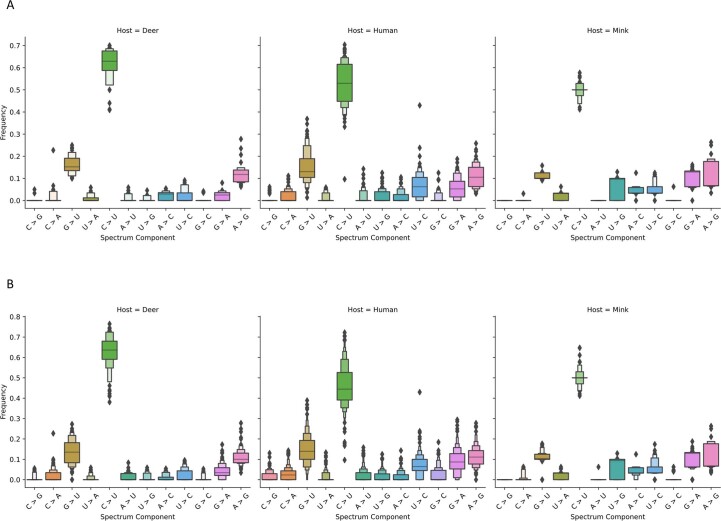
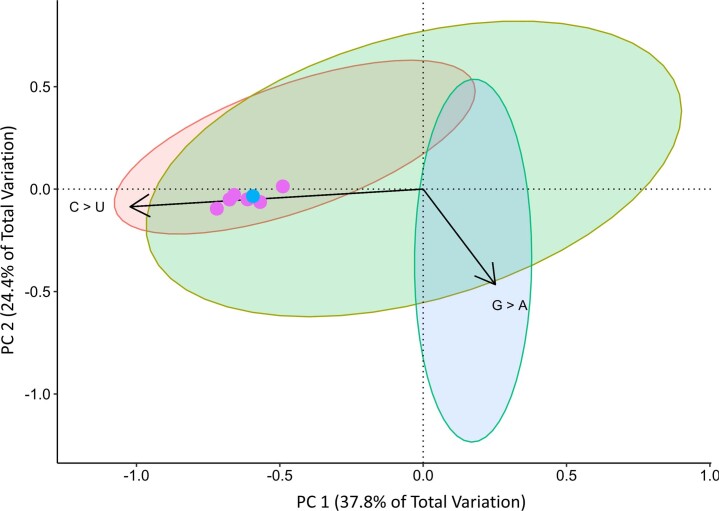
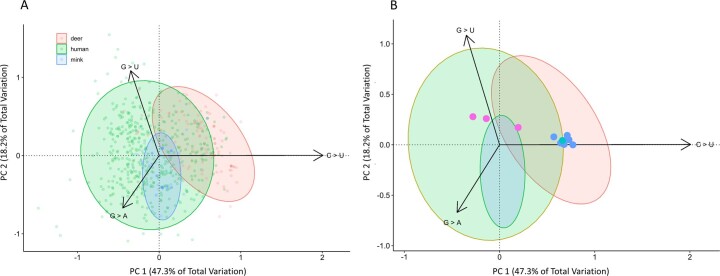
Wildlife reservoirs of broad-host-range viruses have the potential to enable evolution of viral variants that can emerge to infect humans. In North America, there is phylogenomic evidence of continual transmission of severe acute respiratory syndrome coronavirus 2 (SARS-CoV-2) from humans to white-tailed deer (Odocoileus virginianus) through unknown means, but no evidence of transmission from deer to humans. We carried out an observational surveillance study in Ontario, Canada during November and December 2021 (n = 300 deer) and identified a highly divergent lineage of SARS-CoV-2 in white-tailed deer (B.1.641). This lineage is one of the most divergent SARS-CoV-2 lineages identified so far, with 76 mutations (including 37 previously associated with non-human mammalian hosts). From a set of five complete and two partial deer-derived viral genomes we applied phylogenomic, recombination, selection and mutation spectrum analyses, which provided evidence for evolution and transmission in deer and a shared ancestry with mink-derived virus. Our analysis also revealed an epidemiologically linked human infection. Taken together, our findings provide evidence for sustained evolution of SARS-CoV-2 in white-tailed deer and of deer-to-human transmission.


Conflict of interest statement

The authors declare no competing interests.

Figures

Fig. 1
Fig. 1. SARS-CoV-2 in white-tailed deer sampled in Ontario, 2021.
Circle size indicates the relative number of positive white-tailed deer (n = 17/298), with crosses showing samples from which viral genomes were recovered (n = 7). Four-digit genomic sequence ID labels are shown in yellow boxes. Location of negative samples are indicated using grey as per the legend. The detailed map depicts Southwestern Ontario (red rectangle on inset map). SARS-CoV-2 RNA was not detected in samples from Eastern Ontario.
Fig. 2
Fig. 2. ML phylogeny of white-tailed deer viral genomes.
Included are Ontario deer-derived genomes and an associated human sample (which have been collectively designated as lineage B.1.641) and a representative sample of the global diversity of human and animal-derived SARS-CoV-2 (n = 3,645). This phylogeny represents all non-human animal-derived samples (with the exception of domestic mink from Europe, which were subsampled) in GISAID at the time of sampling along with a representative subsample of human-derived genomes. VOCs and variants previously designated as variants under investigation within the tree are annotated and nodes are coloured by host genus (as indicated in the legend). The dotted line indicates the samples selected for the local ML analysis (Fig. 3).
Fig. 3
Fig. 3. Phylogeny of the B.1.641 Ontario white-tailed deer lineage.
Genomes are annotated with the presence/absence of amino acid mutations relative to SARS-CoV-2 Wuhan Hu-1. Genomes were selected to characterize the relationship between Ontario white-tailed deer samples, the related Ontario human sample and closest B.1 human and mink samples from Michigan, United States (dotted segment in Fig. 2). Internal nodes in the phylogeny are annotated with UFB values ≥95%, and leaves with identical amino acid profiles were collapsed as indicated. Host species for each sample is shown by the leaf label colour and first annotation column as per the legend, with geographic location in the second annotation column. Amino acid mutations are coloured by corresponding gene, with grey indicating sites that were too poorly covered to determine presence/absence (for example, sites in partial deer-derived genomes 4538 and 4534).
Fig. 4
Fig. 4. Evolution of the B.1.641 Ontario white-tailed deer lineage.
Evolution of the B.1.641 lineage is presented relative to other animal-derived genomes, the ancestral B.1 lineage and the global SARS-CoV-2 diversity. a, Spike mutations present within the Ontario white-tailed deer (WTD) lineage. Amino acid changes present in all five Ontario WTD sequences and associated human case (orange); only in the human sample (yellow); and only in a single WTD genome (purple). Animal symbols indicate mutations in bat-, deer-, pangolin- and hamster-derived SARS-CoV-2 sequences. ‘+’ indicates presence of the mutation in additional non-human animal species, and green indicates those in Michigan mink samples. ‘*’ indicates spike mutations that were inferred to have originated subsequent to the divergence of B.1.641 from their MRCA with the Michigan-derived human samples. Spike annotations were derived from UniProt P0DTC2 (DEL, deletion; FS, frameshift; TM, transmembrane; RBD, receptor binding domain; NTD, N-terminal domain) and are not shown to scale. A complete list of mutations from across the entire genome can be found in Supplementary Table 2. b, Root-to-tip regression analysis based on the representative SARS-CoV-2 diversity in the global ML phylogeny (Fig. 2). Substitutions per site per year trends (and 95% confidence intervals) from ordinary least squares regression analyses are shown for all human samples (0.9 × 10−3 to 1.0 × 10−3), animal-derived samples (1.0 × 10−3 to 1.1 × 10−3), the B.1 lineage (0.4 × 10−3 to 0.6 × 10−3) and the Ontario WTD clade (0 to 8 × 10−3). c, Consensus substitutions (%) corresponding to a change from a reference C allele to an alternative U allele. Boxes represents the 25% quartile, median and 75% quartile, with error bars capturing the minimum and maximum values within 1.5× interquartile range. This was calculated from consensus sequences across a subsample of global human SARS-CoV-2 diversity (earliest and most recent genomes from each PANGO lineage, n = 3,127), global animal diversity (all animal genomes in GISAID at time of sampling, n = 1,522), B.1 lineage (all genomes assigned to this lineage in GISAID as of January 2022, n = 206) and B.1.641.
Fig. 5
Fig. 5. Neutralization of the B.1.641 Ontario white-tailed deer spike.
a, 293T cells transfected with plasmids encoding the indicated spike variants were incubated with 1:250 diluted plasma from vaccinated (two or three doses of BNT162b2), convalescent or naïve individuals (n = 10 for each group) or with the conformationally independent anti-S2 CV3-25 antibody, followed by staining with fluorescently labelled anti-human IgG and flow cytometry analysis. MFI was normalized by surface expression of spike variants on the basis of CV3-25 binding (Supplementary Table 5). Differences in MFI between Omicron and ancestral D614G samples were significant for two-dose (P = 0.0284) and three-dose (P = 0.001) sera. Similarly, Omicron versus deer 4581/4645 (P = 0.0157) and deer 4658 (P = 0.0097) were significant for three-dose sera. b, Lentiviral pseudotypes encoding luciferase and harbouring the indicated spike variants were incubated with serial dilutions of plasma for 1 h at 37 °C and then used to infect 293T-ACE2. Infection was measured by quantitating luciferase activity 72 h post-infection. Neutralization ID50 for the sera from vaccinated or convalescent individuals was determined using a normalized non-linear regression using GraphPad Prism (Supplementary Table 6). Limit of detection is indicated by a dotted line (ID50 = 50). Distributions across replicates are represented by box plots with a central median value and whiskers showing the 1.5× interquartile range. Significant group differences (from Welch’s one-way ANOVA with Tukey’s post hoc testing) are indicated using brackets and asterisks (*P < 0.05, **P < 0.01, ***P < 0.001).
Fig. 6
Fig. 6. Hypothetical zoonoses and evolution of the B.1.641 lineage.
The timeline and approximate relationship between the Beta VOC (bold), Iota/Epsilon former VUIs, and viral samples in white-tailed deer, humans and mink from both Michigan (green) and Ontario (orange) are displayed. As it likely emerged during one of the indicated poorly sampled periods of viral evolution, it is unclear whether the viral ancestor of B.1.641 was from an unknown animal (for example, mink, white-tailed deer or other species) or human reservoir. From this ancestor, there was either a spillback transmission from deer to human (scenario 1) or the emergence of a virus infecting both human and deer (scenario 2).
Extended Data Fig. 1
Extended Data Fig. 1. A BEAST inferred time tree of B.1.641.
The tree was estimated using a HKY + G4 substitution model, log-normal distributed clock rates based on a strict molecular clock of 9.5 × 10−4 (inferred from tip-to-root regression) and a constant-sized coalescent. Analysis was performed used a fixed topology derived from the global ML analysis with internal node heights (and root height) inferred by BEAST. The 95% HPD node bars are shown in blue for the tree root and selected nodes of interest.
Extended Data Fig. 2
Extended Data Fig. 2. Distribution of conserved mutations in B.1.641.
Observed vs expected mutation counts (if uniformly distributed according to gene-length) within shared B.1.641 mutations for each gene/product.
Extended Data Fig. 3
Extended Data Fig. 3. Comparing mutational spectra among hosts.
Boxen plots illustrating differences in the mutational spectra among hosts when considering only (a) clade 20 C (ndeer = 42, nmink = 91, nhuman = 108) and (b) all clades (ndeer = 105, nmink = 432, nhuman = 103). These plots show differences in both the frequency and overall distribution of each mutation within each host species. Samples from each host species were isolated from individuals in North America. The measure of center for each plot is the 50th percentile. The first boxes above and below the 50th percentile represent 50% of the data and each additional box accounts for one-quarter of the remaining data. The total number of boxes and outliers (diamonds) are determined using Tukey’s method.
Extended Data Fig. 4
Extended Data Fig. 4. Principal Components Analysis of mutational spectra in Clade 20 C.
Principal Components Analysis of the mutational spectra of SARS-CoV-2 genomes isolated from different hosts within Clade 20 C. The first two components account for 62.2% of the variation between the samples. Variation in the spectra along the first principal component associated with changes in the frequency of C > U. Samples appear to be spread along the first component by host-type. Ontario WTD samples (pink) and a human sample from Ontario (blue) appear close together in the projection, suggesting that they share a very similar mutation spectrum.
Extended Data Fig. 5
Extended Data Fig. 5. Principal Component Analysis of the mutational spectra from different SARS-CoV-2 variants.
The first two principal components account for 65.5% of the variation among the samples. Variation in the spectra along the first principal component are associated with changes in the frequency of C > U mutations. Interestingly, samples along this component are also differentiated by host-type. Variation along the second principal component reflect changes in the frequency of G > U and G > A mutations. (A) The biplot showing a projection of all samples. (B) A simplified version of plot A highlighting the positions of white-tailed deer samples isolated from Ontario (Blue) and Quebec (Pink). A human isolate from Ontario appears in the same area of the plot (teal) as Ontario deer samples. Arrows are scaled to 30% of their original size to create a cleaner plot.
Extended Data Fig. 6
Extended Data Fig. 6. Flow cytometry gating strategy for IgG plasma binding analysis.
HEK 293 T cells were identified in forward scatter (FSC) and side scatter (SSC). Single cells (Singlets) were selected for analysis using FSC-A and FSC-H. Cells transfected with SARS-CoV-2 spike protein plasmid were gated (GFP+), negative and auto-fluorescent cells were excluded. Median fluorescence intensity for IgG (AlexaFluor 647-A) was analyzed in GFP + cells. Data was analyzed using FlowJo software.

Comment in

  • Viral spillback.
    Du Toit A. Du Toit A. Nat Rev Microbiol. 2023 Jan;21(1):2. doi: 10.1038/s41579-022-00829-3. Nat Rev Microbiol. 2023. PMID: 36400847 Free PMC article.

Similar articles

Cited by

References

    1. Andersen KG, Rambaut A, Lipkin WI, Holmes EC, Garry RF. The proximal origin of SARS-CoV-2. Nat. Med. 2020;26:450–452. doi: 10.1038/s41591-020-0820-9. - DOI - PMC - PubMed
    1. Boni MF, et al. Evolutionary origins of the SARS-CoV-2 sarbecovirus lineage responsible for the COVID-19 pandemic. Nat. Microbiol. 2020;5:1408–1417. doi: 10.1038/s41564-020-0771-4. - DOI - PubMed
    1. Cui J, Li F, Shi Z-L. Origin and evolution of pathogenic coronaviruses. Nat. Rev. Microbiol. 2019;17:181–192. doi: 10.1038/s41579-018-0118-9. - DOI - PMC - PubMed
    1. Haagmans BL, et al. Middle East respiratory syndrome coronavirus in dromedary camels: an outbreak investigation. Lancet Infect. Dis. 2014;14:140–145. doi: 10.1016/S1473-3099(13)70690-X. - DOI - PMC - PubMed
    1. Hu B, Guo H, Zhou P, Shi Z-L. Characteristics of SARS-CoV-2 and COVID-19. Nat. Rev. Microbiol. 2021;19:141–154. doi: 10.1038/s41579-020-00459-7. - DOI - PMC - PubMed

Publication types

Supplementary concepts