

A comprehensive pan-cancer analysis of necroptosis molecules in four gynecologic cancers
- PMID: 36357839
- PMCID: PMC9650890
- DOI: 10.1186/s12885-022-10166-6
A comprehensive pan-cancer analysis of necroptosis molecules in four gynecologic cancers
Abstract
Background: In recent years, it has been proved that necroptosis plays an important role in the occurrence, development, invasion, metastasis and drug resistance of malignant tumors. Hence, further evaluation and targeting of necroptosis may be of clinical benefit for gynecologic cancers (GCs).
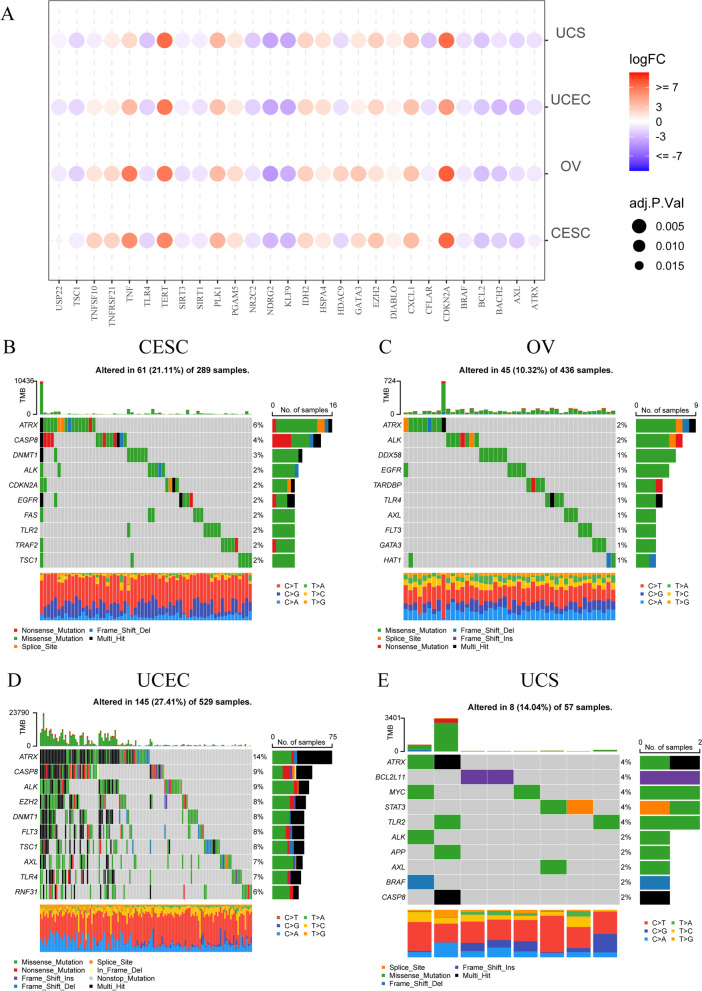
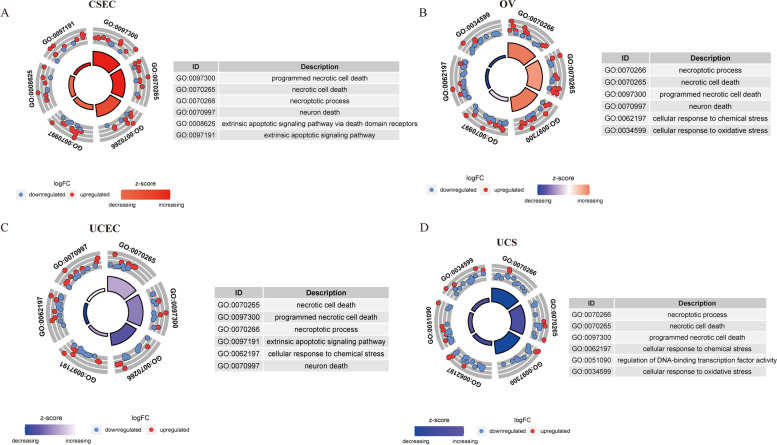
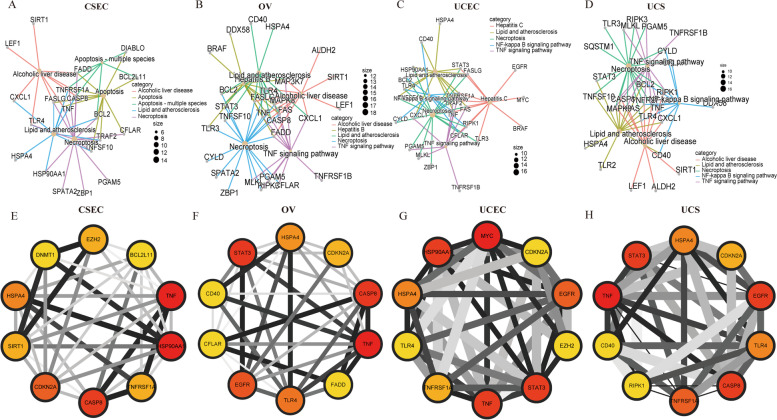
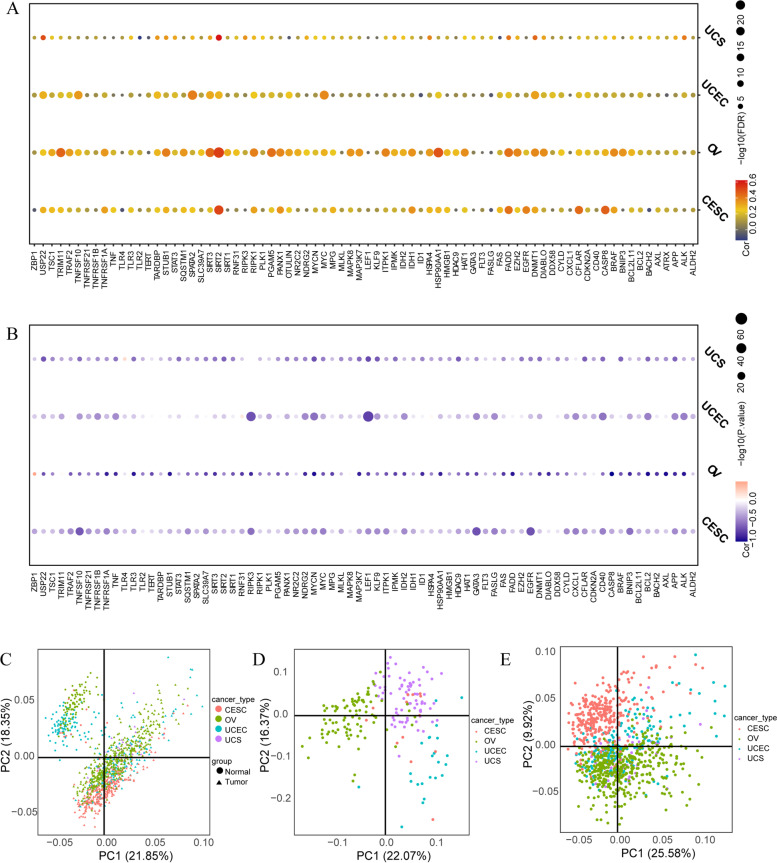
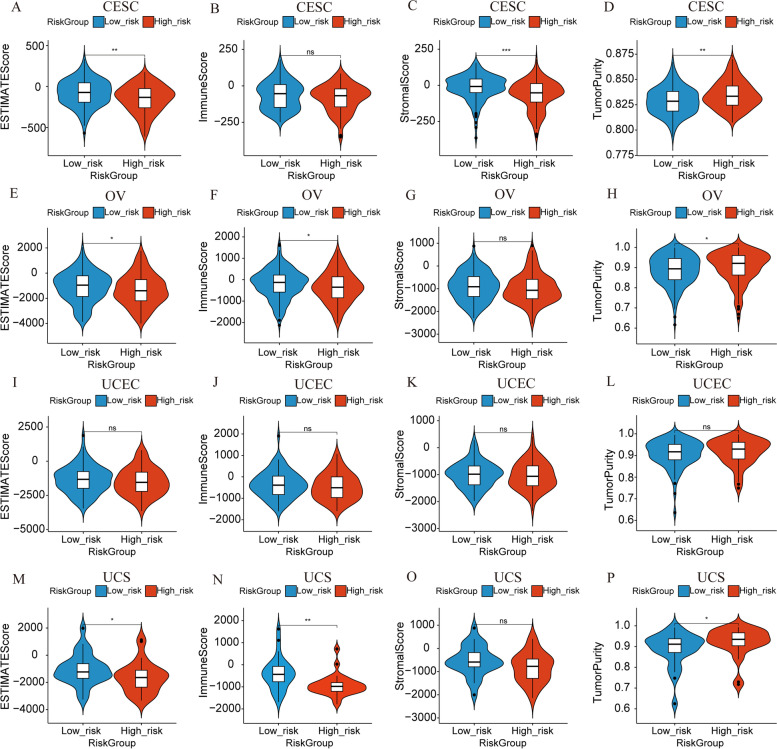
Methods: To compare consistency and difference, we explored the expression pattern and prognostic value of necroptosis-related genes (NRGs) in pan-GC analysis through Linear regression and Empirical Bayesian, Univariate Cox analysis, and public databases from TCGA and Genotype-Tissue Expression (GTEx), including CESC, OV, UCEC, and UCS. We explored the copy number variation (CNV), methylation level and enrichment pathways of NRGs in the four GCs. Based on LASSO Cox regression analysis or principal component analysis, we established the prognostic NRG-signature or necroptosis-score for the four GCs. In addition, we predicted and compared functional pathways, tumor mutational burden (TMB), somatic mutation features, immunity status, immunotherapy, chemotherapeutic drug sensitivity of the NRG-signature based on NRGs. We also examined the expression level of several NRGs in OV samples that we collected using Quantitative Real-time PCR.
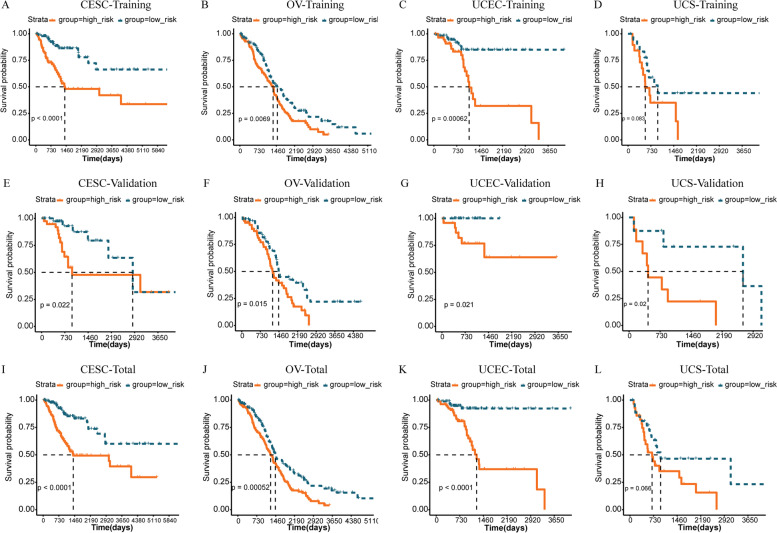
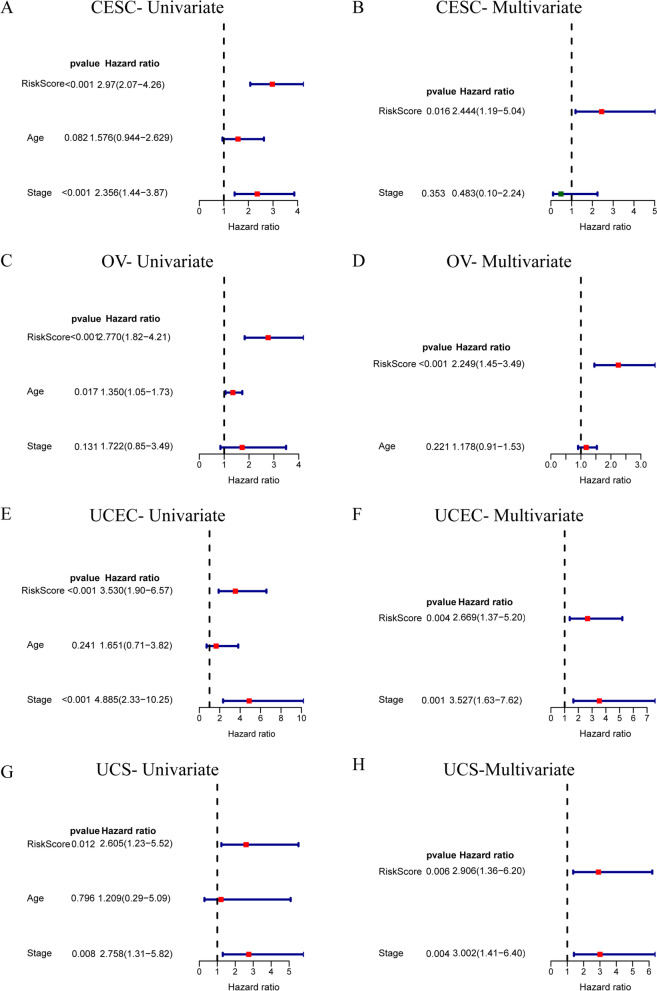
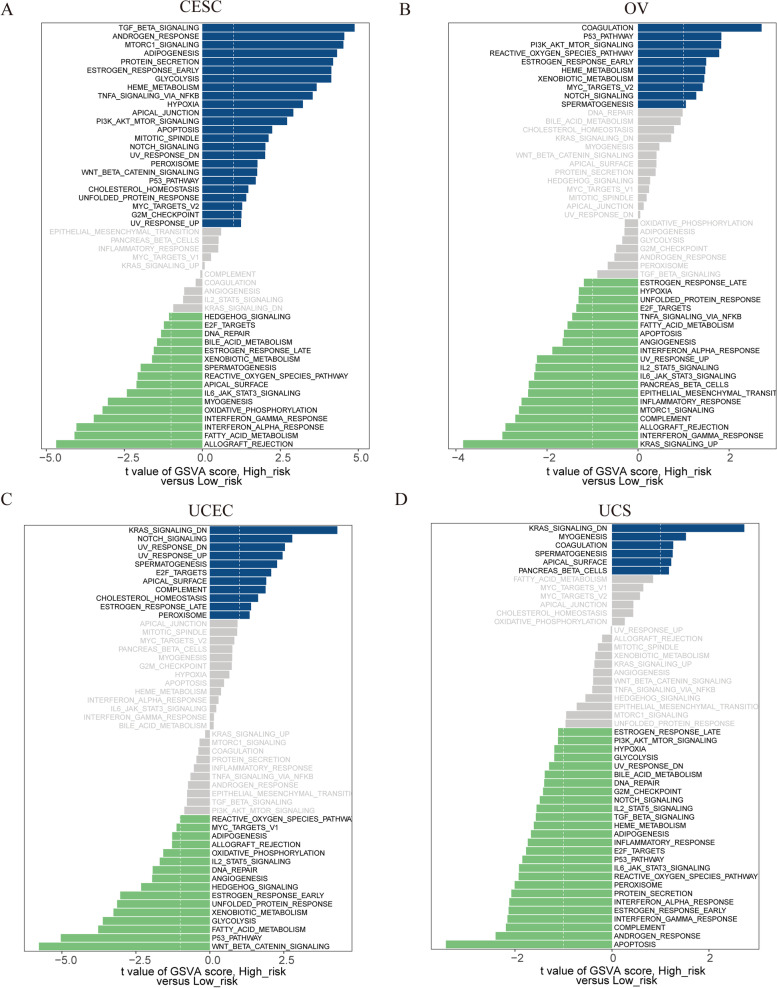
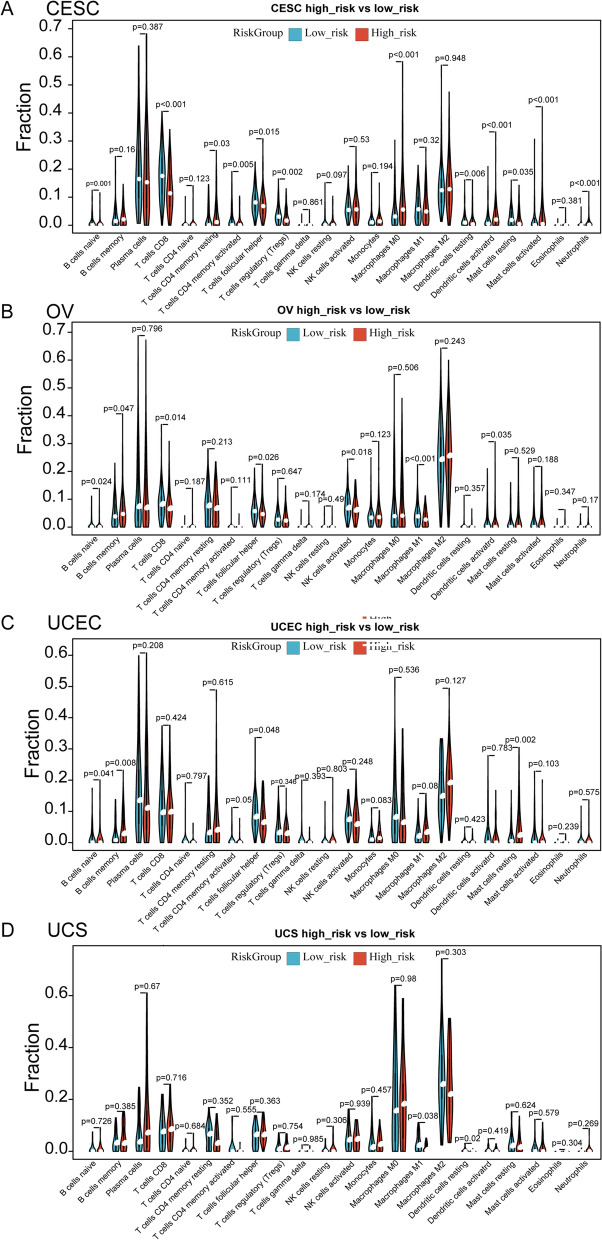
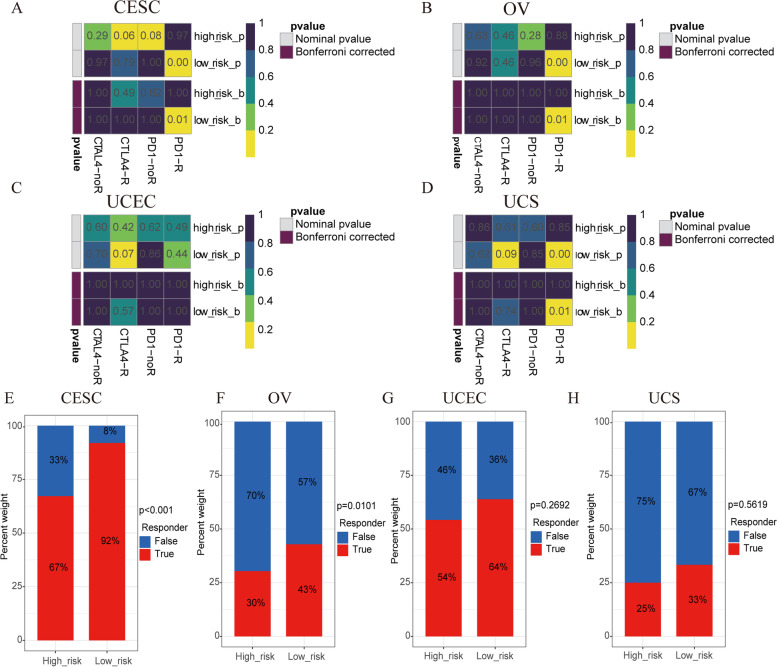
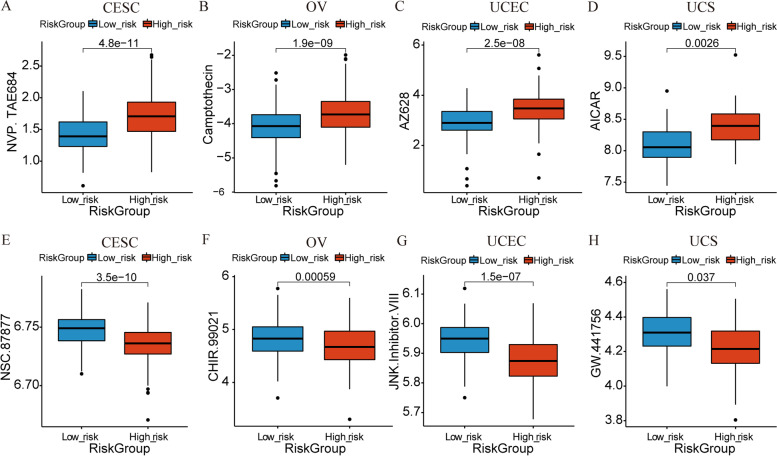
Results: We confirmed the presence of NRGs in expression, prognosis, CNV, and methylation for four GCs, thus comparing the consistency and difference among the four GCs. The prognosis and independent prognostic value of the risk signatures based on NRGs were determined. Through the results of subclass mapping, we found that GC patients with lower risk score may be more sensitive to PDL1 response and more sensitive to immune checkpoint blockade therapy. Drug susceptibility analysis showed that, 51, 45, 64, and 29 drugs with differences between risk groups were yielded in CESC, OV, UCEC, and UCS respectively. For OV, the expression differences of several NRGs in the tissues we collected were similar to that in TCGA.
Conclusion: Our comprehensive analysis of NRGs and NRG-signature demonstrated their similarity and difference, as well as their potential roles in prognosis and could guide therapeutic strategies, thus improving the outcome of GC patients.
Keywords: Gynecologic cancer; Immunity; Immunotherapy; Necroptosis; Prognosis.
© 2022. The Author(s).
Conflict of interest statement
The authors declare that they have no conflicts of interest.
Figures
Similar articles
-
Identification of a necroptosis-related prognostic gene signature associated with tumor immune microenvironment in cervical carcinoma and experimental verification.World J Surg Oncol. 2022 Oct 17;20(1):342. doi: 10.1186/s12957-022-02802-z. World J Surg Oncol. 2022. PMID: 36253777 Free PMC article.
-
Identification of necroptosis-related subtypes and prognosis model in triple negative breast cancer.Front Immunol. 2022 Aug 19;13:964118. doi: 10.3389/fimmu.2022.964118. eCollection 2022. Front Immunol. 2022. PMID: 36059470 Free PMC article.
-
Establishment and Validation of the Novel Necroptosis-related Genes for Predicting Stemness and Immunity of Hepatocellular Carcinoma via Machine-learning Algorithm.Comb Chem High Throughput Screen. 2025;28(1):146-165. doi: 10.2174/0113862073271292231108113547. Comb Chem High Throughput Screen. 2025. PMID: 39641162
-
Establishment of a prognostic model for melanoma based on necroptosis-related genes.Funct Integr Genomics. 2023 Jun 14;23(3):202. doi: 10.1007/s10142-023-01129-6. Funct Integr Genomics. 2023. PMID: 37314547
-
A novel necroptosis-related gene index for predicting prognosis and a cold tumor immune microenvironment in stomach adenocarcinoma.Front Immunol. 2022 Oct 27;13:968165. doi: 10.3389/fimmu.2022.968165. eCollection 2022. Front Immunol. 2022. PMID: 36389725 Free PMC article. Review.
Cited by
-
Glycometabolism and lipid metabolism related genes predict the prognosis of endometrial carcinoma and their effects on tumor cells.BMC Cancer. 2024 May 8;24(1):571. doi: 10.1186/s12885-024-12327-1. BMC Cancer. 2024. PMID: 38720279 Free PMC article.
-
Trends in incidence and mortality for gynaecological cancers in Southeastern China during 2011-2020: a retrospective analysis of registry data.BMJ Open. 2024 Sep 28;14(9):e083336. doi: 10.1136/bmjopen-2023-083336. BMJ Open. 2024. PMID: 39343456 Free PMC article.
-
Revealing the mechanisms of RAC3 in tumor aggressiveness, the immunotherapy response, and drug resistance in bladder cancer.Front Oncol. 2024 Sep 16;14:1466319. doi: 10.3389/fonc.2024.1466319. eCollection 2024. Front Oncol. 2024. PMID: 39351351 Free PMC article.
References
-
- Proietto A. Gynaecological cancer surgery. Best Pract Res Clin Obstet Gynaecol. 2006;20(1):157–172. - PubMed
-
- Narod S. Can advanced-stage ovarian cancer be cured? Nat Rev Clin Oncol. 2016;13(4):255–261. - PubMed
-
- Yetkin-Arik B, Kastelein AW, Klaassen I, Jansen C, Latul YP, Vittori M, Biri A, Kahraman K, Griffioen AW, Amant F, et al. Angiogenesis in gynecological cancers and the options for anti-angiogenesis therapy. Biochim Biophys Acta Rev Cancer. 2021;1875(1):188446. - PubMed
MeSH terms
Grants and funding
LinkOut - more resources
Full Text Sources
Research Materials
Miscellaneous
