. 2022 Nov 7;11(11):1627.
doi: 10.3390/biology11111627.

Crystal Structure of Schizosaccharomyces pombe Rho1 Reveals Its Evolutionary Relationship with Other Rho GTPases

Affiliations

Crystal Structure of Schizosaccharomyces pombe Rho1 Reveals Its Evolutionary Relationship with Other Rho GTPases

Qingqing Huang et al. Biology (Basel). .

Abstract

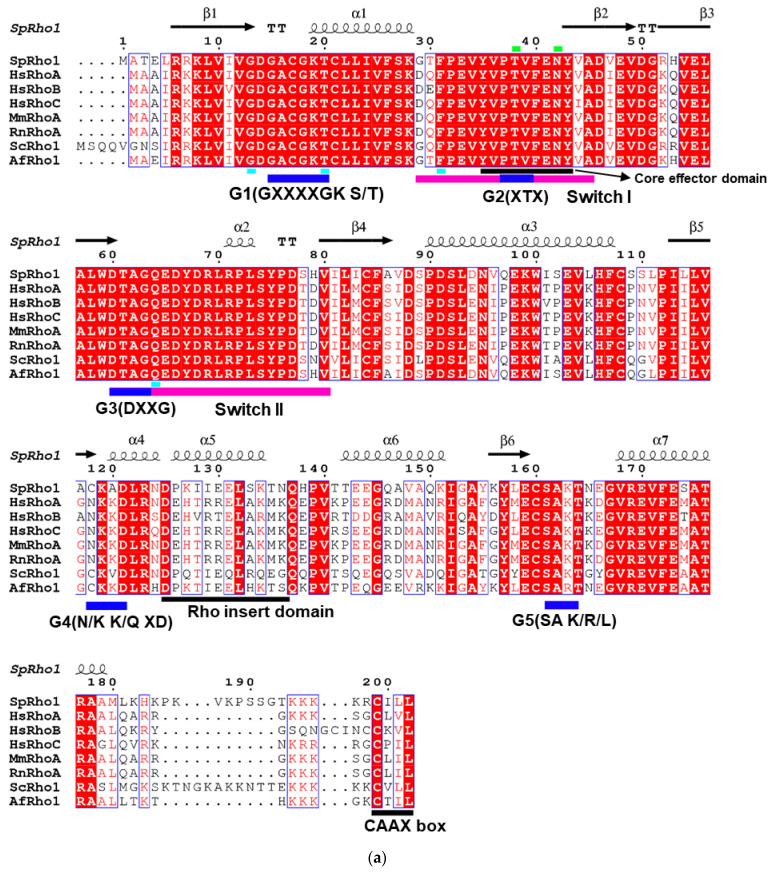
The Rho protein, a homolog of Ras, is a member of the Ras superfamily of small GTPases. Rho family proteins are involved in cytoskeletal organization, cell mobility, and polarity, and are implicated in cancer morphogenesis. Although Rho homologs from higher-order mammalian organisms are well studied, there are few studies examining Rho proteins in lower-level single-celled organisms. Here, we report on the crystal structure of Rho1 from Schizosaccharomyces pombe (SpRho1) in complex with GDP in the presence of Mg2+ at a 2.78 Å resolution. The overall structure is similar to that of known Rho homologs, including human RhoA, human RhoC, and Aspergillus fumigatus Rho1 (AfRho1), with some exceptions. We observed subtle differences at the Switch I and II regions, in β2 and β3, and in the Rho insert domain and loop from Phe107 to Pro112. Our analysis suggests that SpRho is evolutionarily closer to HsRhoC than HsRhoA, as previously believed.

Keywords: GDP; GTPase; Rho; evolution; structure.


Conflict of interest statement

The authors declare that they have no conflict of interest.

Figures

Figure 2
Figure 2
Sequence alignment and phylogenetic tree of SpRho1. (a) Sequence alignment of SpRho1, HsRhoA, HsRhoB, HsRhoC, MmRhoA, RnRhoA, ScRho1, and AfRho1. These sequences were selected corresponding to Supplementary Table S2. The secondary structure of SpRho1 is shown on the top. The blue bars represent the 5 conserved G boxes with specific sequences shown. The cyan bars (Gly13, Thr19, Phe30, and Gln63) indicate the important sites for GTP hydrolysis. Switch I and II regions are indicated with magenta bars. Core effector domain, Rho insert domain, and CAAX box are labelled with black bars. Blue frames indicate conserved residues. White letters in red boxes refer to strict identity, but red letters in white boxes indicate similarity. The amino acid sequences were aligned using Clustal Omega and Escript [25,26]. (b) Phylogenetic tree of SpRho1, HsRhoA, HsRhoB, HsRhoC, MmRhoA, RnRhoA, ScRho1, and AfRho1. It shows how species evolved from common ancestors and shows which are more related when they have a more recent common ancestor. The value at node indicates the frequency, which is the confidence of obtaining the same results using other programs. This reflects how species or other groups evolved from a series of common ancestors. Two species MEGA 11 software were used for preparing this tree [27].
Figure 2
Figure 2
Sequence alignment and phylogenetic tree of SpRho1. (a) Sequence alignment of SpRho1, HsRhoA, HsRhoB, HsRhoC, MmRhoA, RnRhoA, ScRho1, and AfRho1. These sequences were selected corresponding to Supplementary Table S2. The secondary structure of SpRho1 is shown on the top. The blue bars represent the 5 conserved G boxes with specific sequences shown. The cyan bars (Gly13, Thr19, Phe30, and Gln63) indicate the important sites for GTP hydrolysis. Switch I and II regions are indicated with magenta bars. Core effector domain, Rho insert domain, and CAAX box are labelled with black bars. Blue frames indicate conserved residues. White letters in red boxes refer to strict identity, but red letters in white boxes indicate similarity. The amino acid sequences were aligned using Clustal Omega and Escript [25,26]. (b) Phylogenetic tree of SpRho1, HsRhoA, HsRhoB, HsRhoC, MmRhoA, RnRhoA, ScRho1, and AfRho1. It shows how species evolved from common ancestors and shows which are more related when they have a more recent common ancestor. The value at node indicates the frequency, which is the confidence of obtaining the same results using other programs. This reflects how species or other groups evolved from a series of common ancestors. Two species MEGA 11 software were used for preparing this tree [27].
Figure 1
Figure 1
SpRho1–GDP–Mg2+ structure. (a) The ribbon diagram of the SpRho1–GDP–Mg2+ complex dimer. The GDP molecule is in yellow and Mg2+ is shown as a grey sphere. The key residues at the dimer interface are shown and labelled. The secondary structures are labelled on one monomer. (b) The 2Fo-Fc electron density around GDP with 1 sigma contour level. The key residues of the GDP binding pocket are shown. (c) Electrostatic surface potentials are colored red and blue for negative and positive charges, respectively, and white color represents neutral residues. The GDP is bound in the highly positively charged pocket. All the structurally related figures in this paper were prepared using PyMOL (The PyMOL Molecular Graphics System, Version 1.2r3pre, Schrödinger, LLC.,New York, NY, USA).
Figure 1
Figure 1
SpRho1–GDP–Mg2+ structure. (a) The ribbon diagram of the SpRho1–GDP–Mg2+ complex dimer. The GDP molecule is in yellow and Mg2+ is shown as a grey sphere. The key residues at the dimer interface are shown and labelled. The secondary structures are labelled on one monomer. (b) The 2Fo-Fc electron density around GDP with 1 sigma contour level. The key residues of the GDP binding pocket are shown. (c) Electrostatic surface potentials are colored red and blue for negative and positive charges, respectively, and white color represents neutral residues. The GDP is bound in the highly positively charged pocket. All the structurally related figures in this paper were prepared using PyMOL (The PyMOL Molecular Graphics System, Version 1.2r3pre, Schrödinger, LLC.,New York, NY, USA).

Similar articles

References

    1. Beljan S., Bosnar M.H., Ćetković H. Rho Family of Ras-Like GTPases in Early-Branching Animals. Cells. 2020;9:2279. doi: 10.3390/cells9102279. - DOI - PMC - PubMed
    1. Bourne H.R., Sanders D.A., McCormick F. The GTPase superfamily: Conserved structure and molecular mechanism. Nature. 1991;349:117–127. doi: 10.1038/349117a0. - DOI - PubMed
    1. Karnoub A.E., Symons M., Campbell S., Der C.J. Molecular Basis for Rho GTPase Signaling Specificity. Breast Cancer Res. Treat. 2004;84:61–71. doi: 10.1023/B:BREA.0000018427.84929.5c. - DOI - PubMed
    1. Longenecker K., Read P., Derewenda U., Dauter Z., Liu X., Garrard S., Walker L., Somlyo A.V., Nakamoto R.K., Somlyo A.P., et al. How RhoGDI binds Rho. Acta Crystallogr. D Biol. Crystallogr. 1999;55:1503–1515. doi: 10.1107/S090744499900801X. - DOI - PubMed
    1. Hakoshima T., Shimizu T., Maesaki R. Structural Basis of the Rho GTPase Signaling. J. Biochem. 2003;134:327–331. doi: 10.1093/jb/mvg149. - DOI - PubMed

LinkOut - more resources