. 2022 Oct 24;11(11):2092.
doi: 10.3390/antiox11112092.

Sodium Thiosulphate-Loaded Liposomes Control Hydrogen Sulphide Release and Retain Its Biological Properties in Hypoxia-like Environment

Affiliations

Sodium Thiosulphate-Loaded Liposomes Control Hydrogen Sulphide Release and Retain Its Biological Properties in Hypoxia-like Environment

Lissette Sanchez-Aranguren et al. Antioxidants (Basel). .

Abstract

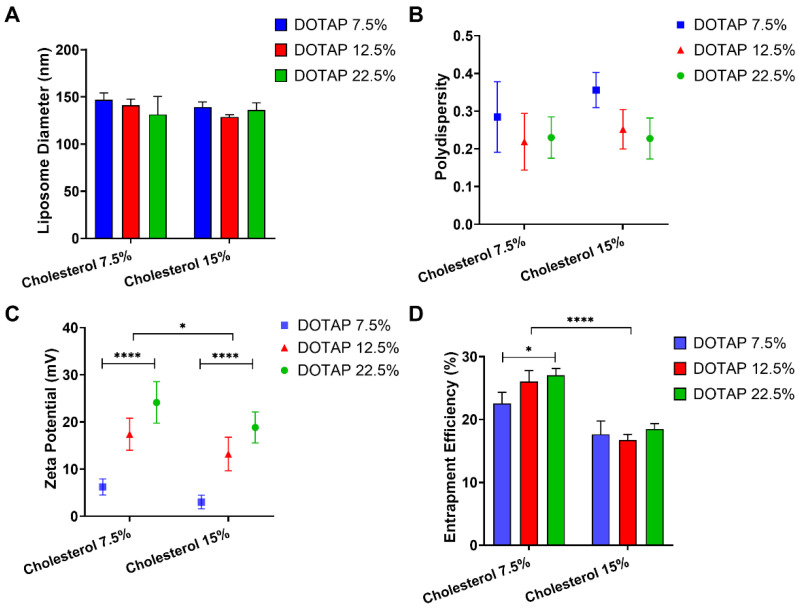
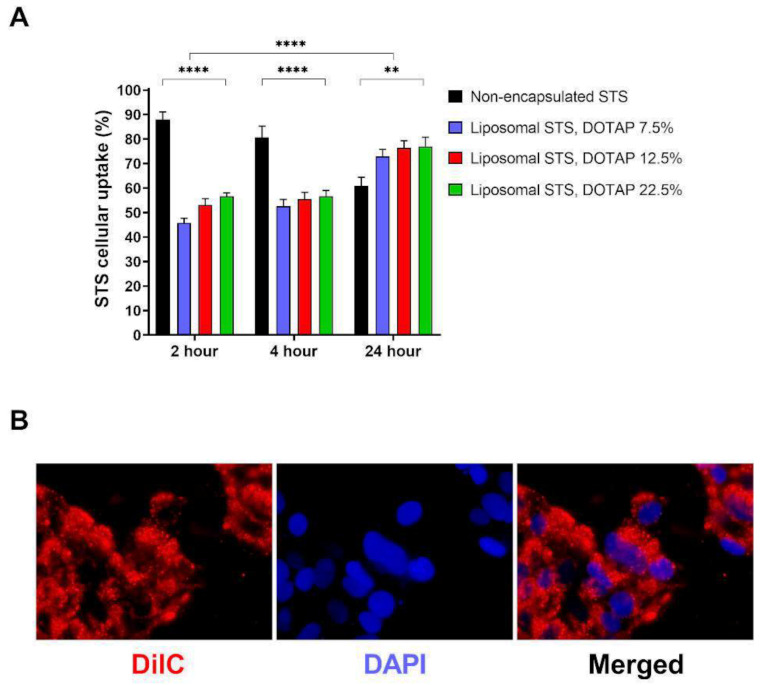
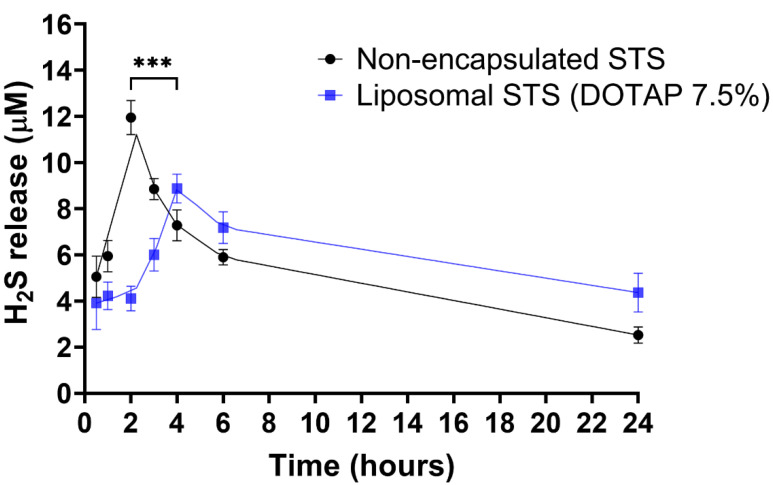
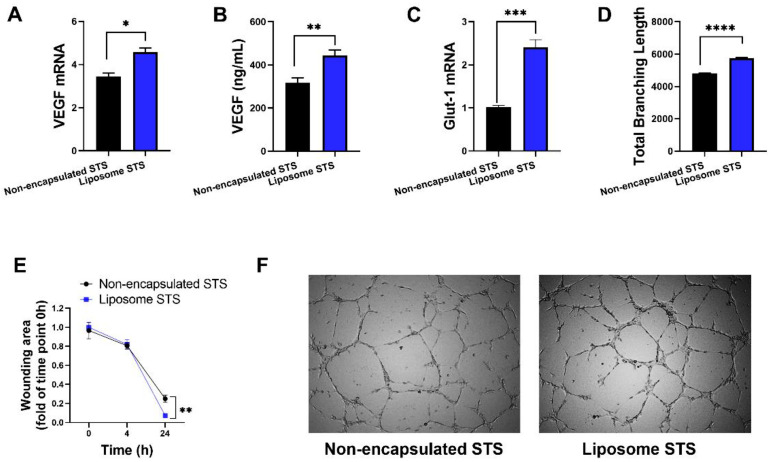
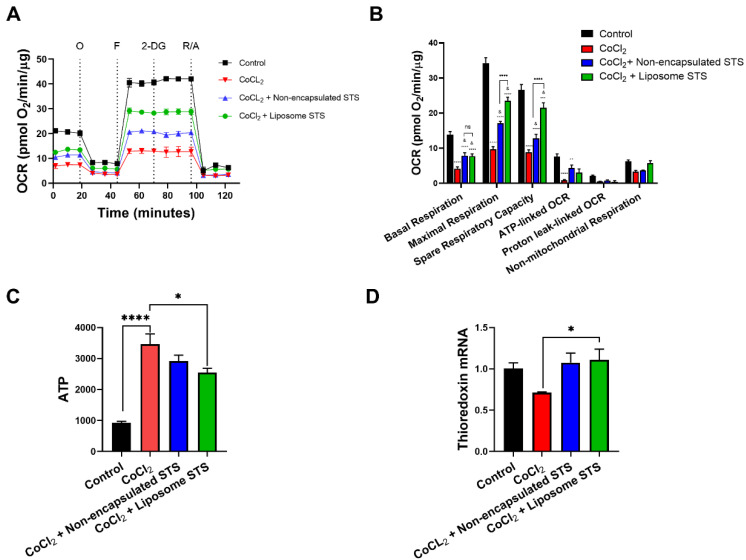
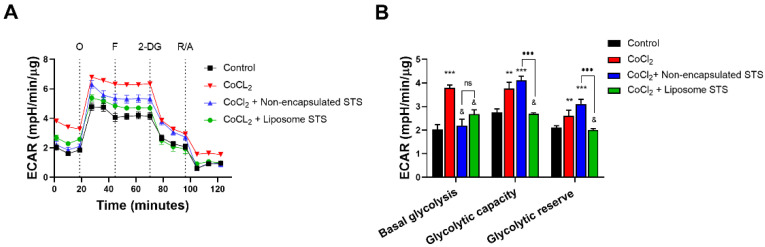
Hypoxia, or insufficient oxygen availability is a common feature in the development of a myriad of cardiovascular-related conditions including ischemic disease. Hydrogen sulphide (H2S) donors, such as sodium thiosulphate (STS), are known for their cardioprotective properties. However, H2S due to its gaseous nature, is released and cleared rapidly, limiting its potential translation to clinical settings. For the first time, we developed and characterised liposome formulations encapsulating STS and explored their potential for modulating STS uptake, H2S release and the ability to retain pro-angiogenic and biological signals in a hypoxia-like environment mirroring oxygen insufficiency in vitro. Liposomes were prepared by varying lipid ratios and characterised for size, polydispersity and charge. STS liposomal encapsulation was confirmed by HPLC-UV detection and STS uptake and H2S release was assessed in vitro. To mimic hypoxia, cobalt chloride (CoCl2) was administered in conjunction with formulated and non-formulated STS, to explore pro-angiogenic and metabolic signals. Optimised liposomal formulation observed a liposome diameter of 146.42 ± 7.34 nm, a polydispersity of 0.22 ± 0.19, and charge of 3.02 ± 1.44 mV, resulting in 25% STS encapsulation. Maximum STS uptake (76.96 ± 3.08%) from liposome encapsulated STS was determined at 24 h. Co-exposure with CoCl2 and liposome encapsulated STS resulted in increased vascular endothelial growth factor mRNA as well as protein expression, enhanced wound closure and increased capillary-like formation. Finally, liposomal STS reversed metabolic switch induced by hypoxia by enhancing mitochondrial bioenergetics. These novel findings provide evidence of a feasible controlled-delivery system for STS, thus H2S, using liposome-based nanoparticles. Likewise, data suggests that in scenarios of hypoxia, liposomal STS is a good therapeutic candidate to sustain pro-angiogenic signals and retain metabolic functions that might be impaired by limited oxygen and nutrient availability.

Keywords: angiogenesis; controlled-release; drug delivery systems; hydrogen sulphide; liposomes; mitochondrial metabolism.


Conflict of interest statement

Authors declare no conflict of interest.

Figures

Figure 1
Figure 1
The effects of DOTAP and cholesterol ratios within liposomal composition on size, polydispersity, charge and STS entrapment. Liposomes formulated with DSPE-PEG and varying ratios of PC, DOTAP and cholesterol were prepared by the extrusion method. Sodium thiosulphate (STS) was dispersed within the buffer (25 mg/mL). (A) Liposome size distribution and (B) polydispersity was determined by DLS, (C) zeta potential was determined by photon correlation spectroscopy using a Zetaplus and (D) entrapment efficiency determined by HPLC-UV. Data represents mean ± SD. (n = 3) independent batches. Statistical differences: * p < 0.05 and **** p < 0.0001.
Figure 2
Figure 2
The rates of STS cellular uptake over time. Formulation was applied to EA.hy926 cells and cell lysate was used to measure uptake after 2, 4 or 24 h exposure using HPLC-UV analysis. (A) Cellular uptake of STS in media compared with liposomal formulations consisting of varying ratios of PC, cholesterol, DSPC-PEG and DOTAP. (B) Cells were grown on coverslips and exposed to liposomes entrapping the fluorescent probe DilC (red). Cell nuclei was visualised using DAPI (blue). Data represents mean ± SD (n = 6) independent batches. Statistical differences: ** p < 0.01 and **** p < 0.0001.
Figure 3
Figure 3
H2S release from non-formulated and liposome encapsulating STS. Hourly H2S release values are plotted with curve-fitting results to highlight the donor compound decomposition. Statistical differences: *** p < 0.001 between the maximal points of H2S released from the non-formulated and liposome formulation.
Figure 4
Figure 4
Liposomal STS maintains pro-angiogenic signals of H2S under conditions mimicking hypoxia established by CoCl2. EA.hy926 were exposed to CoCl2 (400 μM) in combination with either non-formulated or liposome formulated STS for 24 h. (A) Expression of VEGF mRNA measured by qPCR. (B) VEGF release measured by ELISA in cell culture media. (C) Expression of Glut-1 mRNA measured by qPCR. (D) Capillary-like formation measured as total branching length was investigated in HUVEC exposed to CoCl2 (400 μM) in combination with either non-formulated or liposome formulated STS and calculated using Image J angiogenesis tool. (E) Cell migration measured as percentage of wound closure relative to 0 h. (F) Images representative of tube formation assays captured at 4×. Data represents mean ± SD (n = 3). Statistical differences: * p < 0.05, ** p < 0.01, *** p < 0.001, **** p < 0.0001.
Figure 5
Figure 5
Liposomal STS enhanced mitochondrial bioenergetics under conditions mimicking hypoxia. EA.hy926 were exposed to CoCl2 (400 μM) in combination with either non-formulated or liposomal STS for 24 h. Afterward, mitochondrial function was evaluated in real-time using a XF24 Seahorse analyser and ATP levels measured by luminescence. (A) Traces of oxygen consumption rates (OCR) expressed by time after the sequential administration of drugs/inhibitors: oligomycin (O), FCCP (F), 2- deoxy glucose (2-DG) and mixture of rotenone and antimycin A (R/A). (B) Calculated mitochondrial function parameters from graph A. (C) ATP levels. (D) Expression of thioredoxin measured by qPCR. (n = 5). Statistical differences: (B) ** p < 0.01, *** p < 0.01, **** p < 0.001 vs. control, & p < 0.05 vs. CoCl2. (C,D): * p < 0.05, **** p < 0.001.
Figure 6
Figure 6
Liposomal STS abrogated glycolytic dependence of endothelial cells under conditions mimicking hypoxia. EA.hy926 were exposed to CoCl2 (400 μM) in combination with either non-formulated or liposome formulated STS for 24 h. Afterward, extracellular acidification rates (ECAR) was evaluated in real-time using a XF24 Seahorse analyser. (A) ECAR traces expressed by time after the sequential administration of drugs/inhibitors: oligomycin (O), FCCP (F), 2- deoxy glucose (2-DG) and mixture of rotenone and antimycin A (R/A). (B) Calculated glycolytic function parameters from graph A. (n = 5). Statistical differences: ** p < 0.01, *** p < 0.01 vs. control, & p < 0.05 vs. CoCl2.

Similar articles

Cited by

References

    1. Timmis A., Vardas P., Townsend N., Torbica A., Katus H., De Smedt D., Gale C.P., Maggioni A.P., Petersen S.E., Huculeci R., et al. European Society of Cardiology: Cardio-vascular disease statistics 2021. Eur. Heart J. 2022;43:716–799. doi: 10.1093/eurheartj/ehab892. - DOI - PubMed
    1. Krock B.L., Skuli N., Simon M.C. Hypoxia-Induced Angiogenesis: Good and Evil. Genes Cancer. 2011;2:1117–1133. doi: 10.1177/1947601911423654. - DOI - PMC - PubMed
    1. Mitroshina E.V., Savyuk M.O., Ponimaskin E., Vedunova M.V. Hypoxia-Inducible Factor (HIF) in Ischemic Stroke and Neurodegenerative Disease. Front. Cell Dev. Biol. 2021;9:2014. doi: 10.3389/fcell.2021.703084. - DOI - PMC - PubMed
    1. Hashimoto T., Shibasaki F. Hypoxia-Inducible Factor as an Angiogenic Master Switch. Front. Pediatr. 2015;3:33. doi: 10.3389/fped.2015.00033. - DOI - PMC - PubMed
    1. Koitabashi N., Kass D.A. Reverse remodeling in heart failure—mechanisms and therapeutic opportunities. Nat. Rev. Cardiol. 2011;9:147–157. doi: 10.1038/nrcardio.2011.172. - DOI - PubMed

LinkOut - more resources