. 2022 Oct 30;11(11):2151.
doi: 10.3390/antiox11112151.

Microglial Hemoxygenase-1 Deletion Reduces Inflammation in the Retina of Old Mice with Tauopathy

Affiliations

Microglial Hemoxygenase-1 Deletion Reduces Inflammation in the Retina of Old Mice with Tauopathy

José A Fernández-Albarral et al. Antioxidants (Basel). .

Abstract

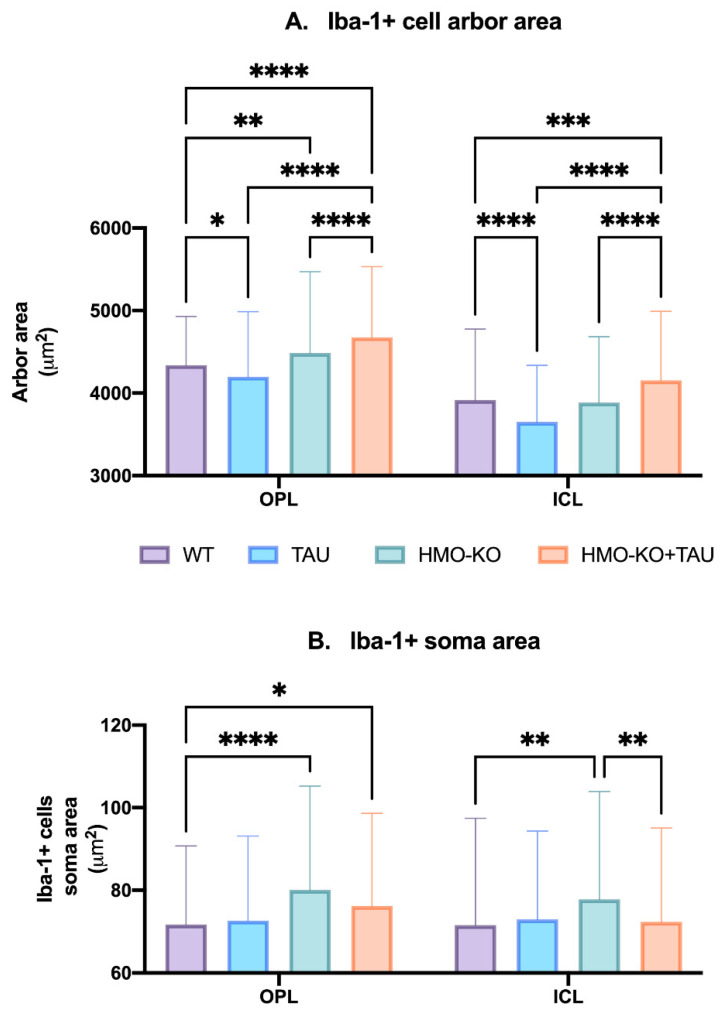
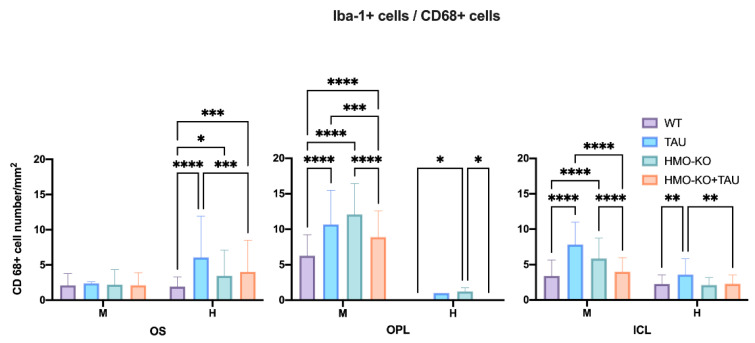
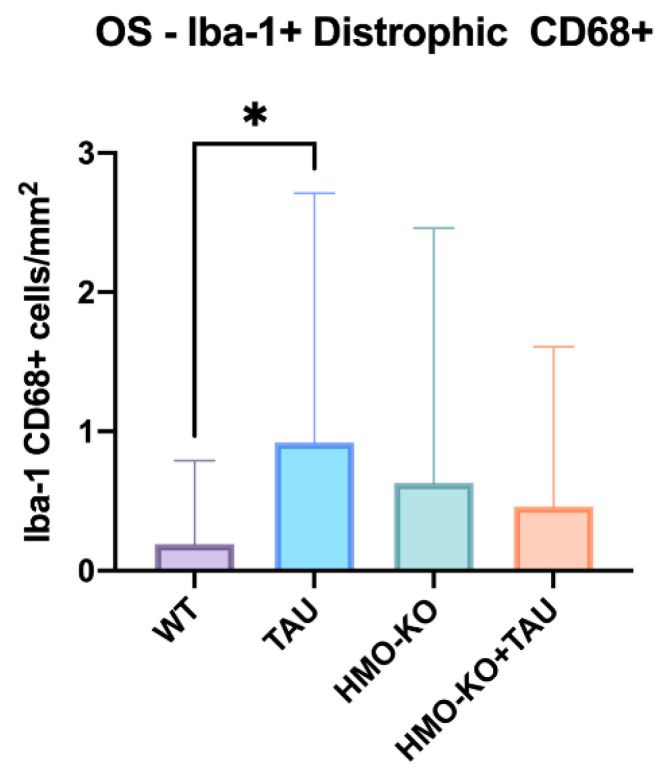
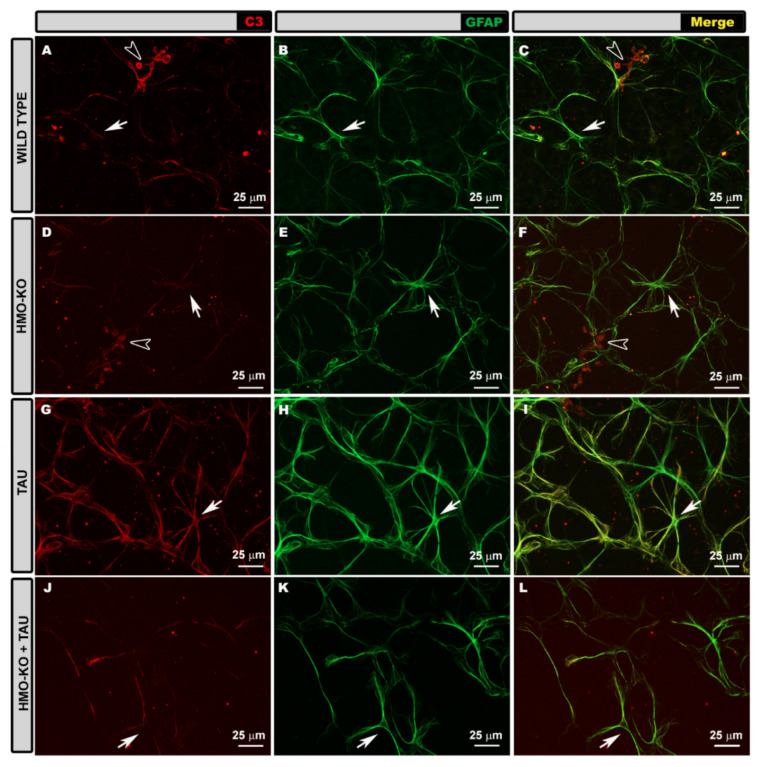
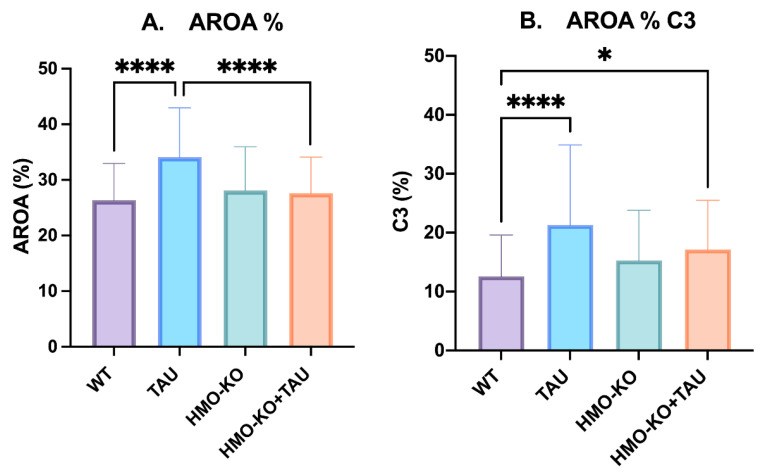
Tauopathies such as Alzheimer's disease are characterized by the accumulation of neurotoxic aggregates of tau protein. With aging and, especially, in Alzheimer's patients, the inducible enzyme heme oxygenase 1 (HO-1) progressively increases in microglia, causing iron accumulation, neuroinflammation, and neurodegeneration. The retina is an organ that can be readily accessed and can reflect changes that occur in the brain. In this context, we evaluated how the lack of microglial HO-1, using mice that do not express HO-1 in microglia (HMO-KO), impacts retinal macro and microgliosis of aged subjects (18 months old mice) subjected to tauopathy by intrahippocampal delivery of AAV-hTauP301L (TAU). Our results show that although tauopathy, measured as anti-TAUY9 and anti-AT8 positive immunostaining, was not observed in the retina of WT-TAU or HMO-KO+TAU mice, a morphometric study of retinal microglia and macroglia showed significant retinal changes in the TAU group compared to the WT group, such as: (i) increased number of activated microglia, (ii) retraction of microglial processes, (iii) increased number of CD68+ microglia, and (iv) increased retinal area occupied by GFAP (AROA) and C3 (AROC3). This retinal inflammatory profile was reduced in HMO-KO+TAU mice. Conclusion: Reduction of microglial HO-1 could be beneficial to prevent tauopathy-induced neuroinflammation.

Keywords: heme oxygenase 1 (HO-1); macroglia; microglia; neurodegenerative diseases; neuroinflammation; retina; tauopathies.


Conflict of interest statement

The authors declare no conflict of interest. The funders had no role in the design of the study; in the collection, analyses, or interpretation of data; in the writing of the manuscript; or in the decision to publish the results.

Figures

Figure 1
Figure 1
TAUY9 labeling in the hippocampus (arrow) (A), absence of TAUY9 (B), and AT8 (C) labelling in retinal tissue. (B,C) correspond to the inner complex retinal layers (ICL) of animals from the TAU group.
Figure 2
Figure 2
Retinal wholemount. Double immunolabeling with anti-Iba-1 (red) and anti-CD68 (green) in OS layer in the different study groups: WT (AC), HMO-KO (DF), TAU (GI), HMO-KO+TAU (JL); 20× magnification. Microglia with CD68+ labelling (arrows). Dystrophic microglia (arrowheads). The images correspond to the retinal periphery. Number of retinas used in the experiment: WT n = 6, HMO-KO n = 6, TAU n = 6, and HMO-KO+TAU n = 6.
Figure 3
Figure 3
Retinal wholemount. Double immunostaining with anti-Iba-1 (red) and anti-CD68 (green) in OPL in the different study groups: WT (AC), HMO-KO (DF), TAU (GI), HMO-KO+TAU (JL); 20× magnification. Arrows indicate microglial cells with CD68+ labelling. Number of retinas used in the experiment: WT n = 6, HMO-KO n = 6, TAU n = 6, and HMO-KO+TAU n = 6.
Figure 4
Figure 4
Retinal wholemount. Double immunostaining with anti-Iba-1 (red) and anti-CD68 (green) in ICL in the different study groups: WT (AC), HMO-KO (DF), TAU (GI), HMO-KO+TAU (JL); 20× magnification. Arrows indicate microglial cells with CD68+ labelling. Number of retinas used in the experiment: WT n = 6, HMO-KO n = 6, TAU n = 6, and HMO-KO+TAU n = 6.
Figure 5
Figure 5
Microglial cell numbers. (A) Number of Iba-1+ microglial cells per retinal area of 0.1502 mm2 in the different retinal layers in each of the study groups; two-way ANOVA. (B) Number of dystrophic Iba-1+ cells in OS layer in the different study groups; one-way ANOVA. (C) Number of activated Iba-1+ cells in OS layer in the different study groups; one-way ANOVA. All data are expressed as mean value (±SD). * p < 0.05, ** p < 0.01, *** p < 0.001, **** p < 0.0001. Number of retinas used in the experiment: WT n = 6, HMO-KO n = 6, TAU n = 6, and HMO-KO+TAU n = 6.
Figure 6
Figure 6
(A) Arbor area of Iba-1+ microglia in OPL and ICL in the different study groups. (B) Area of the Iba-1+ soma in OPL and ICL in the different study groups. Two-way ANOVA. Data expressed as mean value (±SD). * p < 0.05, ** p < 0.01, *** p < 0.001, **** p < 0.0001. Number of retinas used in the experiment: WT n = 6, HMO-KO n = 6, TAU n = 6, and HMO-KO+TAU n = 6.
Figure 7
Figure 7
Number of Iba-1+/CD68+ microglial cells per retinal area of 0.1502 mm2 in the different retinal layers in each of the study groups, expressed as mean value (±DS). Two-way ANOVA; H: high phagocytic capacity; M: mean phagocytic capacity; * p < 0.05, ** p < 0.01, *** p < 0.001, **** p < 0.0001. Number of retinas used in the experiment: WT n = 6, HMO-KO n = 6, TAU n = 6, and HMO-KO+TAU n = 6.
Figure 8
Figure 8
Number of Iba-1+/CD68+ dystrophic microglial cells per retinal area of 0.1502 mm2 in the OS layer in each of the study groups, expressed as mean value (± SD). One-way ANOVA; * p < 0.05. Number of retinas used in the experiment: WT n = 6, HMO-KO n = 6, TAU n = 6, and HMO-KO+TAU n = 6.
Figure 9
Figure 9
Retinal wholemount. GFAP+ astrocytes in the different study groups: WT (A), HMO-KO (B), TAU (C), HMO-KO+TAU (D); 20× magnification. Arrows point to primary astrocyte processes; arrowheads point to secondary astrocyte processes. Asterisks (*) demarcate the course of blood vessels. Number of retinas used in the experiment: WT n = 6, HMO-KO n = 6, TAU n = 6, and HMO-KO+TAU n = 6.
Figure 10
Figure 10
Retinal wholemount. GFAP+ astrocytes in the different study groups: WT (A), HMO-KO (B), TAU (C), HMO-KO+TAU (D); 63× magnification. Arrows indicate primary astrocyte processes; arrowheads indicate secondary astrocyte processes. Number of retinas used in the experiment: WT n = 6, HMO-KO n = 6, TAU n = 6, and HMO-KO+TAU n = 6.
Figure 11
Figure 11
Retinal wholemount. Double immunohistochemical staining with GFAP (green) and C3 (red) in the different study groups: WT (AC), HMO-KO (DF), TAU (GI), HMO-KO+TAU (JL); 40× magnification. Arrows point to astrocytes; hollow arrowheads point to macrophages. Number of retinas used in the experiment: WT n = 6, HMO-KO n = 6, TAU n = 6, and HMO-KO+TAU n = 6.
Figure 12
Figure 12
Retinal wholemount. Double immunohistochemical staining with anti-GFAP (green) and anti-C3 (red) in Müller cells in the different study groups: WT (AC), HMO-KO (DF), TAU (GI), HMO-KO+TAU (JL); 40× magnification. Arrows point to Müller cells. The image shows an edge of the retina, and therefore the entire thickness of the retina can be observed, allowing differentiation of the whole Müller cell as if it were a histological section. Number of retinas used in the experiment: WT n = 6, HMO-KO n = 6, TAU n = 6, and HMO-KO+TAU n = 6.
Figure 13
Figure 13
(A) Area of retina occupied by GFAP (AROA) in the different study groups. (B) Area of retina occupied by C3 (AROC3) in the different study groups. Data are expressed as mean values (±SD). One-way ANOVA; * p < 0.05, **** p < 0.0001. Number of retinas used in the experiment: WT n = 6, HMO-KO n = 6, TAU n = 6, and HMO-KO+TAU n = 6.

Similar articles

Cited by

References

    1. Stephenson J., Nutma E., van der Valk P., Amor S. Inflammation in CNS Neurodegenerative Diseases. Immunology. 2018;154:204–219. doi: 10.1111/imm.12922. - DOI - PMC - PubMed
    1. Chen P., Miah M.R., Aschner M. Metals and Neurodegeneration. F1000Res. 2016;5:366. doi: 10.12688/f1000research.7431.1. - DOI - PMC - PubMed
    1. Wright R.O., Baccarelli A. Metals and Neurotoxicology. J. Nutr. 2007;137:2809–2813. doi: 10.1093/jn/137.12.2809. - DOI - PubMed
    1. Wyss-Coray T. Ageing, Neurodegeneration and Brain Rejuvenation. Nature. 2016;539:180–186. doi: 10.1038/nature20411. - DOI - PMC - PubMed
    1. Ransohoff R.M. How Neuroinflammation Contributes to Neurodegeneration. Science. 2016;353:777–783. doi: 10.1126/science.aag2590. - DOI - PubMed

LinkOut - more resources