. 2022 Oct 25;14(21):5218.
doi: 10.3390/cancers14215218.

FTO Inhibits Epithelial Ovarian Cancer Progression by Destabilising SNAI1 mRNA through IGF2BP2

Affiliations

FTO Inhibits Epithelial Ovarian Cancer Progression by Destabilising SNAI1 mRNA through IGF2BP2

Meige Sun et al. Cancers (Basel). .

Abstract

Fat mass and obesity-associated protein (FTO) regulates critical pathways in various diseases, including malignant tumours. However, the functional link between FTO and its target genes in epithelial ovarian cancer (EOC) development remains to be elucidated. In this study, the biological functions of FTO were verified in vitro and in vivo. The m6A modification and the binding sites of SNAI1 mRNA were confirmed by m6A RNA immunoprecipitation (MeRIP) and RIP experiments. The actinomycin D assay was used to test the stability of RNA. We found that FTO was downregulated with increased m6A levels in EOC. Reduced expression of FTO was associated with a higher FIGO stage in patients with EOC. Mechanistically, FTO decreased the m6A level and stability of SNAI1 mRNA, causing downregulation of SNAI1 and inhibiting epithelial-mesenchymal transition (EMT). Furthermore, FTO-mediated downregulation of SNAI1 expression depended on IGF2BP2, which acted as an m6A reader binding to the 3' UTR region of SNAI1 mRNA to promote its stability. In conclusion, FTO inhibits SNAI1 expression to attenuate the growth and metastasis of EOC cells in an m6A-IGF2BP2-dependent manner. Our findings suggest that the FTO-IGF2BP2-SNAI1 axis is a potential therapeutic target in EOC.

Keywords: EMT; FTO; IGF2BP2; SNAI1; m6A; metastasis; ovarian cancer.


Conflict of interest statement

The authors declare no conflict of interest.

Figures

Figure 1
Figure 1
Lower expression of FTO in EOCs compared with normal ovarian tissues. (a) m6A levels of EOC and normal ovarian tissues by m6A dot blot. (b) Expression levels of the key enzymes of m6A in EOC and normal ovarian tissues by RT−qPCR. (c) The abundance of FTO transcripts from the TCGA database and the GTEX database. (d) Analysis of FTO protein level in the CPTAC database. (e) The mRNA level of FTO in 60 paired EOC and normal ovarian tissues detected by RT−qPCR. (f) FTO protein expression in 53 EOC and 35 normal ovarian tissues detected by Western blot. (g) FTO expression in normal ovarian tissues, benign, borderline epithelial tumours, and EOC detected by IHC assay. Scale bar, 100 μm. Data are presented as mean ± SD. ns, not significant; ** p < 0.01; *** p < 0.001. The uncropped blots are shown in Supplementary Materials File S1.
Figure 2
Figure 2
FTO knockdown promoted malignant phenotypes of EOC cells in vitro. (a) RT-qPCR validation of FTO knockdown in A2780 and OVCAR3 cells. (b) m6A levels of EOC cells were detected by m6A dot blot after FTO knockdown. (c) CCK-8 assays detected cell viability after FTO knockdown. (d) EdU assay detected the proliferation of EOC cells. Scale bar, 50 μm. (e) Wound healing assays detected cell migration after FTO knockdown. Scale bar, 100 μm. (f) Transwell assay tested the invasion of ovarian cancer cells. Scale bar, 50 μm. (g) Expression of EMT-related markers, N-cadherin, E-cadherin, and vimentin in FTO knockdown A2780 and OVCAR3 cells determined by Western blotting. The data represent the results of three independent replicates. Data are presented as mean ± SD; * p < 0.05; ** p < 0.01; *** p < 0.001. The uncropped blots are shown in Supplementary Materials File S1.
Figure 3
Figure 3
FTO overexpression inhibits malignant phenotypes of EOC cells in vitro. (a) RT-qPCR verified the efficiency of FTO-WT and FTO-MT overexpression in A2780 and OVCAR3 cells. After overexpression of FTO-WT and FTO-MT in A2780 and OVCAR3 cells, (b) m6A levels were detected by m6A dot blot; (c) CCK-8 assays tested cell viability; (d) EdU assay examined cell proliferation; scale bar, 50 μm; (e) The wound healing assay detected the migration; scale bar, 100 μm; (f) Cell invasion was evaluated by transwell assay; scale bar, 50 μm; (g) Expression of N-cadherin, E-cadherin, and vimentin in A2780 and OVCAR3 cells was determined by Western blot. The data represent the results of three independent replicates. Data are presented as mean ± SD; ns, not significant; * p < 0.05; ** p < 0.01; *** p < 0.001. The uncropped blots are shown in Supplementary Materials File S1.
Figure 4
Figure 4
FTO decreases the stability and expression of SNAI1 mRNA. (a) Expression of EMT-related transcription factors, ZEB1, ZEB2, SNAIL and SLUG in OVCAR3 cells was determined by Western blot. (b) Expression of SNAIL in A2780 cells with indicated treatments detected by Western blot. (c) The expression of SNAI1 mRNA in FTO-WT overexpression, FTO-MT overexpression, and control vector transduced A2780 and OVCAR3 cells was examined by RT-qPCR. (d) MeRIP assay detected the m6A-modification on SNAI1 mRNA in A2780 and OVCAR3 cells. (e) The m6A level of SNAI1 mRNA in LV-FTO or LV-NC OVCAR3 cells was detected by MeRIP. (f) After treatment of cells with 10 μg/mL of ACD for 0, 3, and 6 h, SNAI1 mRNA level in LV-FTO or LV-NC cells was detected by RT-qPCR. Data are presented as mean ± SD; ns, not significant; * p < 0.05; ** p < 0.01; *** p < 0.001. The uncropped blots are shown in Supplementary Materials File S1.
Figure 5
Figure 5
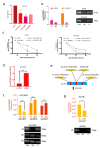
FTO decreases the stability and expression of SNAI1 mRNA via IGF2BP2. (a) SNAI1 mRNA expression in si−NC, si−IGF2BP1, si−IGF2BP2, and si−IGF2BP3 A2780 cells was examined by RT−qPCR. (b) Enrichment of SNAI1 mRNA interacting with IGF2BP2 was detected by RIP assay using IGF2BP2 specific antibody and IgG antibody, by RT−qPCR and DNA gel electrophoresis. (c) After treatment of cells with 10 μg/mL of ACD for 0, 3, and 6 h, SNAI1 expression in si−NC or si−IGF2BP2 cells was detected by RT−qPCR. (d) The level of SNAI1 mRNA interaction with IGF2BP2 detected by RIP assay using IGF2BP2-specific antibody in LV−FTO or LV−NC OVCAR3 cells. (e) m6A site of SNAI1 3′ UTR predicted by RMBase website. (f) Enrichment of SNAI1 m6A sites interacted with IGF2BP2 in OVCAR3 cells detected by RIP assay and by RT−qPCR. (g) Enrichment of SNAI1 m6A sites 1 interacted with IGF2BP2 in A2780 cells detected by RIP assay and by RT-qPCR. The data represent the results of three independent replicates. Data are presented as mean ± SD; ns, not significant; * p < 0.05; ** p < 0.01; *** p < 0.001. The uncropped blots are shown in Supplementary Materials File S1.
Figure 6
Figure 6
FTO exerts anti-tumour roles of EOC by inhibiting SNAI1 with the help of IGF2BP2. Wound healing (a), Transwell (b), EdU (c) and CCK-8 (d) assays were used to detect the migration, invasiveness, proliferation and viability of A2780 and OVCAR3 cells, respectively. (e) Protein levels of FTO, IGF2BP2, SNAI1, N−cadherin, E−cadherin and vimentin in OVCAR3 cells, detected by Western blotting. (f,g) SNAI1 mRNA stability in OVCAR3 cells was detected by ACD assay. The data represent the results of three independent replicates. Data are presented as mean ± SD. ns, not significant; * p < 0.05; ** p < 0.01; *** p < 0.001. The uncropped blots are shown in Supplementary Materials File S1.
Figure 7
Figure 7
FTO inhibits EOC cell growth in vivo. (a) Representative pictures, the weight of xenograft tumours at the endpoints, and the tumour growth curves (n = 6 per group). (b) m6A level of xenograft tumours was detected by m6A dot blot. (c) RT-qPCR examined SNAI1 mRNA expression of xenograft tumours. (d) Representative images of IHC display the expression of FTO, SNAIL and Ki67 of xenograft tumours. Scale bar, 200 μm. (e) Western blot demonstrating the expression of EMT-related markers, FTO, IGF2BP2, and SNAIL. Data are presented as mean ± SD; * p < 0.05; ** p < 0.01; *** p < 0.001. The uncropped blots are shown in Supplementary Materials File S1.
Figure 8
Figure 8
FTO inhibits EOC cell metastasis in vivo. (a) Tumour distribution at necropsy. Each colour represents the metastatic tumours from one mouse (n = 6). Red star indicates in situ lesion. Yellow arrow indicates metastatic focus. (b) The number at the endpoints of peritoneal xenograft metastatic tumours. (c) Representative images of IHC display the expression of FTO of peritoneal xenograft metastatic tumours. Scale bar, 200 μm. Data are presented as mean ± SD; *** p < 0.001.
Figure 9
Figure 9
Schematic diagram of the present study (created with https://www.figdraw.com, accessed on 7 July 2022).

Similar articles

Cited by

References

    1. Siegel R.L., Miller K.D., Fuchs H.E., Jemal A. Cancer statistics, 2022. CA Cancer J. Clin. 2022;72:7–33. doi: 10.3322/caac.21708. - DOI - PubMed
    1. Zheng L., Cui C., Shi O., Lu X., Li Y.K., Wang W., Li Y., Wang Q. Incidence and mortality of ovarian cancer at the global, regional, and national levels, 1990–2017. Gynecol. Oncol. 2020;159:239–247. doi: 10.1016/j.ygyno.2020.07.008. - DOI - PubMed
    1. Perez-Fidalgo J.A., Grau F., Farinas L., Oaknin A. Systemic treatment of newly diagnosed advanced epithelial ovarian cancer: From chemotherapy to precision medicine. Crit. Rev. Oncol. Hematol. 2021;158:103209. doi: 10.1016/j.critrevonc.2020.103209. - DOI - PubMed
    1. Nag S., Aggarwal S., Rauthan A., Warrier N. Maintenance therapy for newly diagnosed epithelial ovarian cancer—A review. J. Ovarian Res. 2022;15:88. doi: 10.1186/s13048-022-01020-1. - DOI - PMC - PubMed
    1. Roundtree I.A., Evans M.E., Pan T., He C. Dynamic RNA Modifications in Gene Expression Regulation. Cell. 2017;169:1187–1200. doi: 10.1016/j.cell.2017.05.045. - DOI - PMC - PubMed