. 2022 Oct 27;14(21):5294.
doi: 10.3390/cancers14215294.

Hepcidin Upregulation in Colorectal Cancer Associates with Accumulation of Regulatory Macrophages and Epithelial-Mesenchymal Transition and Correlates with Progression of the Disease

Affiliations

Hepcidin Upregulation in Colorectal Cancer Associates with Accumulation of Regulatory Macrophages and Epithelial-Mesenchymal Transition and Correlates with Progression of the Disease

Antonio Di Grazia et al. Cancers (Basel). .

Abstract

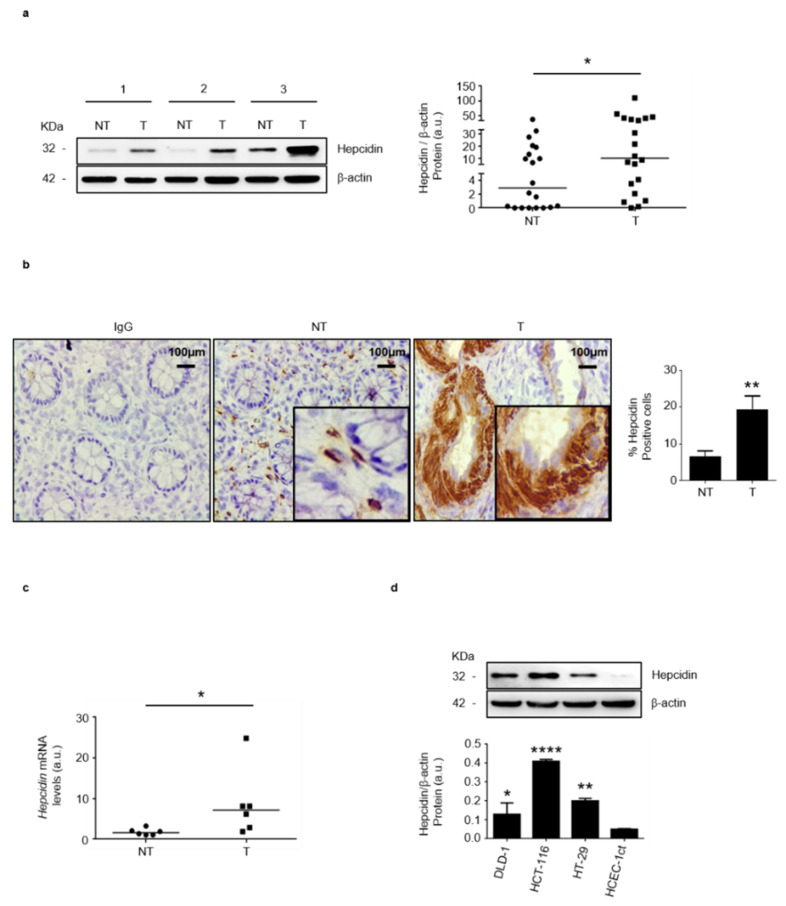
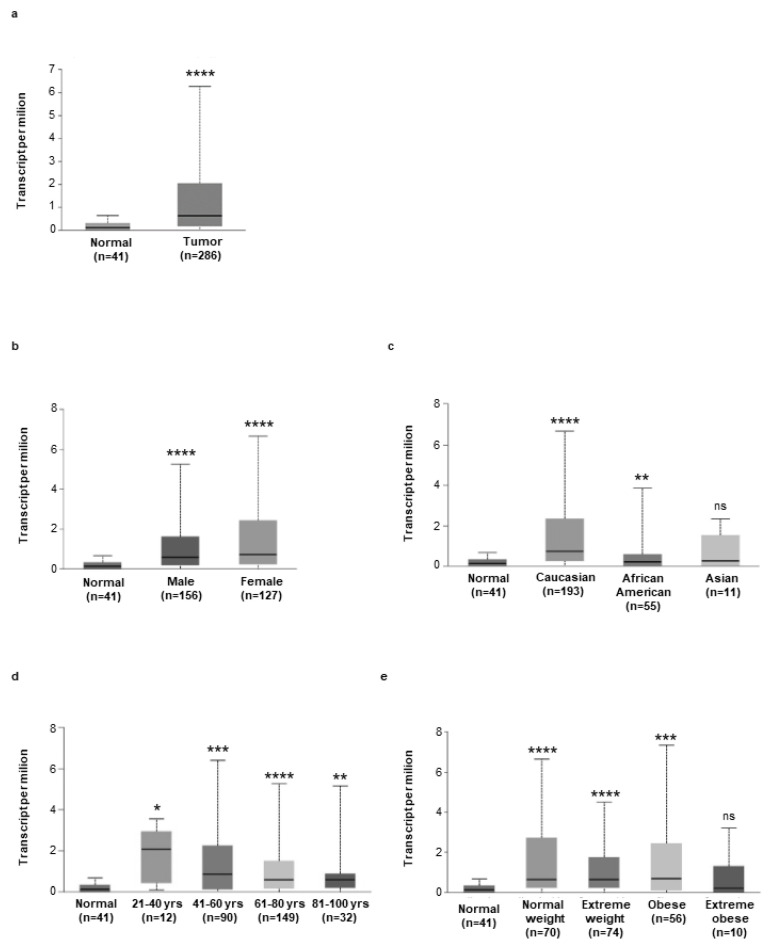
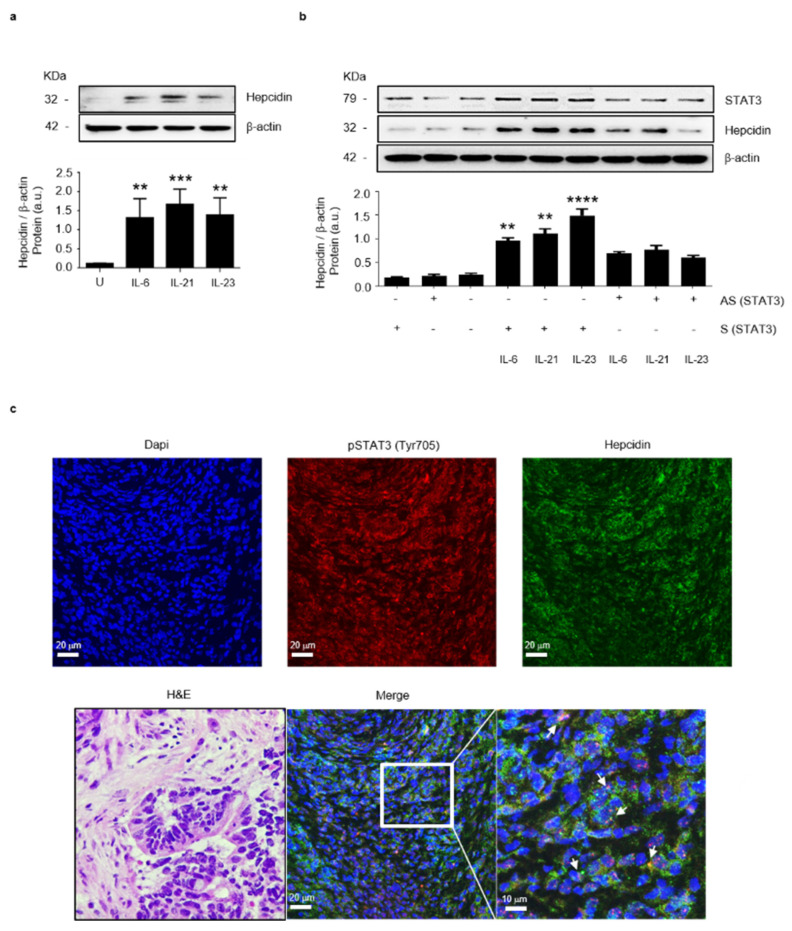
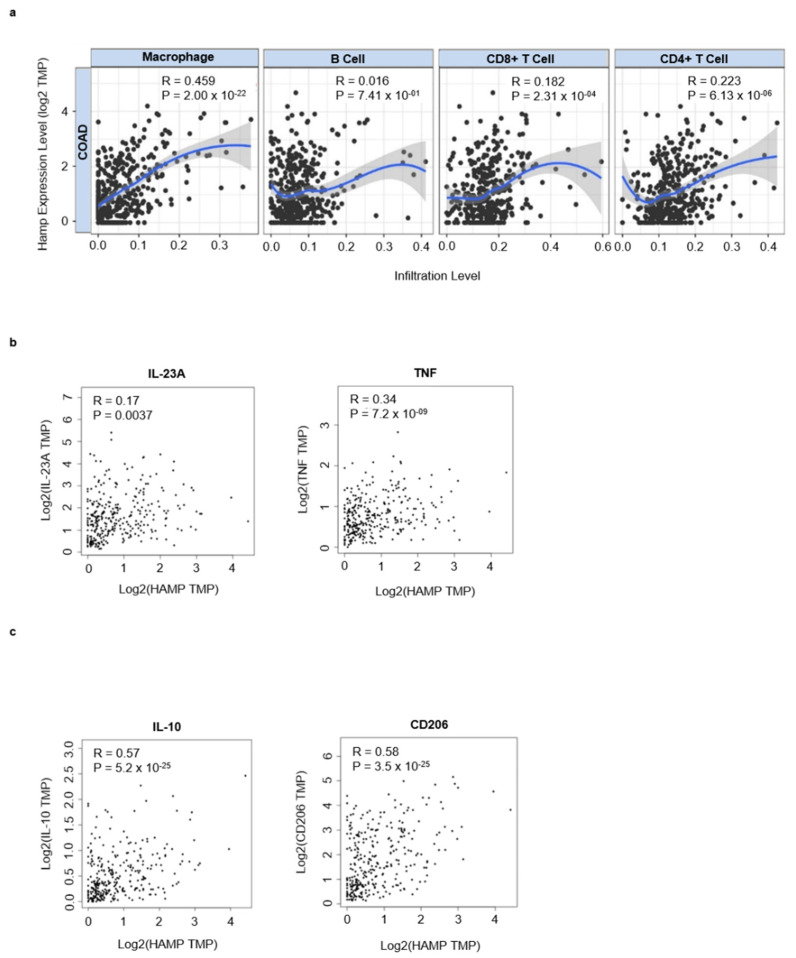
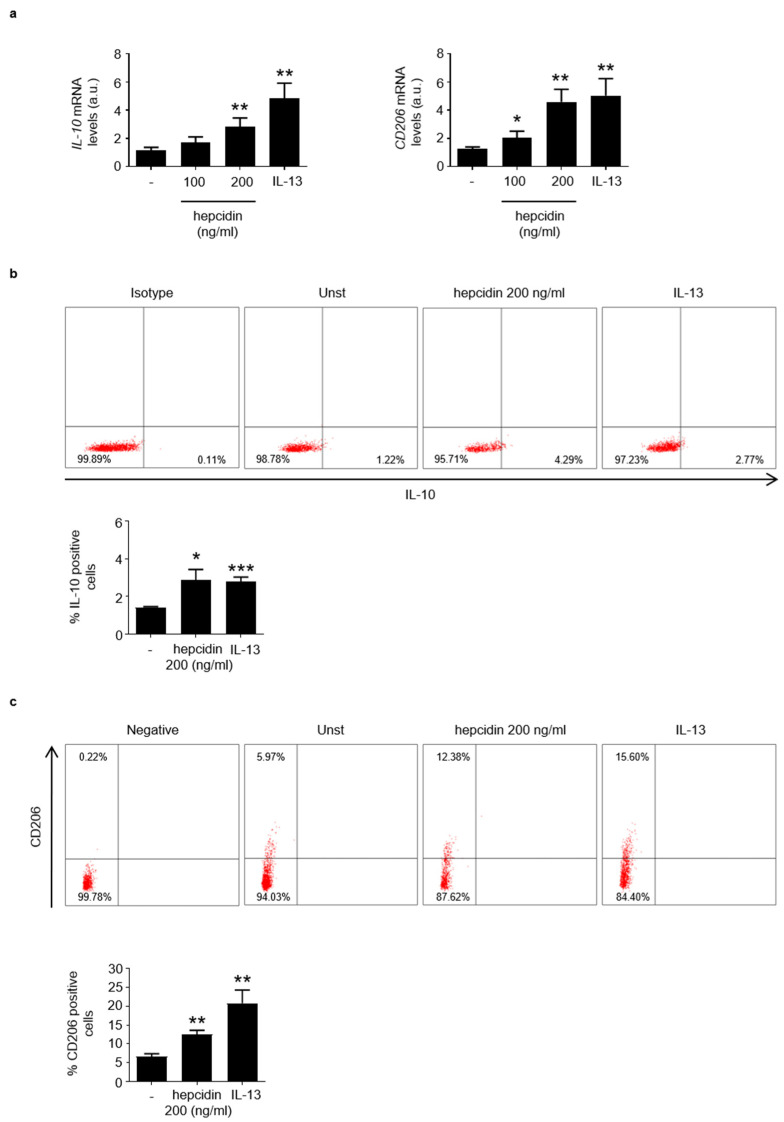
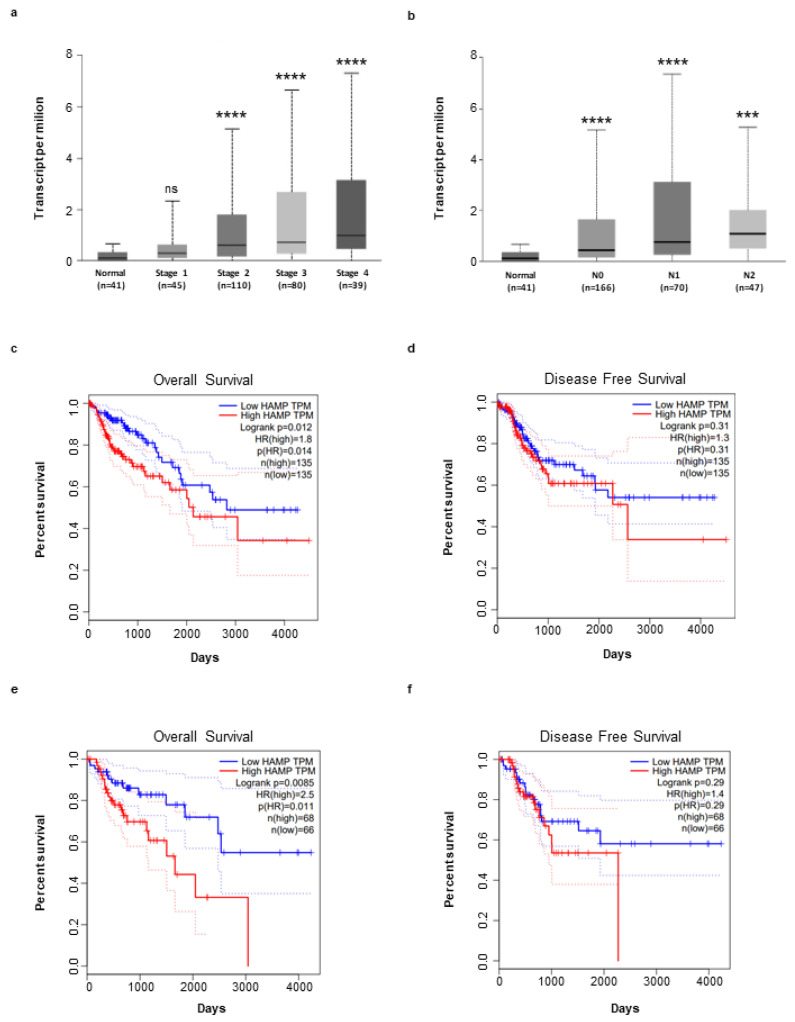
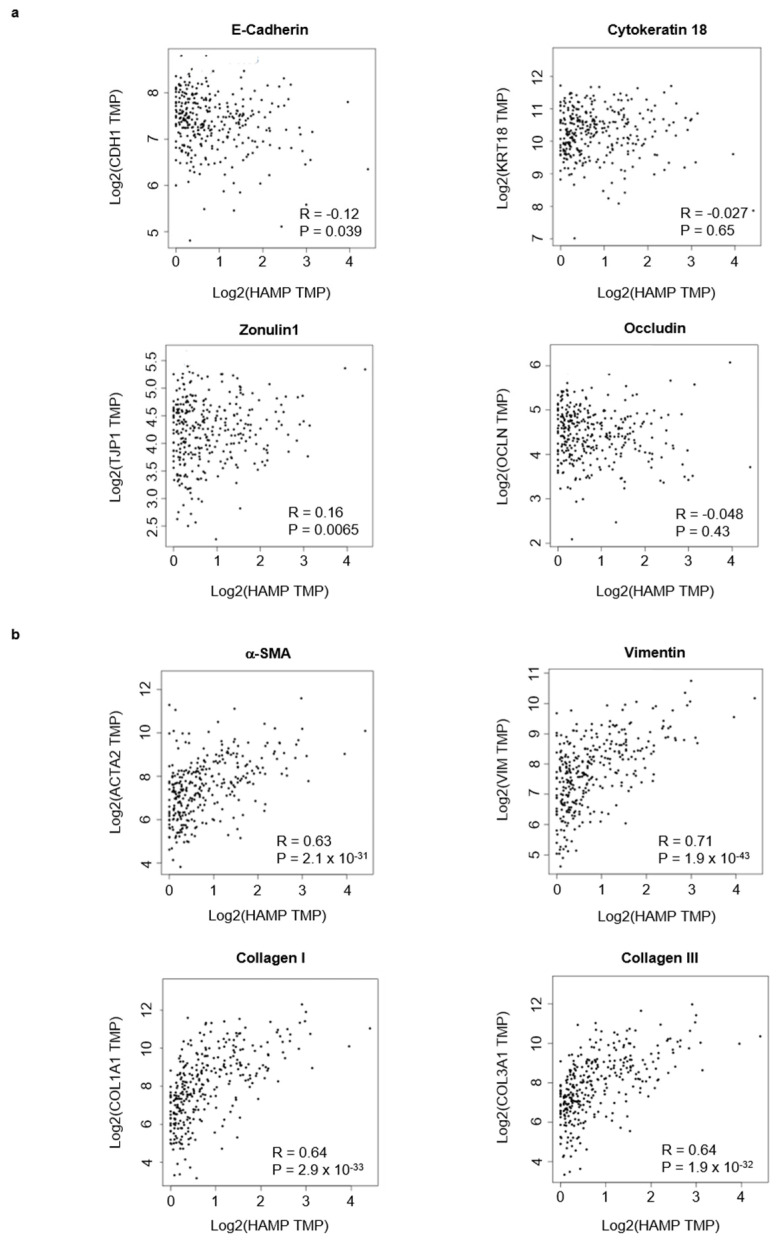
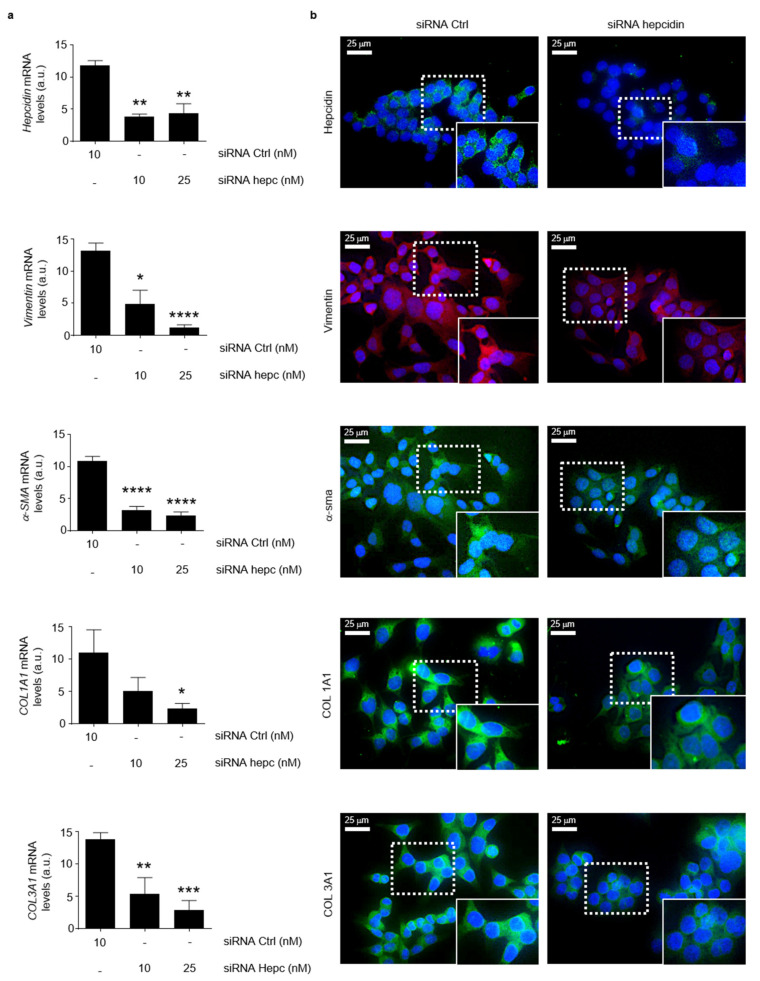
Advanced, metastatic colorectal cancer (CRC) is associated with high rate of mortality because of its poor responsiveness to chemotherapy/immunotherapy. Recent studies have shown that hepcidin, a peptide hormone produced mainly by hepatocytes, is expressed by and enhances the growth of tumor cells. We here assessed whether hepcidin expression helps identify subsets of CRC with advanced and aggressive course. By integrating results of in vitro/ex vivo studies with data of bioinformatics databases, we initially showed that hepcidin RNA and protein expression was more pronounced in tissue samples taken from the tumor area, as compared to the macroscopically unaffected, adjacent, colonic mucosa of CRC patients. The induction of hepcidin in the colonic epithelial cell line HCEC-1ct by interleukin (IL)-6, IL-21 and IL-23 occurred via a Stat3-dependent mechanism and, in primary CRC cells, hepcidin co-localized with active Stat3. In CRC tissue, hepcidin content correlated mainly with macrophage accumulation and IL-10 and CD206 expression, two markers of regulatory macrophages. Consistently, both IL-10 and CD206 were up-regulated by hepcidin in blood mononuclear cells. The highest levels of hepcidin were found in metastatic CRC and survival analysis showed that high expression of hepcidin associated with poor prognosis. Moreover, hepcidin expression correlated with markers of epithelial-to-mesenchymal transition and the silencing of hepcidin in CRC cells reduced epithelial-to-mesenchymal transition markers. These findings indicate that hepcidin is markedly induced in the advanced stages of CRC and suggest that it could serve as a prognostic biomarker in CRC.

Keywords: Stat3; cancer metastasis; cytokines; prognosis; type 2 macrophages.


Conflict of interest statement

G.M. served as a consultant for First Wave BioPharma and filed a patent related to the treatment of inflammatory bowel diseases with Smad7 antisense oligonucleotides. The other authors have no conflict of interest.

Figures

Figure 1
Figure 1
Hepcidin expression is increased in CRC. (a) Hepcidin protein expression was evaluated in paired tissue samples taken from the tumor area (T) and the adjacent, non-tumor area (NT) of CRC patients by Western blotting. β-actin was used as a loading control. Left panel: representative Western blots of hepcidin and β-actin in 3 different patients; right panel shows the quantitative analysis of hepcidin/β-actin protein ratio, as measured by densitometry scanning of Western blots. Each point in the graph indicates the value of hepcidin/β-actin in a single patient. Values are expressed in arbitrary units (a.u.); NT versus T, * p< 0.05; n = 20). (b) Representative images of immunohistochemistry of colon sections of paired tissue samples taken from the T and NT areas of CRC patients. Staining with a control isotype IgG is also shown. Scale bars, 100 μm. Inset shows staining at higher magnification. Right inset: the percentages (%) of hepcidin-positive cells in sections taken from the NT and T areas of 6 CRC patients. Data are expressed as mean ± SD (** p< 0.01). (c) Hepcidin RNA expression was evaluated in paired tissue samples taken from the T and NT areas of CRC patients by RT-PCR, and values were normalized to β-actin. Each point in the graph represents the value of hepcidin mRNA in a single patient (* p < 0.05; n = 6). (d) Hepcidin protein expression in CRC cell lines (DLD-1; HCT-116; HT-29) and HCEC-1ct cells evaluated by Western blotting. Representative Western blots and quantitative analysis of hepcidin/β-actin protein ratio, as measured by densitometry scanning of Western blots are shown. In the lower panel, values are expressed in arbitrary units (a.u.) and indicate mean ± SD of all experiments; DLD-1 versus HCEC-1ct, * p < 0.05; HCT-116 versus HCEC-1ct, **** p< 0.0001; HT-29 versus HCEC-1ct, ** p < 0.01; n = 3).
Figure 2
Figure 2
(a) Expression of hepcidin in colorectal cancer samples (n = 256) and normal tissue samples (n = 41), as evaluated by using the UALCAN database (cancer vs. normal (**** p < 0.0001). (be) Expression of hepcidin RNA in different groups of CRC based on patients’ gender (b) [Normal (n = 41) versus CRC male (n = 156), **** p < 0.0001; Normal (n = 41) versus CRC female (n = 127), **** p < 0.0001], patients’ ethnicity (c) [Normal (n = 41) versus CRC Caucasian (n = 193), **** p < 0.0001; Normal (n = 41) versus CRC African American (n = 55), ** p < 0.01; Normal (n = 41) versus CRC Asian (n = 10), ns]; patients’ age (d), [Normal (n = 41) versus CRC 21–40 years (n = 12), * p < 0.05; Normal (n = 41) versus CRC 41–60 years (n = 90), *** p < 0.001; Normal (n = 41) versus CRC 61–80 years (n = 149), **** p < 0.0001; Normal (n = 41) versus CRC 81–100 years (n= 32), ** p < 0.01], patients’ weight [Normal (n = 41) versus CRC normal weight (n = 70), **** p < 0.0001; Normal (n = 41) versus CRC extreme weight (n = 74), **** p < 0.0001; Normal (n = 41) versus CRC obese (n = 56), *** p < 0.001; Normal (n = 41) versus CRC extreme obese (n= 10), ns] was examined by using the UALCAN database.
Figure 3
Figure 3
Stat3 regulates positively hepcidin expression in colon epithelial cells. (a) Representative Western blots showing hepcidin and β-actin in HCEC-1ct cells stimulated with IL-6, IL-21 and IL-23. Lower panel shows the quantitative analysis of hepcidin/β-actin protein ratio, as measured by densitometry scanning of Western blots of 3 different experiments. Values are expressed in arbitrary units (a.u.) and indicate mean ± SD of all experiments; [Unstimulated (U) versus IL-6, ** p< 0.01; U versus IL-21, *** p < 0.001; U versus IL-23, ** p < 0.01]. (b) Representative Western blots showing p-Stat3, hepcidin and β-actin in HCEC-1ct cells transfected with sense (S) or Stat3 antisense (AS) oligonucleotide and then stimulated with IL-6, IL-21 and IL-23, as indicated in materials and methods. Lower panel shows the quantitative analysis of hepcidin/β-actin protein ratio as measured by densitometry scanning of Western blots of 3 different experiments. Values are expressed in arbitrary units (a.u.) and indicate mean ± SD of all experiments; (S/IL-6 versus AS/IL-6, ** p< 0.01; S/IL-21 versus AS/IL-21, ** p < 0.01; S/IL-23A versus AS/IL-23A, **** p < 0.0001; n = 3). (c) Representative confocal laser scanning microscopy images showing p-Stat3 (Tyr 705) (red) and hepcidin (green) in CRC sections; nuclei are stained with 4′,6-diamidino-2- phenylindole (DAPI) (blue). White arrows indicate cells co-expressing both p-Stat3 and hepcidin. The left image shows the hematoxylin/eosin (H&E) staining of a serial section taken from the same CRC tissue assessed by confocal microscopy.
Figure 4
Figure 4
Hepcidin correlates with infiltrating immune cells and macrophages markers in CRC. (a) Scatterplots of the correlations between hepcidin expression and the infiltration of different immune cells using the TIMER database. (b,c) Correlation between hepcidin expression and either IL-23A and TNF, 2 markers of inflammatory macrophages, or IL-10 and CD206, two markers of regulatory macrophages.
Figure 5
Figure 5
Stimulation of blood mononuclear cells with hepcidin increases the percentages of IL-10- and CD206-expressing cells. (a). Blood mononuclear cells were either left unstimulated (Unst) or stimulated with exogenous hepcidin or IL-13 (as an inducer of regulatory macrophages), as indicated in materials. IL-10 and CD206 RNA expression was analyzed by real-time PCR and values were normalized to β-actin RNA. Values are expressed in arbitrary units (a.u.) and indicate mean ± SD of 3 experiments. Unst versus hepcidin, * p < 0.05, ** p < 0.01; unst versus IL-13, ** p < 0.01. (b,c). Blood mononuclear cells were either left unstimulated (Unst) or stimulated with exogenous hepcidin as indicated in materials and methods and the percentages of IL-10- or CD206-expressing cells were then evaluated by flow-cytometry. The histogram shows the percentage of positive cells and data are expressed as mean ± SEM of 3 separate experiments. Unst versus hepcidin * p < 0.05, ** p < 0.01; unst versus IL-13, * p < 0.0.5, *** p < 0.001.
Figure 6
Figure 6
Hepcidin expression is correlated to CRC progression and affects survival of patients. (a,b) Increase in hepcidin RNA expression in different groups of CRC based on tumor stage (a), [Normal (n = 41) versus CRC Stage 1 (n = 45), ns (ns, not statistical significant); Normal (n = 41) versus CRC Stage 2 (n = 110), **** p < 0.0001; Normal (n = 41) versus Stage 3 (n = 80), **** p < 0.0001; Normal (n = 41) versus Stage 4 (n = 39), **** p < 0.0001] and lymph node metastases (b) [Normal (n = 41) versus N0 (n = 166), **** p < 0.0001; Normal (n = 41) versus N1 (n = 70), **** p < 0.0001; Normal (n = 41) versus N2 (n = 47), *** p < 0.001]. Analysis was performed by using the GEIPIA database. (cf) Effect of hepcidin expression level on CRC overall survival and disease free survival using the Kaplan–Meier curve (median value: high n = 135; low n = 135; quartile value: high n = 68; low n = 68) (broken lines in the graph indicate the lower and upper 95% of confidence intervals) from GEIPIA database.
Figure 7
Figure 7
Hepcidin expression correlates with epithelial-to-mesenchymal transition-associated markers in CRC. (a) Scatterplots of the correlations between hepcidin expression and epithelial markers using the GEPIA database. (b) Scatterplots of the correlations between hepcidin expression and mesenchymal markers using the GEPIA database.
Figure 8
Figure 8
Silencing of hepcidin in CRC cells is associated with a significant reduction of mesenchymal markers. (a) Hepcidin, Vimentin, α-SMA, COL1A1 and COL1A3 RNA transcripts were evaluated in HCT-116 cells transfected for 24 h with either a control siRNA (10 nM) or hepcidin siRNA Hepcidin (10 and 25 nM) by real-time PCR, and values were normalized to β-actin RNA. Values are expressed in arbitrary units (a.u.) and indicate mean ± SD of 4 experiments; Hepcidin: control siRNA versus hepcidin siRNA 10 nM, ** p < 0.01; control siRNA versus hepcidin siRNA 20 nM, ** p < 0.01; Vimentin: control siRNA versus hepcidin siRNA 10 nM, * p < 0.05; control siRNA versus hepcidin siRNA 20 nM, **** p < 0.0001; α-SMA: control siRNA versus hepcidin siRNA 10 nM, **** p < 0.0001; control siRNA versus hepcidin siRNA 20 nM, **** p < 0.0001; COL1A1: control siRNA versus hepcidin siRNA 10 nM, ns; control siRNA versus hepcidin siRNA 20 nM, * p < 0.05; COL1A3: control siRNA versus hepcidin siRNA 10 nM, ** p < 0.01; control siRNA versus hepcidin siRNA 20 nM, *** p < 0.001. (b) Representative images of immunofluorescence staining for hepcidin (green), Vimentin (red), α-SMA (red), COL1A1 (green) and COL1A3 (green) in HCT-1116 cells transfected with either a control siRNA (10 nM) or hepcidin siRNA Hepcidin (25 nM) for 24 h; nuclei are stained with 4′,6-diamidino-2-phenylindole (DAPI) (blue).

Similar articles

Cited by

References

    1. Arnold M., Sierra M.S., Laversanne M., Soerjomataram I., Jemal A., Bray F. Global patterns and trends in colorectal cancer incidence and mortality. Gut. 2017;66:683–691. doi: 10.1136/gutjnl-2015-310912. - DOI - PubMed
    1. Hanahan D., Weinberg R.A. Hallmarks of cancer: The next generation. Cell. 2011;144:646–674. doi: 10.1016/j.cell.2011.02.013. - DOI - PubMed
    1. Bradbury K.E., Murphy N., Key T.J. Diet and colorectal cancer in UK Biobank: A prospective study. Int. J. Epidemiol. 2020;49:246–258. doi: 10.1093/ije/dyz064. - DOI - PMC - PubMed
    1. Chen S., Chen Y., Ma S., Zheng R., Zhao P., Zhang L., Liu Y., Yu Q., Deng Q., Zhang K. Dietary fibre intake and risk of breast cancer: A systematic review and meta-analysis of epidemiological studies. Oncotarget. 2016;7:80980–80989. doi: 10.18632/oncotarget.13140. - DOI - PMC - PubMed
    1. Fedirko V., Tramacere I., Bagnardi V., Rota M., Scotti L., Islami F., Negri E., Straif K., Romieu I., La Vecchia C., et al. Alcohol drinking and colorectal cancer risk: An overall and dose-response meta-analysis of published studies. Ann. Oncol. 2011;22:1958–1972. doi: 10.1093/annonc/mdq653. - DOI - PubMed

LinkOut - more resources