. 2022 Nov 3;14(21):5421.
doi: 10.3390/cancers14215421.

Glucose Enhances Pro-Tumorigenic Functions of Mammary Adipose-Derived Mesenchymal Stromal/Stem Cells on Breast Cancer Cell Lines

Affiliations

Glucose Enhances Pro-Tumorigenic Functions of Mammary Adipose-Derived Mesenchymal Stromal/Stem Cells on Breast Cancer Cell Lines

Maria Rosaria Ambrosio et al. Cancers (Basel). .

Abstract

Adiposity and diabetes affect breast cancer (BC) progression. We addressed whether glucose may affect the interaction between mammary adipose tissue-derived mesenchymal stromal/stem cells (MAT-MSCs) and BC cells. Two-dimensional co-cultures and spheroids were established in 25 mM or 5.5 mM glucose (High Glucose-HG or Low Glucose-LG) by using MAT-MSCs and MCF7 or MDA-MB231 BC cells. Gene expression was measured by qPCR, while protein levels were measured by cytofluorimetry and ELISA. CD44high/CD24low BC stem-like sub-population was quantified by cytofluorimetry. An in vivo zebrafish model was assessed by injecting spheroid-derived labeled cells. MAT-MSCs co-cultured with BC cells showed an inflammatory/senescent phenotype with increased abundance of IL-6, IL-8, VEGF and p16INK4a, accompanied by altered levels of CDKN2A and LMNB1. BC cells reduced multipotency and increased fibrotic features modulating OCT4, SOX2, NANOG, αSMA and FAP in MAT-MSCs. Of note, these co-culture-mediated changes in MAT-MSCs were partially reverted in LG. Only in HG, MAT-MSCs increased CD44high/CD24low MCF7 sub-population and promoted their ability to form mammospheres. Injection in zebrafish embryos of HG spheroid-derived MCF7 and MAT-MSCs was followed by a significant cellular migration and caudal dissemination. Thus, MAT-MSCs enhance the aggressiveness of BC cells in a HG environment.

Keywords: breast cancer; glucose; mammary adipose tissue; mesenchymal stromal/stem cells.


Conflict of interest statement

The authors declare no conflict of interest.

Figures

Figure 1
Figure 1
Characterization of MSCs isolated from Mammary Adipose Tissue (MAT-MSCs). (a) Representative microscopic image (magnification 10×) of MAT-MSCs. (b) Representative dot plots from FACS analysis of MAT-MSCs stained for FITC-anti-CD90, PE-anti-CD73, APC-Cy7-anti-CD45 antigens. (c) Representative microscopic images (magnification 10×) of MAT-MSCs differentiated towards the adipogenic lineage, stained (right) and not (left) with oil red O for lipid accumulation detection. (d) Representative microscopic images (magnification 10×) of MAT-MSCs differentiated towards osteogenic lineage, stained (right) and not (left) with alizarin red S for calcium accumulation detection.
Figure 2
Figure 2
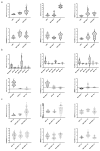
Effect of glucose on MAT-MSCs phenotype in 2D-cultures with BC cells. MAT-MSCs were co-cultured—and not—with MCF7 or MDA-MB231 for 72 h in (a,b) standard/high glucose (25 mM glucose; MSC) or (c) low glucose concentration (5.5 mM; MSC LG). After 72 h, BC cells were removed while MAT-MSCs were grown for another 3 (MSC 6d) or 7 days (MSC 10d). mRNA expression levels of senescence/fibrosis markers (IL6, IL8, VEGF, CDKN2A, LMNB1, ACTA2) were determined by qPCR (see Section 2 and Supplementary Table S1. Data were normalized on the peptidyl-prolyl cis-trans isomerase A (PPIA) gene as per internal standard. Results were represented as: violin plot of 7–9 (a,c) or 3–5 (b) independent triplicate experiments showing mRNA levels of IL6, IL8, VEGF, CDKNA2, LMNB1 and ACTA2 in MAT-MSCs co-cultured with BC cells as relative expression (2−ΔΔCt) compared to that in monocultured MAT-MSCs (control cells). In (b) monocultured cells (control cells) are represented as a dotted line. Data were analyzed using non-parametric Kruskall–Wallis test followed by Dunn’s correction for multiple comparisons. For pairwise comparisons (MSC + MCF7 vs. MSC + MDA-MB231), Mann–Whitney test was assessed. * denotes statistically significant values compared with monocultured MAT-MSCs (* adjp < 0.05; ** adjp < 0.01; *** adjp < 0.001, **** adjp < 0.0001). ç denotes statistically significant values compared with MSC + MCF7 (ç adjp < 0.05).
Figure 3
Figure 3
Effect of glucose on MAT-MSCs multipotency in 2D cultures with BC cells. MAT-MSCs were co-cultured—and not—with MCF7 or MDA-MB231 BC cells in (a) standard/high glucose (25 mM glucose; MSC) or (b) low glucose concentration (5.5 mM; MSC LG). After for 72 h, mRNA expression levels of multipotency markers (OCT4, SOX2, NANOG) were determined by qPCR (see Methods and Supplementary Table S1). Data were normalized on PPIA gene as internal standard. Results were represented as violin plot of 7–9 independent triplicate experiments showing mRNA levels of OCT4, SOX2 and NANOG in MAT-MSCs co-cultured with BC cells as relative expression (2−ΔΔCt) compared to that in mono-cultured MAT-MSCs. Data were analyzed using non-parametric Kruskall–Wallis test followed by Dunn’s correction for multiple comparisons. * denotes statistically significant values compared with MSC (* adjp < 0.05).
Figure 4
Figure 4
Effect of glucose on BC cells stemness in 2D cultures with MAT-MSCs. (a) MCF7 or (b) MDA-MB231 were co-cultured-and not—with MAT-MSCs in low glucose (5.5 mM; LG) or standard/high glucose (25 mM; HG) medium. After 72 h, mRNA expression levels of stemness genes (OCT4, SOX2, NANOG) were determined by qPCR (see Methods and Supplementary Table S1). Data were normalized on PPIA gene as internal standard. Results were represented as violin plot of 7–15 independent triplicate experiments showing mRNA levels of OCT4, SOX2 and NANOG in (a) MCF7 + MSC LG/HG and (b) MDA-MB231 + MSC LG/HG as relative expression (2−ΔΔCt) compared to that in monocultured cells (MCF7/MDA-MB231 LG/HG; dotted line). Data were analyzed using the non-parametric Wilcoxon test for pairwise comparisons. * denotes statistically significant values (* pval < 0.05).
Figure 5
Figure 5
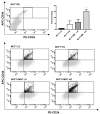
Quantification of CD44high/CD24low subpopulation in BC cells co-cultured with MAT-MSCs. MCF7 were co-cultured—and not—with MAT-MSCs in LG or HG medium. After 72 h, CD44high/CD24low stem cell subpopulation was identified in monocultured (MCF7 LG/HG) and co-cultured (MCF7 + MSC LG/HG) MCF7 by FACS analysis (See Section 2). Representative dot plots show MCF7 stained with APC-anti-CD44 and PE-anti-CD24 as well as dye/isotype matched antibodies. In the graph, the percentage of population was reported as fold over basal (MCF7 LG) and showed CD44high/CD24low cell subpopulation as mean ± SD of 4 independent experiments. Data were analyzed using the non-parametric Friedman test followed by Dunn’s correction for multiple comparisons. * denotes statistically significant values compared with MCF7 LG (* adjp < 0.01).
Figure 6
Figure 6
Effect of glucose and MAT-MSCs on mammosphere formation. Three-dimensional cultures were set up by using MCF7 and MAT-MSCs (ratio 4:1) in LG or HG concentrations. After 10 days, mammosphere number and diameter were obtained. Results were reported as fold over basal (MCF7 LG). Bars represent mean ± SD of 4–5 independent experiments showing mammosphere number and diameter in BC cells, co-cultured and not with MAT-MSCs. Data were analyzed using the non-parametric Friedman test followed by Dunn’s correction for multiple comparisons. * denotes statistically significant values compared with MCF7 LG (* adjp < 0.05).
Figure 7
Figure 7
Effect of glucose on MAT-MSCs and MCF7 crosstalk in 3D organoids. Three-dimensional cultures were set up by using MCF7 and MAT-MSCs (ratio 4:1) in LG or HG concentrations. After 72 h, spheroids were mechanically disaggregated and cells were stained with PE-anti-OCT4, PE-anti-NANOG, PE-anti-α-SMA, APC-anti-FAP and APC-anti-p16, as well as dye/isotype matched antibodies for FACS analysis. Results were reported as violin plot of 4–9 independent experiments showing protein levels of (a) Oct4 and Nanog in MCF7 or (b) α-SMA, FAP, p16 and OCT4 in MAT-MSCs as fold over basal (MCF7 LG/MSC LG). Data were analyzed using the non-parametric Friedman test followed by Dunn’s correction for multiple comparisons. * denotes statistically significant values compared with MCF7 LG or MSC LG (* adjp < 0.05; ** adjp < 0.01, **** adjp < 0.0001).
Figure 8
Figure 8
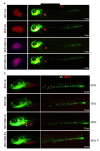
Effect of glucose on MCF7-MAT-MSCs organoids in xenograft zebrafish models. MCF7 (labeled with red dye), cultured in spheroids alone or with MAT-MSCs (labeled with blue dye) in LG or HG, were injected into the PVS of 48 hpf zebrafish embryos. MCF7 and MCF7 + MSCs spheroids in LG and HG ((a), left) were disaggregated, injected and visualized under fluorescence stereo microscope at time point 0 hrs post-injection ((a), right). BV = blood vessel. MCF7 dissemination in LG and HG was analyzed 72 hrs post-injection (b). White arrows indicate migrated MCF7 cells in zebrafish head and tail. Results have been presented as percentage of xenograft with invasive BC cells. Data were analyzed using the chi-square with Fisher’s exact test. * denotes statistically significant values compared with MCF7 LG (* pval < 0.0001). § denotes statistically significant values compared with MCF7 HG (§ pval < 0.01). ç denotes statistically significant values compared with MSC + MCF7 LG (ç pval < 0.0001).

Similar articles

Cited by

References

    1. Saeedi P., Petersohn I., Salpea P., Malanda B., Karuranga S., Unwin N., Colagiuri S., Guariguata L., Motala A.A., Ogurtsova K., et al. Global and regional diabetes prevalence estimates for 2019 and projections for 2030 and 2045: Results from the International Diabetes Federation Diabetes Atlas, 9(th) edition. Diabetes Res. Clin. Pract. 2019;157:107843. doi: 10.1016/j.diabres.2019.107843. - DOI - PubMed
    1. Shi Y., Hu F.B. The global implications of diabetes and cancer. Lancet. 2014;383:1947–1948. doi: 10.1016/S0140-6736(14)60886-2. - DOI - PubMed
    1. Vigneri P., Frasca F., Sciacca L., Pandini G., Vigneri R. Diabetes and cancer. Endocr.-Relat. Cancer. 2009;16:1103–1123. doi: 10.1677/ERC-09-0087. - DOI - PubMed
    1. Larsson S.C., Mantzoros C.S., Wolk A. Diabetes mellitus and risk of breast cancer: A meta-analysis. Int. J. Cancer. 2007;121:856–862. doi: 10.1002/ijc.22717. - DOI - PubMed
    1. Peairs K.S., Barone B.B., Snyder C.F., Yeh H.C., Stein K.B., Derr R.L., Brancati F.L., Wolff A.C. Diabetes mellitus and breast cancer outcomes: A systematic review and meta-analysis. J. Clin. Oncol. Off. J. Am. Soc. Clin. Oncol. 2011;29:40–46. doi: 10.1200/JCO.2009.27.3011. - DOI - PMC - PubMed