

Sequence Properties of An Intramolecular Interaction That Inhibits p53 DNA Binding
- PMID: 36358908
- PMCID: PMC9687289
- DOI: 10.3390/biom12111558
Sequence Properties of An Intramolecular Interaction That Inhibits p53 DNA Binding
Abstract
An intramolecular interaction between the p53 transactivation and DNA binding domains inhibits DNA binding. To study this autoinhibition, we used a fragment of p53, referred to as ND WT, containing the N-terminal transactivation domains (TAD1 and TAD2), a proline rich region (PRR), and the DNA binding domain (DBD). We mutated acidic, nonpolar, and aromatic amino acids in TAD2 to disrupt the interaction with DBD and measured the effects on DNA binding affinity at different ionic strengths using fluorescence anisotropy. We observed a large increase in DNA binding affinity for the mutants consistent with reduced autoinhibition. The ΔΔG between DBD and ND WT for binding a consensus DNA sequence is -3.0 kcal/mol at physiological ionic strength. ΔΔG increased to -1.03 kcal/mol when acidic residues in TAD2 were changed to alanine (ND DE) and to -1.13 kcal/mol when all the nonpolar residues, including W53/F54, were changed to alanine (ND NP). These results indicate there is some cooperation between acidic, nonpolar, and aromatic residues from TAD2 to inhibit DNA binding. The dependence of DNA binding affinity on ionic strength was used to predict excess counterion release for binding both consensus and scrambled DNA sequences, which was smaller for ND WT and ND NP with consensus DNA and smaller for scrambled DNA overall. Using size exclusion chromatography, we show that the ND mutants have similar Stokes radii to ND WT suggesting the mutants disrupt autoinhibition without changing the global structure.
Keywords: DNA binding; counterion condensation theory; fluorescence anisotropy; hydrodynamic radius; intramolecular interaction; intrinsically disordered proteins; salt-dependent binding affinity; tumor suppressor p53; van’t Hoff.
Conflict of interest statement
The authors declare no conflict of interest. The funders had no role in the design of the study; in the collection, analyses, or interpretation of data; in the writing of the manuscript; or in the decision to publish the results.
Figures


 is DBD,
  is ND WT,
 is ND DE,
  is ND NP,
  is ND QS, (b) p53 constructs binding scrambled DNA, where
  is DBD,
  is ND WT,
  is ND DE, DNA,
  is ND NP,
  is ND QS, (c) ΔG of all fragments with consensus and scrambled DNA. Each data set represents three titrations.
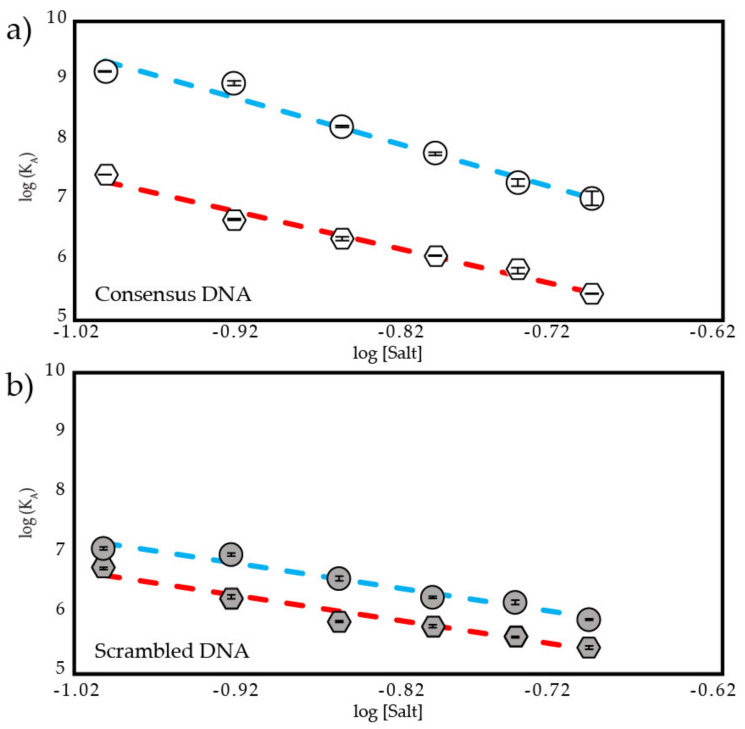
 is DBD,
  is ND WT, (b) DBD and ND WT binding to scrambled DNA where
  is DBD,
  is ND WT. R2 values for all fit lines are between 0.96 and 0.99.
 is ND DE,
  is ND NP,
  is ND QS (b) ND mutants binding scrambled DNA, where
  is ND DE,
  is ND QS. Inset shows ND NP binding scrambled DNA,
  . R2 values for all fit lines are between 0.96 and 0.99.
 is the salt-dependent component and
  is the salt-independent component for consensus DNA and
  is the salt-dependent component and
  is the salt-independent component for scrambled DNA.
 DBD,
DBD,  ND DE,
  ND NP,
  ND QS,
  ND WT.
References
-
- Tishler R.B., Calderwood S.K., Coleman C.N., Price B.D. Increases in sequence specific DNA binding by p53 following treatment with chemotherapeutic and DNA damaging agents. Cancer Res. 1993;53((Suppl. 10)):2212–2216. - PubMed
-
- Hainaut P., Hollstein M. p53 and human cancer: The first ten thousand mutations. Adv. Cancer Res. 2000;77:81–137. - PubMed
Publication types
MeSH terms
Substances
Grants and funding
LinkOut - more resources
Full Text Sources
Research Materials
Miscellaneous
