. 2022 Nov 2;12(11):1617.
doi: 10.3390/biom12111617.

EZH2 as a Prognostic Factor and Its Immune Implication with Molecular Characterization in Prostate Cancer: An Integrated Multi-Omics in Silico Analysis

Affiliations

EZH2 as a Prognostic Factor and Its Immune Implication with Molecular Characterization in Prostate Cancer: An Integrated Multi-Omics in Silico Analysis

Tian-Qi Du et al. Biomolecules. .

Abstract

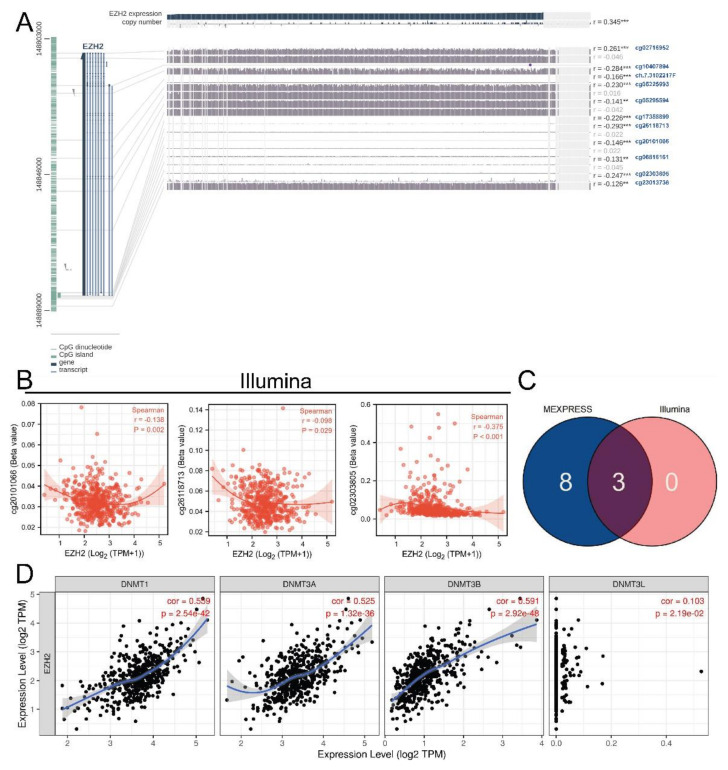
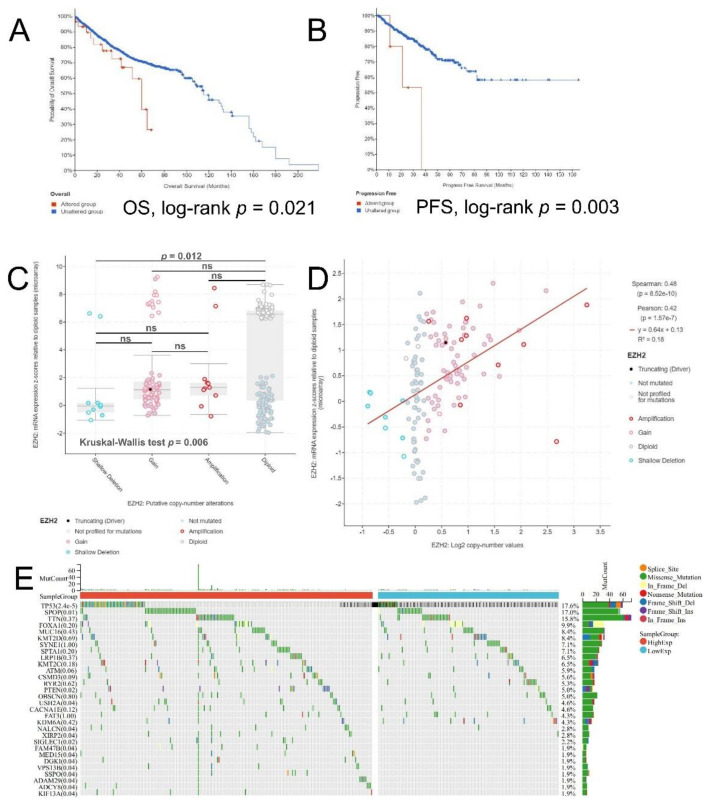
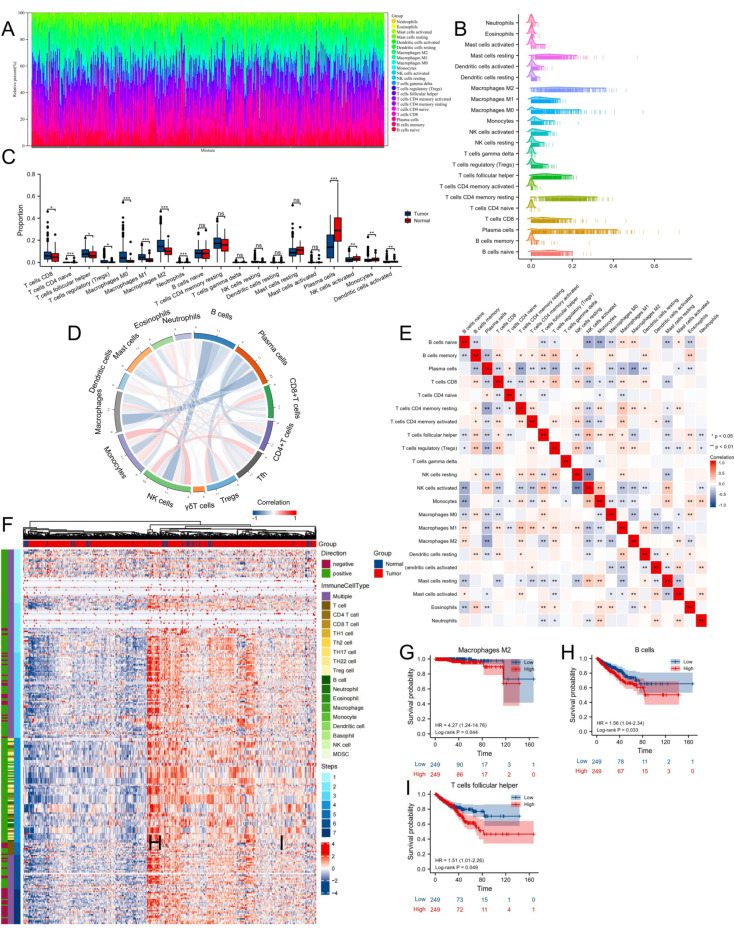
Prostate cancer (PCa) is a type of potentially fatal malignant tumor. Immunotherapy has shown a lot of potential for various types of solid tumors, but the benefits have been less impressive in PCa. Enhancer of zeste homolog 2 (EZH2) is one of the three core subunits of the polycomb repressive complex 2 that has histone methyltransferase activity, and the immune effects of EZH2 in PCa are still unclear. The purpose of this study was to explore the potential of EZH2 as a prognostic factor and an immune therapeutic biomarker for PCa, as well as the expression pattern and biological functions. All analyses in this study were based on publicly available databases, mainly containing Cancer Genome Atlas (TCGA), Gene Expression Omnibus (GEO), UCSCXenaShiny, and TISIDB. We performed differential expression analysis, developed a prognostic model, and explored potential associations between EZH2 and DNA methylation modifications, tumor microenvironment (TME), immune-related genes, tumor mutation burden (TMB), tumor neoantigen burden (TNB), and representative mismatch repair (MMR) genes. We also investigated the molecular and immunological characterizations of EZH2. Finally, we predicted immunotherapeutic responses based on EZH2 expression levels. We found that EZH2 was highly expressed in PCa, was associated with a poor prognosis, and may serve as an independent prognostic factor. EZH2 expression in PCa was associated with DNA methylation modifications, TME, immune-related genes, TMB, TNB, and MMR. By gene set enrichment analysis and gene set variation analysis, we found that multiple functions and pathways related to tumorigenesis, progression, and immune activation were enriched. Finally, we inferred that immunotherapy may be more effective for PCa patients with low EZH2 expression. In conclusion, our study showed that EZH2 could be a potentially efficient predictor of prognosis and immune response in PCa patients.

Keywords: EZH2; bioinformatics; immunotherapy; prognosis; prostate cancer.


Conflict of interest statement

The funders had no role in the design of the study; in the collection; analyses; or interpretation of data; in the writing of the manuscript; or in the decision to publish the results.

Figures

Figure 1
Figure 1
EZH2 mRNA expression levels between tumor and normal samples. EZH2 mRNA expression levels in (A) pan-cancer and (B) PCa from TCGA database. (C) The EZH2 mRNA expression by pairwise boxplot in Pca from TCGA. (D) EZH2 mRNA expression levels in pan-cancers from PCAWG. (E) Interactive bodymap of EZH2 in humans using GEPIA database. No significance, p-values < 0.05, 0.01, 0.001 and 0.0001 were presented as “ns”, “*”, “**”, “***”, and “****”, respectively.
Figure 2
Figure 2
IHC analysis of EZH2. The representative photomicrographs of EZH2 IHC staining with (A) strong, (B) moderate, and (C) weak intensity. (D) MOD values of IHC between tumor and normal samples. p-values < 0.05 was presented as “*”.
Figure 3
Figure 3
Associations between EZH2 expression and clinicopathologic parameters. (A) Associations between EZH2 expression and clinicopathologic parameters using MEXPRESS. Violin plots indicating EZH2 expression in different (B) T stage, (C) N stage, (D) residual tumor, (E) PSA, and (F) Gleason score from the TCGA database. No significance, p-values < 0.05, 0.01, and 0.001 were presented as “ns”, “*”, “**”, and “***”, respectively.
Figure 4
Figure 4
Prognostic value of EZH2 in PCa. The survival curves of EZH2 high- and low-expression groups in (A) OS, (B) PFS, and (C) DSS. (D) Diagnostic ROC curve of EZH2. Time-dependent survival ROC curves of (E) 1-, 2-, 3-year PFS and (F) 3-, 5-, 7-year OS. (G) Nomogram and (H) ROC curves of 1-, 2-, and 3-year PFS probabilities. (I) 1-, 2-, and 3-year PFS calibration curves. (J) DCA of prognostic model.
Figure 5
Figure 5
Associations between EZH2 expression and DNA methylation modification. Associations between EZH2 expression and methylation CpG sites in (A) MEXPRESS and in (B) Illumina. (C) Venn diagram indicates the shared methylation CpG sites from MEXPRESS and Illumina. (D) Associations between EZH2 expression and DNMTs. p-values < 0.01, and 0.001 were presented as “**”, and “***”, respectively.
Figure 6
Figure 6
Genetic alteration analysis of EZH2. The survival curves of EZH2 unaltered and altered groups in (A) OS and (B) PFS. (C) Deletion, diploid, copy number gain and amplification are involved in the deregulation of EZH2 expression as analyzed by cBioPortal. (D) Association between EZH2 mRNA expression and CNV. (E) Waterfall plot shows the mutation landscape by using WGS data from the TCGA-PRAD database.
Figure 7
Figure 7
DEGs and prediction of upstream miRNAs and lncRNAs of EZH2: (A) Volcano map of DEGs; (B) Correlation heat map of the top 5 up- and down-regulated genes with EZH2; (C) Correlations of EZH2 with COX7B2 and SMR3B expression in PRAD; (D) Correlations of EZH2 with miR-26a-5p in PRAD; (E) Network indicates potential upstream miRNAs and lncRNAs that may modulate EZH2; (F) The GAS5, THUMPD3-AS1, and WASIR2/miR-26a-5p/EZH2 axis. No significance, p-values < 0.05, 0.01, and 0.001 were presented as “ns”, “*”, “**”, and “***”, respectively.
Figure 8
Figure 8
Evaluation of the proportions of immune cell infiltration by CIBERSORTx in TCGA-PRAD cohorts. (A) Bar plot and (B) ridge plot show the proportion of 22 types of immune cell infiltration. (C) Boxplots show the differences in the immune cell distribution between tumor and normal tissues. (D) Chord diagram and (E) heatmap show the correlation patterns of infiltrating immune cells. (F) Heatmap shows the status of anti-cancer immunity across 7-step Cancer-Immunity Cycle. (G) The survival curves of macrophages M2 high- and low-infiltration groups in OS. The survival curves of (H) B cell and (I) Tfh high- and low-infiltration groups in PFS. No significance, p-values < 0.05, 0.01, and 0.001 were presented as “ns”, “*”, “**”, and “***”, respectively.
Figure 9
Figure 9
Correlations between EZH2 expression level and (A,B) immuno-inhibitor genes, (C,D) immuno-stimulator genes, (E) immune subtypes, (F) MSI, (G) TMB, (H) TNB, and (I) MMR genes. No significance, p-values < 0.05, 0.01, and 0.001 were presented as “ns”, “*”, “**”, and “***”, respectively.
Figure 10
Figure 10
EZH2-associated GSEA: (A) PPI network of 13 EZH2-associated immuno-inhibitor genes, 14 EZH2-associated immuno-stimulator genes, and the top 50 co-expressed genes using STRING; (B) GO annotation of the abovementioned 77 genes; (C) Enriched GO terms network from WebGestalt; (D) KEGG and Reactome pathway enrichment analyses of the abovementioned 77 genes using KOBAS-i.
Figure 11
Figure 11
EZH2-associated GSVA: (A,B) GSVA of hallmark, BioCarta, KEGG, Reactome, and GO gene sets in EZH2 high- and low-expression samples from TCGA-PRAD database; (C) GSVA of 7-step Cancer-Immunity Cycle and Immunoscore in EZH2 high- and low-expression samples from TCGA-PRAD database; (D) Correlations between and within the MSigDB immune-related biological processes and pathways and 7-step Cancer-Immunity Cycle. p-values < 0.05, 0.01, and 0.001 were presented as “*”, “**”, and “***”, respectively.
Figure 12
Figure 12
Immunotherapeutic response and drug sensitivity prediction: (A) The correlations between EZH2 and MHC, EC, SC, CP, and IPS score in TCGA-PRAD; (B) Box-violin plot shows the ImmuCellAI score of EZH2 high- and low-expression groups; (C) Box-violin plot shows the distribution of EZH2 for patients with different immunotherapeutic responses in GSE168204 cohort; (D) ROC curves of EZH2, TIDE, TIS, IPS, and ImmuCellAI measuring the predictive value about objective response to ICB in GSE168204 cohort; (E) Lollipop chart shows the correlation between EZH2 expression and drug sensitivity of tumor cells by RNAactDrug. p-values < 0.05, 0.01, and 0.001 were presented as “*”, “**”, and “***”, respectively.

References

    1. Sung H., Ferlay J., Siegel R.L., Laversanne M., Soerjomataram I., Jemal A., Bray F. Global Cancer Statistics 2020: GLOBOCAN Estimates of Incidence and Mortality Worldwide for 36 Cancers in 185 Countries. CA Cancer J. Clin. 2021;71:209–249. doi: 10.3322/caac.21660. - DOI - PubMed
    1. Gandaglia G., Leni R., Bray F., Fleshner N., Freedland S.J., Kibel A., Stattin P., Van Poppel H., La Vecchia C. Epidemiology and Prevention of Prostate Cancer. Eur. Urol. Oncol. 2021;4:877–892. doi: 10.1016/j.euo.2021.09.006. - DOI - PubMed
    1. Cha H.R., Lee J.H., Ponnazhagan S. Revisiting Immunotherapy: A Focus on Prostate Cancer. Cancer Res. 2020;80:1615–1623. doi: 10.1158/0008-5472.CAN-19-2948. - DOI - PMC - PubMed
    1. Bilusic M., Madan R.A., Gulley J.L. Immunotherapy of Prostate Cancer: Facts and Hopes. Clin. Cancer Res. 2017;23:6764–6770. doi: 10.1158/1078-0432.CCR-17-0019. - DOI - PMC - PubMed
    1. Park S.H., Fong K.W., Mong E., Martin M.C., Schiltz G.E., Yu J. Going beyond Polycomb: EZH2 functions in prostate cancer. Oncogene. 2021;40:5788–5798. doi: 10.1038/s41388-021-01982-4. - DOI - PMC - PubMed

Publication types

MeSH terms

Substances