Mimicking Pseudo-Virion Interactions with Abiotic Surfaces: Deposition of Polymer Nanoparticles with Albumin Corona
- PMID: 36359008
- PMCID: PMC9687657
- DOI: 10.3390/biom12111658
Mimicking Pseudo-Virion Interactions with Abiotic Surfaces: Deposition of Polymer Nanoparticles with Albumin Corona
Abstract
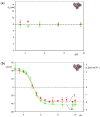
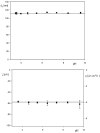
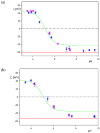
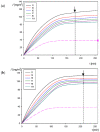
Adsorption of human serum albumin (HSA) molecules on negatively charged polystyrene microparticles was studied using the dynamic light scattering, the electrophoretic and the solution depletion methods involving atomic force microscopy. Initially, the physicochemical characteristics of the albumin comprising the hydrodynamic diameter, the zeta potential and the isoelectric point were determined as a function of pH. Analogous characteristics of the polymer particles were acquired, including their size and zeta potential. The formation of albumin corona on the particles was investigated in situ by electrophoretic mobility measurements. The size, stability and electrokinetic properties of the particles with the corona were also determined. The particle diameter was equal to 125 nm, which coincides with the size of the SARS-CoV-2 virion. The isoelectric point of the particles appeared at a pH of 5. The deposition kinetics of the particles was determined by atomic force microscopy (AFM) under diffusion and by quartz microbalance (QCM) under flow conditions. It was shown that the deposition rate at a gold sensor abruptly vanished with pH following the decrease in the zeta potential of the particles. It is postulated that the acquired results can be used as useful reference systems mimicking virus adsorption on abiotic surfaces.
Keywords: adsorption of albumin; albumin coronas of particles; deposition of polymer albumin conjugates; stability of albumin corona; virus deposition; zeta potential of albumin corona.
Conflict of interest statement
The authors declare no conflict of interest.
Figures


Similar articles
-
Deposition of Human-Serum-Albumin-Functionalized Spheroidal Particles on Abiotic Surfaces: Reference Kinetic Results for Bioparticles.Molecules. 2024 Jul 20;29(14):3405. doi: 10.3390/molecules29143405. Molecules. 2024. PMID: 39064983 Free PMC article.
-
SARS-CoV-2 Spike Protein (RBD) Subunit Adsorption at Abiotic Surfaces and Corona Formation at Polymer Particles.Int J Mol Sci. 2022 Oct 15;23(20):12374. doi: 10.3390/ijms232012374. Int J Mol Sci. 2022. PMID: 36293231 Free PMC article.
-
Deposition of Polymer Particles with Fibrinogen Corona at Abiotic Surfaces under Flow Conditions.Molecules. 2021 Oct 18;26(20):6299. doi: 10.3390/molecules26206299. Molecules. 2021. PMID: 34684880 Free PMC article.
-
Nanoparticle and bioparticle deposition kinetics.Adv Colloid Interface Sci. 2022 Apr;302:102630. doi: 10.1016/j.cis.2022.102630. Epub 2022 Mar 1. Adv Colloid Interface Sci. 2022. PMID: 35313169 Review.
-
SARS-CoV-2 virion physicochemical characteristics pertinent to abiotic substrate attachment.Curr Opin Colloid Interface Sci. 2021 Oct;55:101466. doi: 10.1016/j.cocis.2021.101466. Epub 2021 Jun 2. Curr Opin Colloid Interface Sci. 2021. PMID: 34093061 Free PMC article. Review.
Cited by
-
Deposition of Human-Serum-Albumin-Functionalized Spheroidal Particles on Abiotic Surfaces: Reference Kinetic Results for Bioparticles.Molecules. 2024 Jul 20;29(14):3405. doi: 10.3390/molecules29143405. Molecules. 2024. PMID: 39064983 Free PMC article.
-
Quantifying Nanoparticle Layer Topography: Theoretical Modeling and Atomic Force Microscopy Investigations.Langmuir. 2023 Oct 24;39(42):15067-15077. doi: 10.1021/acs.langmuir.3c02024. Epub 2023 Oct 12. Langmuir. 2023. PMID: 37824293 Free PMC article.
References
-
- Martín-Rodríguez A., Ortega-Vinuesa J.L., Hidalgo-Álvarez R. Interfacial Electrokinetics and Electrophoresis. In: Delgado Á.V., editor. Surfactant Science. Marcel Dekker, Inc.; New York, NY, USA: 2002. pp. 641–670.
-
- Kawaguchi H. Latex Diagnosis. In: Ohshima E., editor. Encyclopedia of Biocolloid and Biointerface Science 2V Set. 1st ed. Volume 2. John Wiley & Sons; New York, NY, USA: 2016. Chapter 50.
-
- Visalakshan R.M., MacGregor M.N., Sasidharan S., Ghazaryan A., Mierczynska-Vasilev A.M., Morsbach S., Mailänder V., Landfester K., Hayball J.D., Vasilev K. Biomaterial Surface Hydrophobicity-Mediated Serum Protein Adsorption and Immune Responses. ACS Appl. Mater. Interfaces. 2019;11:27615–27623. doi: 10.1021/acsami.9b09900. - DOI - PubMed
-
- Luby A.O., Breitner E.K., Comfort K.K. Preliminary protein corona formation stabilizes gold nanoparticles and improves deposition efficiency. Appl. Nanosci. 2016;6:827–836. doi: 10.1007/s13204-015-0501-z. - DOI
MeSH terms
Substances
LinkOut - more resources
Full Text Sources
Medical
Miscellaneous

