. 2022 Oct 26;11(21):3377.
doi: 10.3390/cells11213377.

Emerging Role of miR-21-5p in Neuron-Glia Dysregulation and Exosome Transfer Using Multiple Models of Alzheimer's Disease

Affiliations

Emerging Role of miR-21-5p in Neuron-Glia Dysregulation and Exosome Transfer Using Multiple Models of Alzheimer's Disease

Gonçalo Garcia et al. Cells. .

Abstract

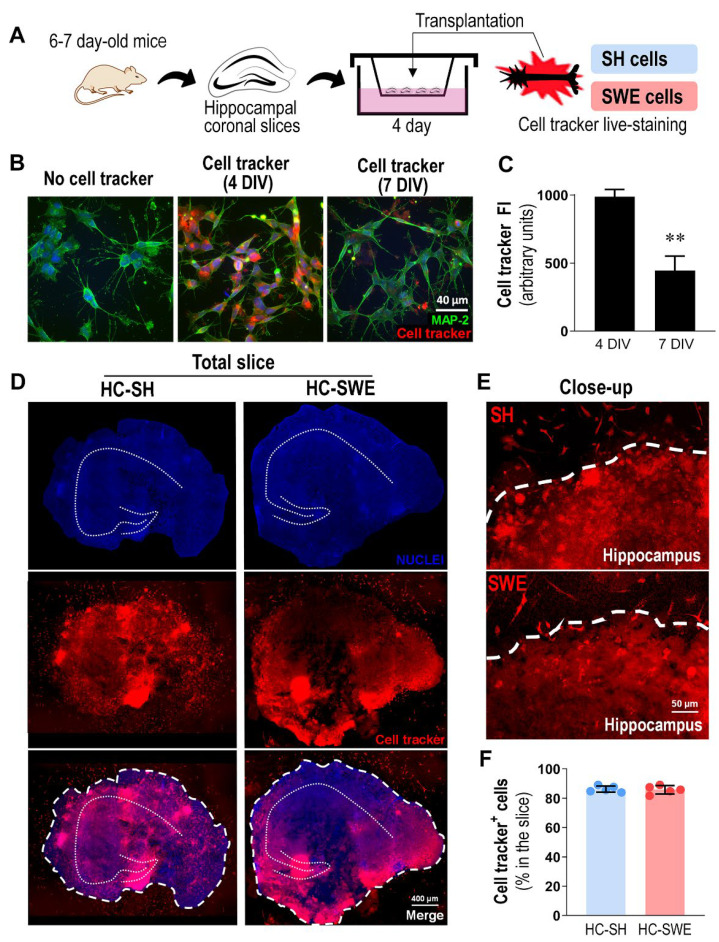
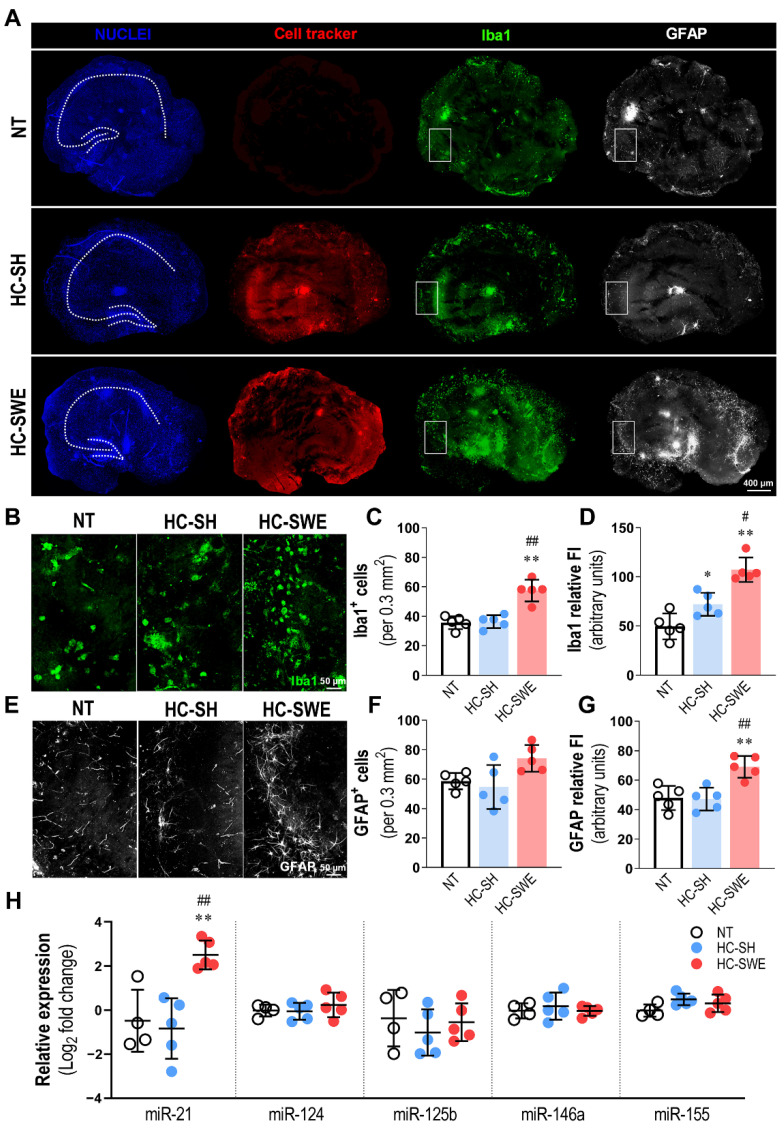
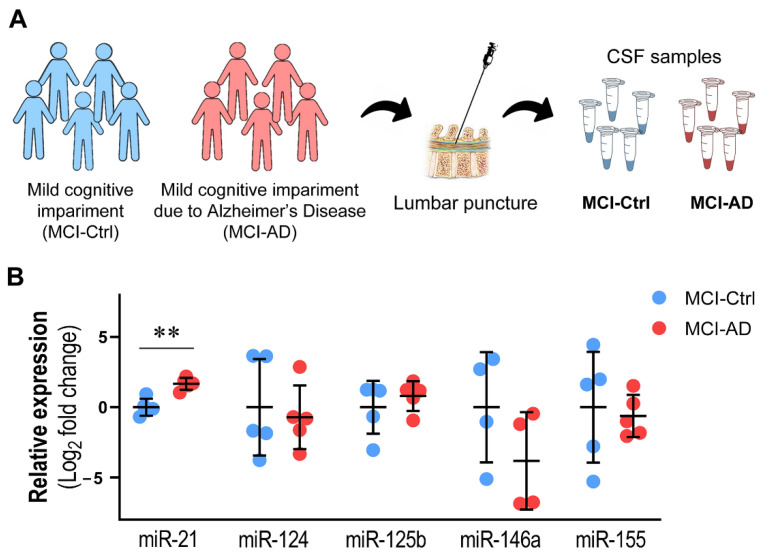
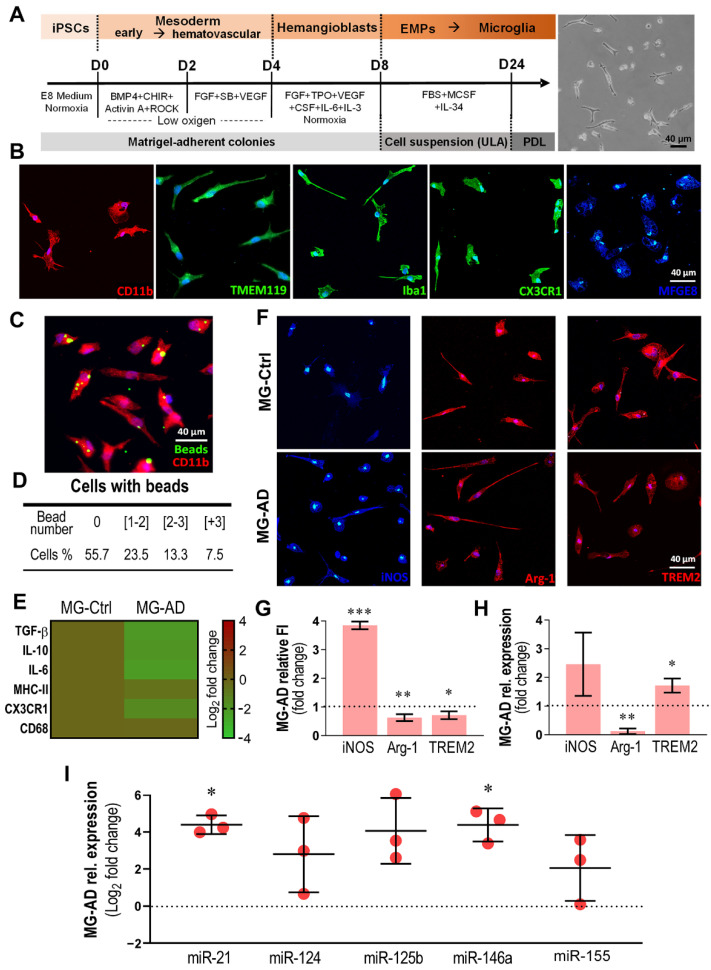
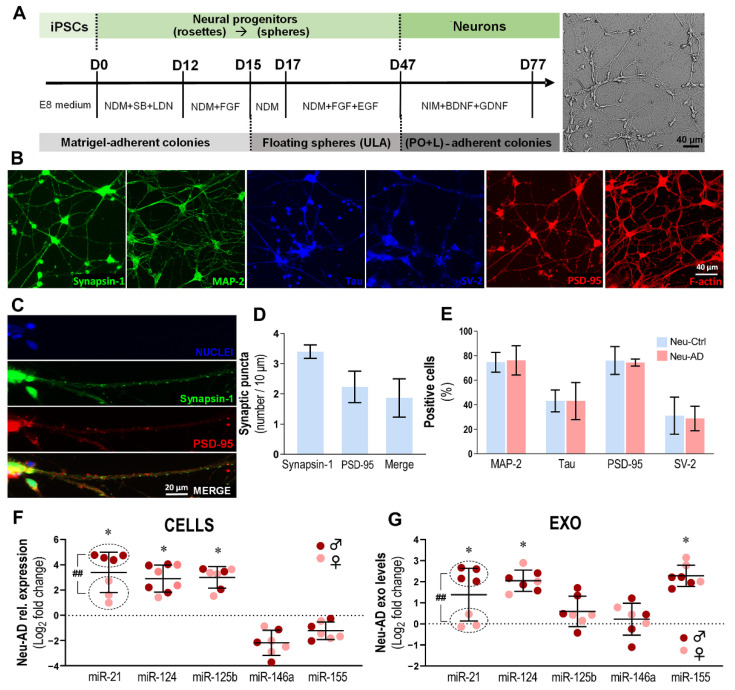
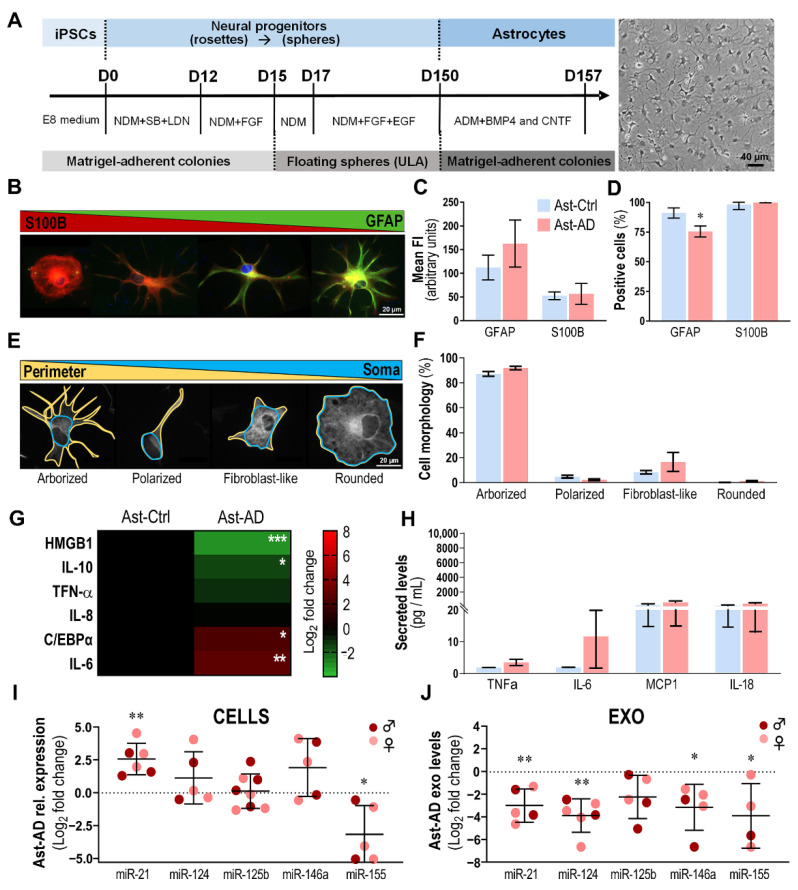
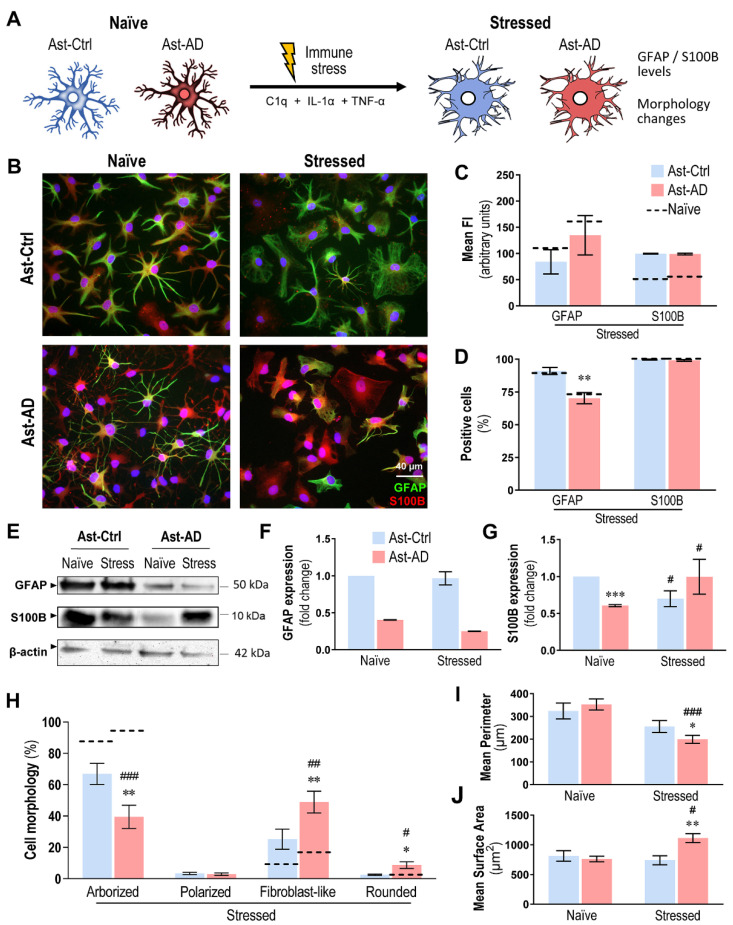
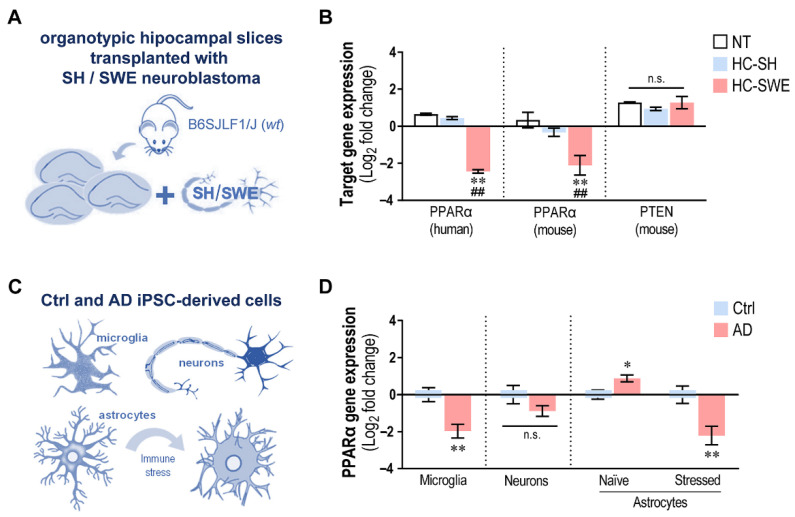
Alzheimer's disease (AD) is a neurodegenerative disorder associated with neuron-glia dysfunction and dysregulated miRNAs. We previously reported upregulated miR-124/miR-21 in AD neurons and their exosomes. However, their glial distribution, phenotypic alterations and exosomal spread are scarcely documented. Here, we show glial cell activation and miR-21 overexpression in mouse organotypic hippocampal slices transplanted with SH-SY5Y cells expressing the human APP695 Swedish mutation. The upregulation of miR-21 only in the CSF from a small series of mild cognitive impairment (MCI) AD patients, but not in non-AD MCI individuals, supports its discriminatory potential. Microglia, neurons, and astrocytes differentiated from the same induced pluripotent stem cells from PSEN1ΔE9 AD patients all showed miR-21 elevation. In AD neurons, miR-124/miR-21 overexpression was recapitulated in their exosomes. In AD microglia, the upregulation of iNOS and miR-21/miR-146a supports their activation. AD astrocytes manifested a restrained inflammatory profile, with high miR-21 but low miR-155 and depleted exosomal miRNAs. Their immunostimulation with C1q + IL-1α + TNF-α induced morphological alterations and increased S100B, inflammatory transcripts, sAPPβ, cytokine release and exosomal miR-21. PPARα, a target of miR-21, was found to be repressed in all models, except in neurons, likely due to concomitant miR-125b elevation. The data from these AD models highlight miR-21 as a promising biomarker and a disease-modifying target to be further explored.

Keywords: CSF miRNAs; PSEN1ΔE9 expressing cells; SH-SY5Y APP SWE cells; exosomal miRNAs; glial activation; hippocampal neuroblastoma transplantation; iPSC-derived AD models; immunostimulated astrocytes; inflammation-associated miRNAs; inflammatory mediators.


Conflict of interest statement

The authors declare no competing interests or any other conflict of interest.

Figures

Figure 1
Figure 1
SH and SWE neuroblastoma cells were efficiently transplanted into mouse organotypic hippocampal coronal slices. (A) Schematic representation of the transplantation process after SH/SWE live-cell staining with cell tracker. (B) Representative fluorescence images showing cell tracker (red) after 4 and 7 days in vitro (DIV). Neuroblastoma cells were immunostained with MAP-2, and nuclei were counterstained with Hoechst. (C) Cell tracker fluorescence quantification in SH/SWE after 4 and 7 DIV. (D) Representative fluorescence images of HC-SH or HC-SWE. Dotted lines represent a schematic outline of the hippocampal structure, and bold dashed lines delimit the margins of the organotypic hippocampal slices. Separate images are provided for nuclei and cell tracker, complemented with a merged image. (E) Representative close-up images for HC-SH and HC-SWE showing cell-tracker-positive SH or SWE cells inside and outside the margins of each hippocampal slice, with (F) respective quantification of cells grafted in the hippocampal slice. Scale bars correspond to 40 µm (B), 400 µm (D) and 50 µm (E). Results are mean ± SEM from five independent experiments. Two-tailed Student’s t-test: ** p < 0.01 vs. 4 DIV. SH, SH-SY5Y neuroblastoma cells; SWE, SH-SY5Y cells expressing human APP695 Swedish mutation; DIV, days in vitro; FI, fluorescence intensity; HC-SH, hippocampal cultures with engrafted SH cells; HC-SWE, hippocampal cultures with engrafted SWE cells; MAP-2, microtubule-associated protein 2.
Figure 2
Figure 2
HC-SWE slices evidence an increased number of Iba1+ cells, enhanced Iba1/GFAP fluorescence intensities and upregulated miR-21 expression as compared with NT and HC-SH slices. (A) Representative fluorescence images of non-transplanted (NT) and hippocampal cultures with engrafted cells (HC-SH and HC-SWE). Nuclei (in blue), cell tracker+ (in red), Iba1+ (in green) and GFAP+ (in white), all shown separately. Dotted lines represent a schematic outline of the hippocampal structure. White rectangles are sections from similar hippocampal regions used for the close-up visualization. (B) Close-up images of Iba1+ cells. (C) Total quantification of the number of Iba1+ cells and (D) total Iba1 fluorescence intensity. (E) Close-up images of GFAP+ cells, (F) total quantification of the number of GFAP+ cells and (G) total GFAP fluorescence intensity. (H) miRNA quantification in HC-SWE vs. NT hippocampi, presented as the binary logarithm of fold change. Scale bars correspond to 400 µm (A) and 50 µm (B,E). Results are mean ± SEM from five independent experiments. Two-tailed Student’s t-test: * p < 0.05 and ** p < 0.01 vs. NT; # p < 0.05 and ## p < 0.01 vs. HC-SH. SH, SH-SY5Y neuroblastoma cells; SWE, SH-SY5Y cells expressing human APP695 Swedish mutation; NT, non-transplanted hippocampal slices; HC-SH, hippocampal slices transplanted with SH cells; HC-SWE, hippocampal slices transplanted with SWE cells; FI, fluorescence intensity; GFAP, Glial fibrillary acidic protein; Iba1, ionized calcium binding adaptor molecule 1.
Figure 3
Figure 3
Exploratory miRNA profile in the cerebrospinal fluid (CSF) from MCI patients who fulfilled criteria for MCI due to AD (MCI-AD) vs. MCI patients with no biomarker criteria for AD (MCI-Ctrl). (A) Schematic representation of the MCI-AD and MCI-Ctrl series and the procedure to obtain CSF samples by lumbar puncture. (B) The miRNA profile in the CSF samples from MCI-AD (red dots) side-by-side with the miRNA profile in the CSF from MCI-Ctrl (blue dots). The results are mean ± SEM presented as the binary logarithm of fold change from five different subjects of each group. Mann–Whitney U test with Bonferroni post hoc correction: ** p < 0.01, MCI-AD vs. MCI-Ctrl. AD, Alzheimer’s disease; Ctrl, control; MCI, mild cognitive impairment.
Figure 4
Figure 4
MG-AD cells show increased iNOS, miR-21 and miR-146a, as well as decreased Arg-1 and TREM2, consistent with an inflammatory signature. (A) Schematic representation of iPSC differentiation into microglia (MG), as detailed in Materials and Methods. (B) Characterization of microglial cells for CD11b, TMEM119, Iba1, CX3CR1 and MFGE8 markers. Nuclei were counterstained with Hoechst. (C) Representative image of microglia phagocytosing green zymosan fluorescent beads. (D) Percentage of cells phagocytosing a distinct number of beads. (E) Inflammatory gene heatmap representation (TGF-β, IL-10, IL-6, MHC-II, CX3CR1 and CD68) in MG-AD vs. MG-Ctrl obtained by RT-qPCR. (F) Representative images of iNOS, Arg-1 and TREM2 immunofluorescence signal in AD-MG and Ctrl-MG and (G) their respective quantification. (H) Gene expression data for iNOS, Arg-1 and TREM2 for MG-AD vs. MG-Ctrl (dotted line), determined by RT-qPCR. (I) Quantification of immune-related miRNAs in AD-MG vs. Ctrl-MG (dotted line), shown as the binary logarithm of fold change. All scale bars correspond to 40 µm. Results are mean ± SEM from three independent experiments performed on iPSC-derived microglia from an AD female patient carrying the PSEN1ΔE9 deletion and in a matched control. Two-tailed Student’s t-test: * p < 0.05, ** p < 0.01 and *** p < 0.001, MG-AD vs. MG-Ctrl (dotted line). MG, iPSC-induced microglia; AD, Alzheimer’s disease; Ctrl, control; BMP4, bone morphogenetic protein 4; CHIR, glycogen synthase kinase 3β inhibitor; ROCK, rho-associated protein kinase inhibitor; FGF, fibroblast growth factor; SB, SB431542; VEGF, vascular endothelial growth factor TPO, thrombopoietin; CSF, colony-stimulating factor; FBS, fetal bovine serum; MCSF, macrophage-colony-stimulating factor; EMPs, erythro-myeloid progenitors; ULA, ultra-low-attachment plates; PDL, poly-D-lysine; TGF-β, transforming growth factor β; IL, interleukin; MHC-II, major histocompatibility complex class II; CX3CR1, CX3C motif chemokine receptor 1; CD68, cluster of differentiation 68; iNOS, inducible nitric oxide synthase; TREM-2, triggering receptor expressed on myeloid cells 2; Arg-1, arginase; MFGE8, milk fat globule-EGF factor 8 protein; Iba1, ionized calcium binding adaptor molecule 1.
Figure 5
Figure 5
Characterization reveals successfully differentiated and maturated neurons, while Neu-AD cell lines show alterations in intracellular and exosomal miRNAs, which include the simultaneous elevation of miR-21 and miR-124. (A) Schematic representation of iPSC differentiation into induced neurons (Neu), as detailed in Materials and Methods. (B) iPSC-derived neurons express the typical neuronal markers synapsin-1, MAP-2, Tau, SV-2, PSD-95 and F-actin. (C) Representative images of synaptic puncta in neurons, with co-localization of synapsin-1 and PSD-95, and (D) quantification of individual and double-labeled puncta. Nuclei were counterstained with Hoechst. (E) Comparative number of cells expressing MAP-2, Tau, PSD-95 and SV-2 protein markers in neurons from AD and Ctrl donors. (F) Quantification of the selected inflamma-miRNAs in Neu-AD cell lines and (G) in their derived exosomes expressed as the binary logarithm of fold change vs. Neu-Ctrl cells (dotted line). Samples from a male patient (in blue dots) and a female patient (in pink dots) were distinguished. Scale bars correspond to 40 µm in (A,B) and to 20 µm in (C). Results are mean ± SEM from at least 7 independent experiments. Two-tailed Student’s t-test: * p < 0.05, Neu-AD vs. Neu-Ctrl; ## p < 0.01, male (n = 4) vs. female (n = 3) samples. Neu, iPSC-induced neurons; AD, Alzheimer’s disease; Ctrl, control; EXO, exosomes. SV-2, synaptic vesicle protein 2; PSD-95, postsynaptic density protein; MAP-2, microtubule-associated protein-2; F-actin, filamentous actin; NDM, neural differentiation media; LDN, LDN193189 dihydrochloride; SB, SB431542; FGF, fibroblast growth factor; EGF, epidermal growth factor; NIM, neural induction media; BDNF, brain-derived neurotrophic factor; GDNF, glial-cell-derived neurotrophic factor; ULA, ultra-low-attachment plates; PO, poly-L-ornithine; L, laminin; D, day.
Figure 6
Figure 6
Ast-AD cells show fewer GFAP-positive cells and dysregulated immune-related markers, together with dissimilar miR-21 profiles in cells and exosomes. (A) Schematic representation of iPSC differentiation into induced astrocytes (Ast), as detailed in Materials and Methods. (B) Astrocytes display a range from almost exclusively S100B+ cells to GFAP+ cells. Nuclei were counterstained with Hoechst. (C) GFAP and S100B mean fluorescent intensities (FIs) of Ast-Ctrl and Ast-AD cells. (D) Number of GFAP- and S100B-positive cells in Ast-Ctrl and Ast-AD cells. (E) Morphological diversity of astrocytes based on the cell perimeter (yellow outline) and cell soma (blue outline). Cells with more than two branches were considered arborized; cells with a single branch and an acentric nucleus were classified as polarized; cells with no ramifications and an irregular shape were considered fibroblast-like; and cells with a circular shape were classified as rounded. (F) Percentage of arborized, polarized, fibroblast-like and rounded AD and Ctrl astrocytes. (G) Heatmap representation of differentially expressed immune-related genes in Ast-AD vs. Ast-Ctrl cells. (H) Inflammatory-associated cytokine profile in the secretome of Ast-AD cells vs. that of Ast-Ctrl cells, determined by LEGENDplex flow cytometry assay. (I) Cell quantification of inflamma-miRNAs in Ast-AD vs. Ast-Ctrl (dotted line) in cells and (J) in exosomes, expressed as the binary logarithm of the obtained fold change. No differences in AD samples were found between male/female miRNA data. Scale bars correspond to 40 µm (A) and 20 µm (B,C). Results are mean ± SEM from at least five independent experiments. Two-tailed Student’s t-test: * p < 0.05, ** p < 0.01 and *** p < 0.001, Ast-AD vs. Ast-Ctrl, for all. iPSC, induced pluripotent stem cells; D, days; Ast, iPSC-induced astrocytes; AD, Alzheimer’s disease; Ctrl, control; EXO, exosomes; NDM, neural differentiation media; SB, SB431542; LDN, LDN193189 dihydrochloride; FGF, fibroblast growth factor; EGF, epidermal growth factor; ADM, astrocyte differentiation medium; BMP4, bone morphogenetic protein 4; CNTF, ciliary neurotrophic factor; ULA, ultra-low-attachment plate; HMGB1, high-mobility group box 1; IL, interleukin; TNF-α, tumor necrosis factor alpha; C/EBPα, CCAAT/enhancer-binding protein alpha; MCP-1, monocyte chemoattractant protein-1.
Figure 7
Figure 7
Immunostimulation with C1q + IL-1α + TNF-α maintains a reduced number of GFAP-positive Ast-AD cells, while it enhances S100B expression and switches the arborized Ast-AD stressed cells toward fibroblast-like and round cells. (A) Schematic representation of the 48 h immunostimulation model of astrocytes from AD and Ctrl samples (Ast-AD and Ast-Ctrl, respectively), as detailed in Materials and Methods. (B) Representative immunofluorescence images of naïve (non-immunostimulated) and stressed (immunostimulated) Ast-Ctrl and Ast-AD cells. Astrocytes were double-labeled with GFAP (green) and S100B (red). Nuclei were counterstained with Hoechst. (C) GFAP and S100B mean fluorescent intensities (FIs) of stressed Ast-Ctrl and Ast-AD cells vs. naïve ones (dashed line). (D) Number of GFAP- and S100B-positive cells in stressed Ast-Ctrl and Ast-AD cells vs. naïve ones (dashed line). (E) Representative Western blot images of GFAP and S100B cellular levels, with the respective (F) GFAP and (G) S100B densitometric quantifications. (H) Percentage of arborized, polarized, fibroblast-like and rounded cell morphologies after immunostimulation of Ast-Ctrl and Ast-AD cells vs. respective naïve cells (dashed lines). (I) Mean perimeter and (J) mean surface area of naïve and stressed Ast-Ctrl and Ast-AD cells. Scale bar corresponds to 40 µm (B). Results are mean ± SEM from at least 4 independent experiments. For GFAP Western blot quantification, a pool of 4 samples was used. Two-tailed Student’s t-test: * p < 0.05, ** p < 0.01 and *** p < 0.001, Ast-AD vs. Ast-Ctrl in same conditions; # p < 0.05, ## p < 0.01 and ### p < 0.001 immunostimulated vs. respective naïve cells; Ast, iPSC-induced astrocytes; Ctrl, control; AD, Alzheimer’s disease; C1q, complement component 1q; IL-1α; interleukin-1 alpha; TNF-α, tumor necrosis factor alpha; GFAP, glial fibrillary acidic protein; S100B, S100 calcium binding protein B.
Figure 8
Figure 8
Ast-AD cells show increased inflammatory gene expression, sAPPβ release, cytokine secretion and exosomal enrichment in miR-21 after immunostimulation. (A) Schematic representation of the immune activation of both Ast-Ctrl and Ast-AD cells for 48 h with C1q + IL-1α + TNF-α, as detailed in Materials and Methods. (B) Representative Western blot images of sAPPβ released into the cell media, with the respective (C) densitometric quantification. Results were normalized to total secreted protein detected by Amido Black. (D) Heatmap representation of the differentially expressed inflammatory genes in Ast-AD vs. Ast-Ctrl after immune stress. (E) Representative Western blot images of HMGB1 released into the cell media, with the respective (F) densitometric quantification. (G) Secreted inflammatory-associated cytokines by stressed Ast-AD and Ast-Ctrl cells vs. respective naïve cells (dashed line), determined by the LEGENDplex flow cytometry assay. Quantification of inflamma-miRNAs in (H) stressed Ast-AD vs. Ast-Ctrl cells (dotted line), as well as in their (I) exosomes, expressed as the binary logarithm of fold change (FC). Results are mean ± SEM from at least 4 independent experiments. Two-tailed Student’s t-test: * p < 0.05, ** p < 0.01 and *** p < 0.001, Ast-AD vs. Ast-Ctrl; # p < 0.05, ## p < 0.01 and ### p < 0.001, immunostimulated vs. respective naïve cells; no differences were found between male and female samples. Ast, iPSC-induced astrocytes; Ctrl, control; AD, Alzheimer’s disease; EXO, exosomes. C1q, complement component 1q; IL-1α; interleukin-1 alpha; TNF-α, tumor necrosis factor alpha; sAPPβ, soluble amyloid precursor protein beta; HMGB1, high-mobility group box 1; IL, interleukin; C/EBPα, CCAAT/enhancer-binding protein alpha.
Figure 9
Figure 9
Gene expression of the miR-21 target PPARα is repressed in SWE-transplanted organotypic hippocampal cultures, in AD iPSC-derived microglia and in stressed iPSC-derived AD astrocytes. (A) Schematic representation of hippocampal xenotransplantation with the (B) respective gene expression of miR-21 targets: human PPARα, mouse PPARα and mouse PTEN in NT, HC-SH and HC-SWE slices. (C) Schematic representation of Ctrl and AD iPSC-derived microglia, neurons and astrocytes. Astrocytes were also immunostimulated with C1q + IL-1α + TNF-α cocktail, as detailed in Materials and Methods. (D) Gene expression of PPARα in iPSC-derived microglia, neurons and astrocytes (naïve and stressed) from AD patients vs. respective control (Ctrl) cells. Results are mean ± SEM from at least 4 independent experiments, expressed as the binary logarithm of fold change. Two-tailed Student’s t-test: * p < 0.05 and ** p < 0.01 vs. NT/Ctrl; ## p < 0.01 vs. HC-SH. (B) or respective Ctrl cells (D). SH, SH-SY5Y neuroblastoma cells; SWE, SH-SY5Y neuroblastoma cells expressing the human APP695 Swedish mutation; NT, non-transplanted hippocampal slices; HC-SH, hippocampal cultures with engrafted SH cells; HC-SWE, hippocampal cultures with engrafted SWE cells; AD, Alzheimer’s disease; Ctrl, control; PPARα, peroxisome proliferator-activated receptor alpha; PTEN, phosphatase and tensin homolog.

References

    1. El-Hayek Y.H., Wiley R.E., Khoury C.P., Daya R.P., Ballard C., Evans A.R., Karran M., Molinuevo J.L., Norton M., Atri A. Tip of the Iceberg: Assessing the Global Socioeconomic Costs of Alzheimer’s Disease and Related Dementias and Strategic Implications for Stakeholders. J. Alzheimer’s Dis. 2019;70:323–341. doi: 10.3233/JAD-190426. - DOI - PMC - PubMed
    1. Schott J.M., Aisen P.S., Cummings J.L., Howard R.J., Fox N.C. Unsuccessful Trials of Therapies for Alzheimer’s Disease. Lancet. 2019;393:29. doi: 10.1016/S0140-6736(18)31896-8. - DOI - PubMed
    1. Cummings J., Lee G., Nahed P., Zadeh M.E., Kambar N., Zhong K., Fonseca J., Taghva K. Alzheimer’s Disease Drug Development Pipeline: 2022. Alzheimer’s Dement. Transl. Res. Clin. Interv. 2022;8:e12295. doi: 10.1002/trc2.12295. - DOI - PMC - PubMed
    1. Markesbery W.R. Neuropathologic Alterations in Mild Cognitive Impairment: A Review. J. Alzheimer’s Dis. 2010;19:221–228. doi: 10.3233/JAD-2010-1220. - DOI - PMC - PubMed
    1. Albert M.S., DeKosky S.T., Dickson D., Dubois B., Feldman H.H., Fox N.C., Gamst A., Holtzman D.M., Jagust W.J., Petersen R.C., et al. The Diagnosis of Mild Cognitive Impairment Due to Alzheimer’s Disease: Recommendations from the National Institute on Aging-Alzheimer’s Association Workgroups on Diagnostic Guidelines for Alzheimer’s Disease. Alzheimer’s Dement. 2011;7:270–279. doi: 10.1016/j.jalz.2011.03.008. - DOI - PMC - PubMed

Publication types