. 2022 Oct 27;11(21):3394.
doi: 10.3390/cells11213394.

Whole Transcriptome Sequencing Reveals Cancer-Related, Prognostically Significant Transcripts and Tumor-Infiltrating Immunocytes in Mantle Cell Lymphoma

Affiliations

Whole Transcriptome Sequencing Reveals Cancer-Related, Prognostically Significant Transcripts and Tumor-Infiltrating Immunocytes in Mantle Cell Lymphoma

Esra Esmeray Sönmez et al. Cells. .

Abstract

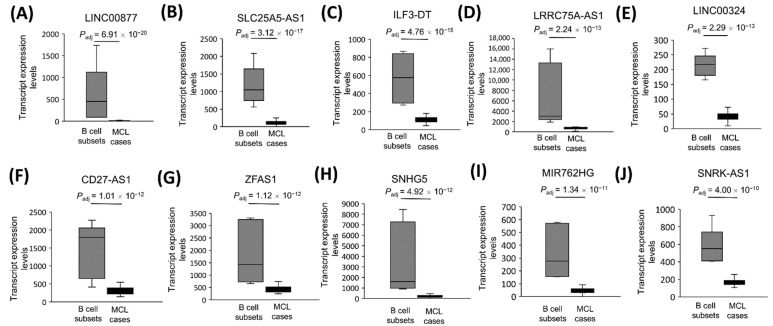
Mantle cell lymphoma (MCL) is an aggressive B-cell non-Hodgkin lymphoma (NHL) subtype characterized by overexpression of CCND1 and SOX11 genes. It is generally associated with clinically poor outcomes despite recent improvements in therapeutic approaches. The genes associated with the development and prognosis of MCL are still largely unknown. Through whole transcriptome sequencing (WTS), we identified mRNAs, lncRNAs, and alternative transcripts differentially expressed in MCL cases compared with reactive tonsil B-cell subsets. CCND1, VCAM1, and VWF mRNAs, as well as MIR100HG and ROR1-AS1 lncRNAs, were among the top 10 most significantly overexpressed, oncogenesis-related transcripts. Survival analyses with each of the top upregulated transcripts showed that MCL cases with high expression of VWF mRNA and low expression of FTX lncRNA were associated with poor overall survival. Similarly, high expression of MSTRG.153013.3, an overexpressed alternative transcript, was associated with shortened MCL survival. Known tumor suppressor candidates (e.g., PI3KIP1, UBXN) were significantly downregulated in MCL cases. Top differentially expressed protein-coding genes were enriched in signaling pathways related to invasion and metastasis. Survival analyses based on the abundance of tumor-infiltrating immunocytes estimated with CIBERSORTx showed that high ratios of CD8+ T-cells or resting NK cells and low ratios of eosinophils are associated with poor overall survival in diagnostic MCL cases. Integrative analysis of tumor-infiltrating CD8+ T-cell abundance and overexpressed oncogene candidates showed that MCL cases with high ratio CD8+ T-cells and low expression of FTX or PCA3 can potentially predict high-risk MCL patients. WTS results were cross-validated with qRT-PCR of selected transcripts as well as linear correlation analyses. In conclusion, expression levels of oncogenesis-associated transcripts and/or the ratios of microenvironmental immunocytes in MCL tumors may be used to improve prognostication, thereby leading to better patient management and outcomes.

Keywords: WTS; alternative transcript; lncRNA; mRNA; mantle cell lymphoma; oncogene; prognosis; tumor microenvironment; tumor suppressor.


Conflict of interest statement

The authors declare no conflict of interest.

Figures

Figure 1
Figure 1
The overall workflow of the experiments and analyses.
Figure 2
Figure 2
CCND1, SOX11, ROR1-AS1, and LINK-A transcripts are upregulated in MCL tumors. The transcript expression levels of CCND1 and SOX11 mRNAs as well as ROR1-AS1 and LINK-A lncRNAs in 32 MCL samples were compared with the 5 reactive tonsil B-cell subtype samples by DESeq2 analysis of whole transcriptome sequencing data. Box-and-whisker plots are shown for CCND1 (A), SOX11 (B), ROR1-AS1 (C), and LINK-A (LINC001139) (D) transcripts with the statistical significance indicated as adjusted p values over each plot.
Figure 3
Figure 3
PCA plots of reactive tonsil B-cell subsets and MCL cases. PCA plots of diagnostic, relapsed MCL, and control samples generated based on only mRNA (A), only lncRNA (B), or both mRNA and lncRNA (C) transcript expression profiles are shown. Control samples represent reactive tonsil B-cell subset samples used for WTS. The patient codes of the outlier cases are indicated on the plots.
Figure 4
Figure 4
Biological processes or pathways associated with top 100 differentially expressed transcripts. Biological processes or pathways associated with statistically significant differentially expressed top 100 mRNAs (A), lncRNAs (B), and alternative transcripts (C) are shown with dot plots (A,C) or with a horizontal bar graph (B). GeneRatio and Count on plots represent the ratio of the genes that are annotated in a term and the number of genes that are a member to a given gene-set, respectively.
Figure 5
Figure 5
The transcript levels of top 10 cancerogenesis-associated protein-coding genes. Box-and-whisker plots of the 10 cancerogenesis-associated mRNAs that are most significantly overexpressed in 32 MCL samples compared with the 5 B-cell subtype samples are shown in the statistical significance order (AJ).
Figure 6
Figure 6
The transcript expression levels of the 10 most significantly downregulated tumor suppressor candidates in MCL. Tumor suppressor candidate transcript expression levels that are most significantly downregulated are shown for 32 MCL samples and 5 reactive tonsil B-cell subset samples as box-and-whisker plots in the statistical significance order (AJ). Adjusted p values show the statistical significance of expression differences between MCL and the control samples.
Figure 7
Figure 7
The transcript levels of top 10 cancerogenesis-associated lncRNA genes. Box-and-whisker plots of the 10 cancerogenesis-associated lncRNAs that are most significantly overexpressed in 32 MCL tumor samples compared with the 5 reactive tonsil B-cell subtype samples are shown in the order of decreasing statistical significance (AJ).
Figure 8
Figure 8
The transcript expression levels of the 10 most significantly downregulated tumor suppressor candidate lncRNA genes in MCL. Tumor suppressor candidate lncRNA expression levels that are most significantly downregulated are shown for 32 MCL samples and 5 reactive tonsil B-cell subset samples as box-and-whisker plots in the order of decreasing statistical significance (AJ). Adjusted p values show the statistical significance of expression differences between MCL and the control samples.
Figure 9
Figure 9
Top overexpressed transcripts significantly associated with MCL overall survival. MCL cases were dichotomized based on the mRNA or lncRNA expression levels of the top 10 cancerogenesis-related genes or the top 20 upregulated alternative transcripts. Kaplan–Meier curves of VWF mRNA (A,B), FTX lncRNA (C,D) and MSTRG.153013.3 alternative transcript (E,F) whose expression are significantly associated with poor or good overall survival in all (A,C,E) or diagnostic cases (B,D,F). p < 0.05 is considered statistically significant. High: High transcript expression. Low: Low transcript expression.
Figure 10
Figure 10
Microenvironmental immunocytes associated with overall survival of MCL patients. Kaplan-Meier plots show the tumor-infiltrating immunocytes that are associated with poor (AC) or good (D) overall survival. High: High ratio of the immune cell. Low: Low ratio of the immune cell. All cases: 27 diagnostic and 4 relapsed MCL.
Figure 11
Figure 11
High tumor-infiltrating CD8+ T-cell ratio together with low FTX or PCA3 expression predicts high-risk MCL patients. Kaplan–Meier plots showing the curves based on a combination of tumor-infiltrating CD8+ T-cell ratios and FTX (A,B) or PCA3 (C,D) transcript expression levels. L/L: Low CD8+ T-cell abundance and low transcript expression; L/H: Low CD8+ T-cell abundance and high transcript expression; H/L: High CD8+ T-cell abundance and low transcript expression; H/H: High CD8+ T-cell abundance and high transcript expression.
Figure 12
Figure 12
qRT-PCR cross-validates CCND1 and SNHG5 expression levels based on whole transcriptome sequencing. Box-and-whisker plots showing CCND1 mRNA WTS (A) and qRT-PCR (B) expression levels in MCL cases and control B-cell subsets. Box-and-whisker plots representing SNHG5 lncRNA WTS (C) and qRT-PCR (D). Linear correlation graphics comparing relative expression levels based on whole transcriptome sequencing and qRT-PCR for CCND1 mRNA (E) or SNHG5 lncRNA (F). CCND1 linear correlation graphic involves one value for each of NBC, MBC, and CC B-cell subsets as well as values for 24 MCL tumor tissue samples. SNHG5 linear correlation graphic involves the same set of control sample values in addition to 22 MCL tumor tissue samples. WTS: whole transcriptome sequencing; R: Pearson product-moment correlation.

References

    1. Armitage J.O., Longo D.L. Mantle-Cell Lymphoma. N. Engl. J. Med. 2022;386:2495–2506. doi: 10.1056/NEJMra2202672. - DOI - PubMed
    1. Jares P., Colomer D., Campo E. Genetic and molecular pathogenesis of mantle cell lymphoma: Perspectives for new targeted therapeutics. Nat. Rev. Cancer. 2007;7:750–762. doi: 10.1038/nrc2230. - DOI - PubMed
    1. Veloza L., Ribera-Cortada I., Campo E. Mantle Cell Lymphoma Biology. Clin. Lymphoma Myeloma Leuk. 2018;18:S97–S98. doi: 10.1016/j.clml.2018.06.070. - DOI
    1. Beekman R., Amador V., Campo E. SOX11, a key oncogenic factor in mantle cell lymphoma. Curr. Opin. Hematol. 2018;25:299–306. doi: 10.1097/MOH.0000000000000434. - DOI - PubMed
    1. Jain P., Wang M. Mantle cell lymphoma: 2019 update on the diagnosis, pathogenesis, prognostication, and management. Am. J. Hematol. 2019;94:710–725. doi: 10.1002/ajh.25487. - DOI - PubMed

Publication types